Shear tests in beams with low amounts of stirrups
Introduction
This article discusses the use of the CSFM to analyze shear failures in beams with low amounts of stirrups. To this end, a selection of tests performed on simply supported reinforced concrete beams by Huber (2016), Piyamahant (2002) and Vecchio and Shim (2004) are analyzed. These tests comprised a wide number of parameters, including different sizes, shear slenderness and amounts of shear and longitudinal reinforcement. This section describes the analysis of 17 experiments from these campaigns using the CSFM, exploring the ability of the CSFM to properly model very different failure modes ranging from shear failures with and without rupture of the stirrups to bending failures and mixed shear-bending failures.
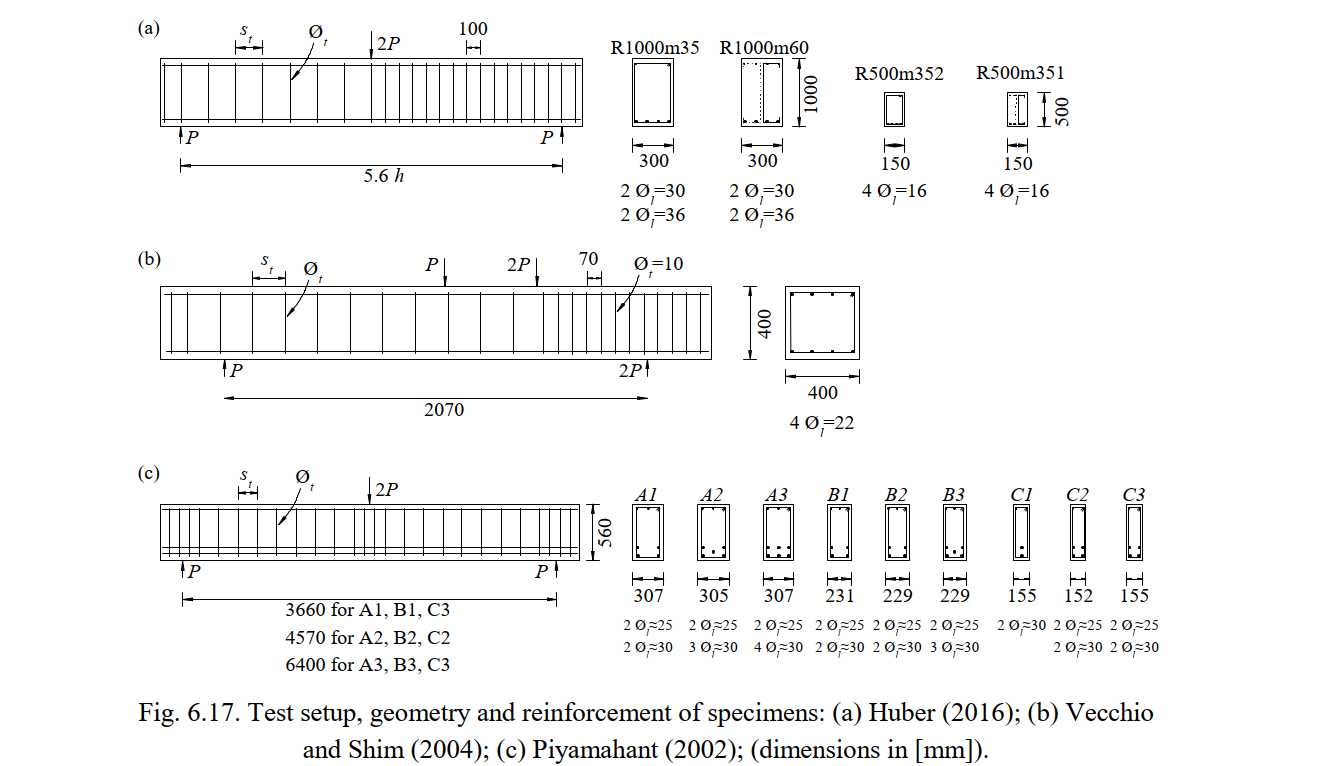
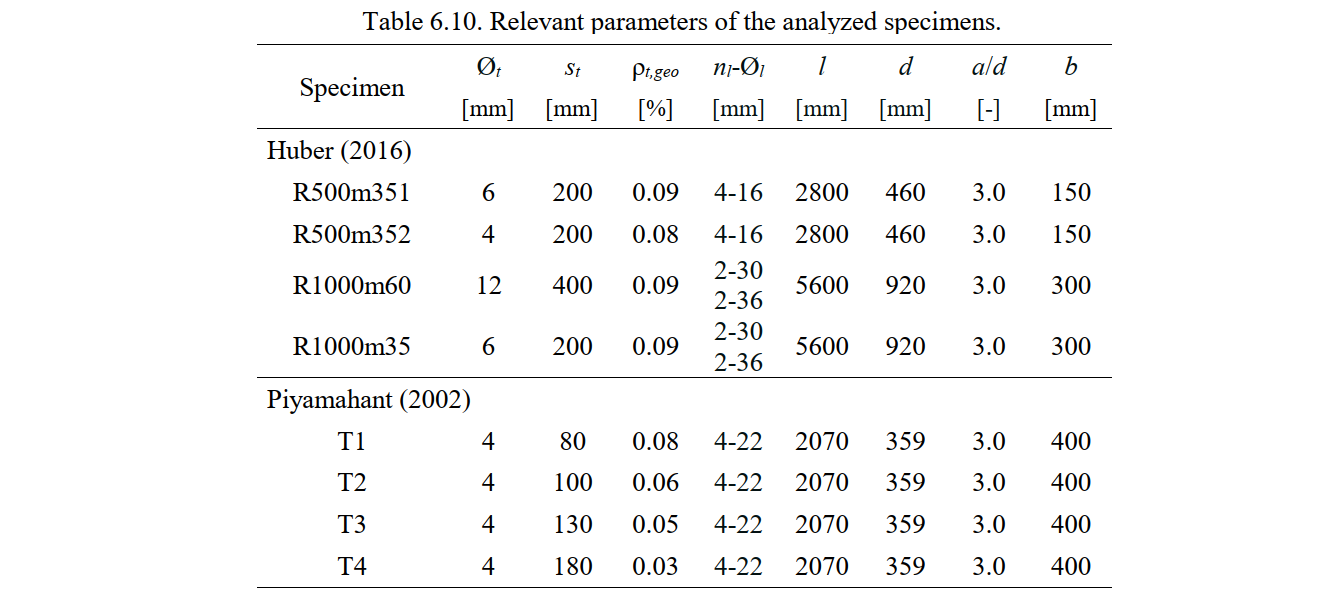
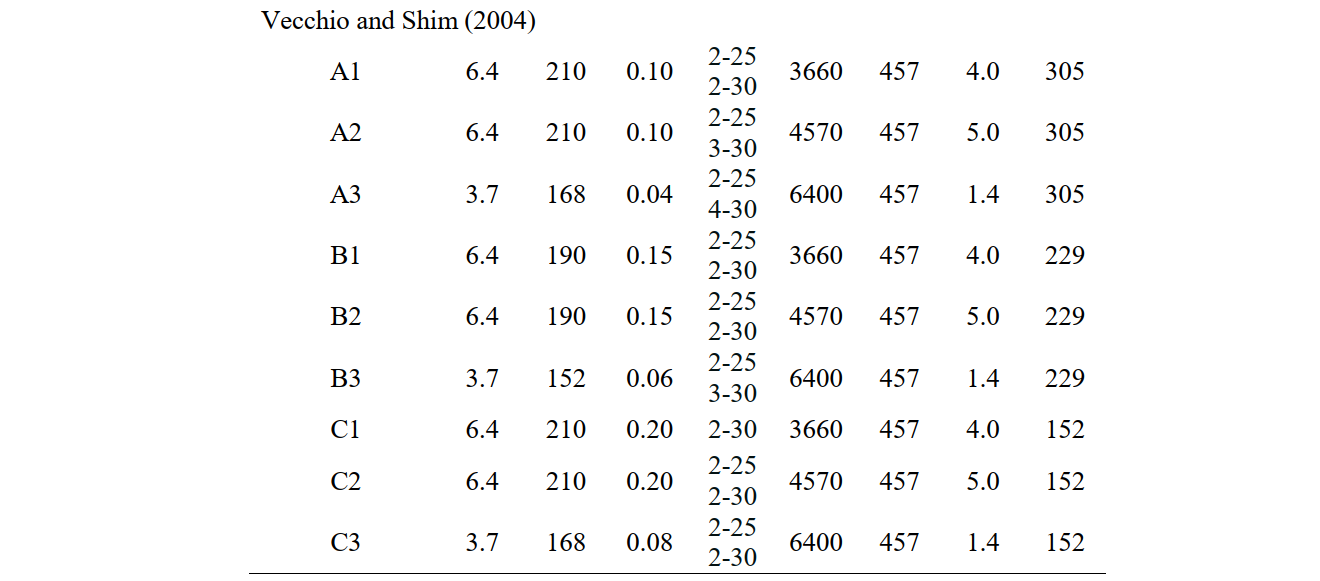
Experimental setup Fig. 6.17 shows the geometry, test setups and reinforcement layouts of the analyzed experiments. Information on the shear reinforcement (diameter (Øt) , spacing (st) and geometric reinforcement ratio (ρt,geo)), the flexural reinforcement (number (nl) and diameter (Øl)) and geometry (effective depth (d), shear slenderness (a/d) and width of the beams (b)) is presented in Table 6.10. Tests R1000m60 and R500m351 conducted by Huber (2016) had one-leg hooks, while in all other tests used two-leg closed stirrups. In the analyzed tests from Piyamahant (2002) the geometry and the flexural reinforcement were kept constant, while in the other two studies they were varied.
Definition of failure modes
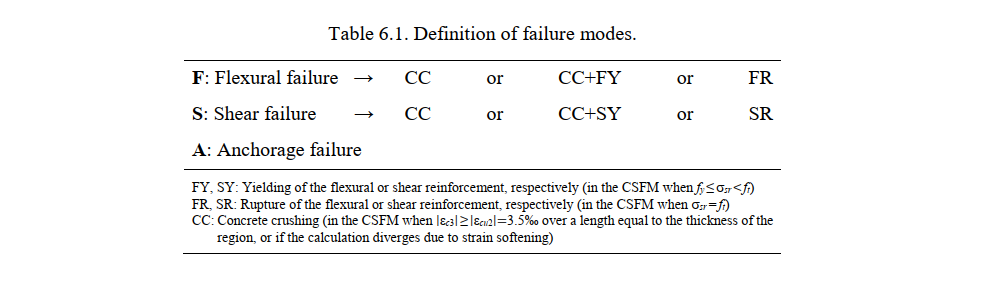
In order to compare the observed failure modes in the experiments with those predicted by the CSFM, the failure modes are classified as follows: flexural (F), shear (S) and anchorage (A). It should be noted that none of the experiments covered in this chapter exhibited an anchorage failure. Table 6.1 defines different failure subtypes depending on whether flexural and shear fail-ures are triggered by failure of the concrete or of the reinforcement. While yielding of the reinforcement does not represent a material failure, this is included as a failure subtype in combination with concrete crushing due to the importance of distinguishing concrete crushing failures without reinforcement yielding (very brittle) from those happening after the yielding of the reinforcement (which can exhibit a certain deformation capacity).
Material properties
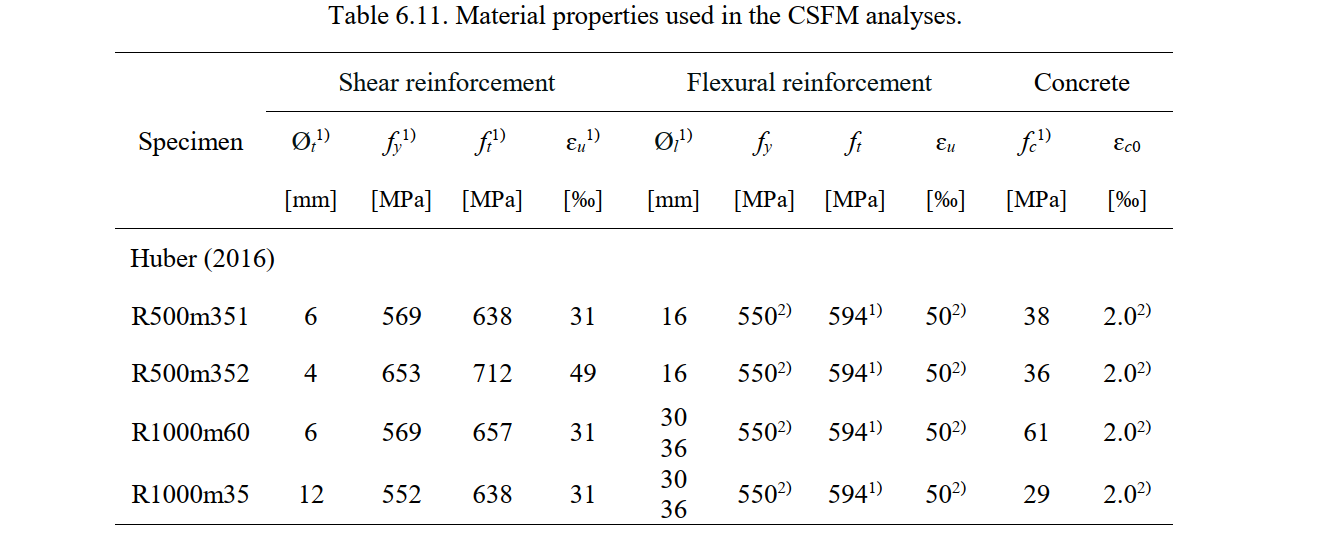
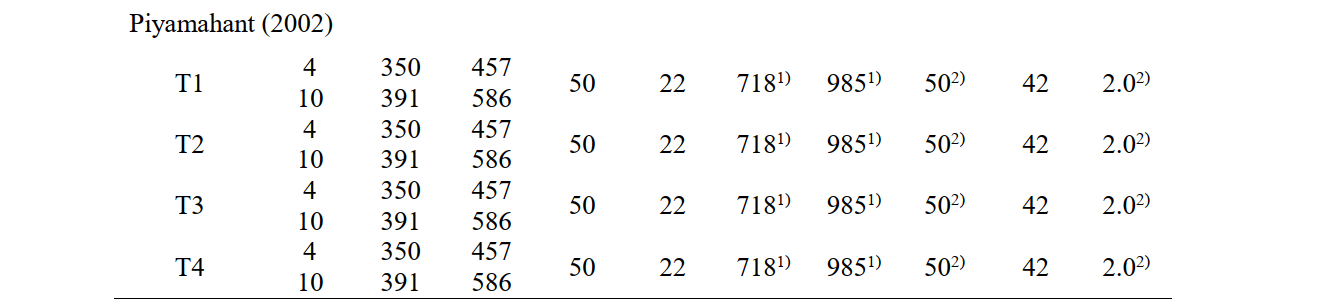
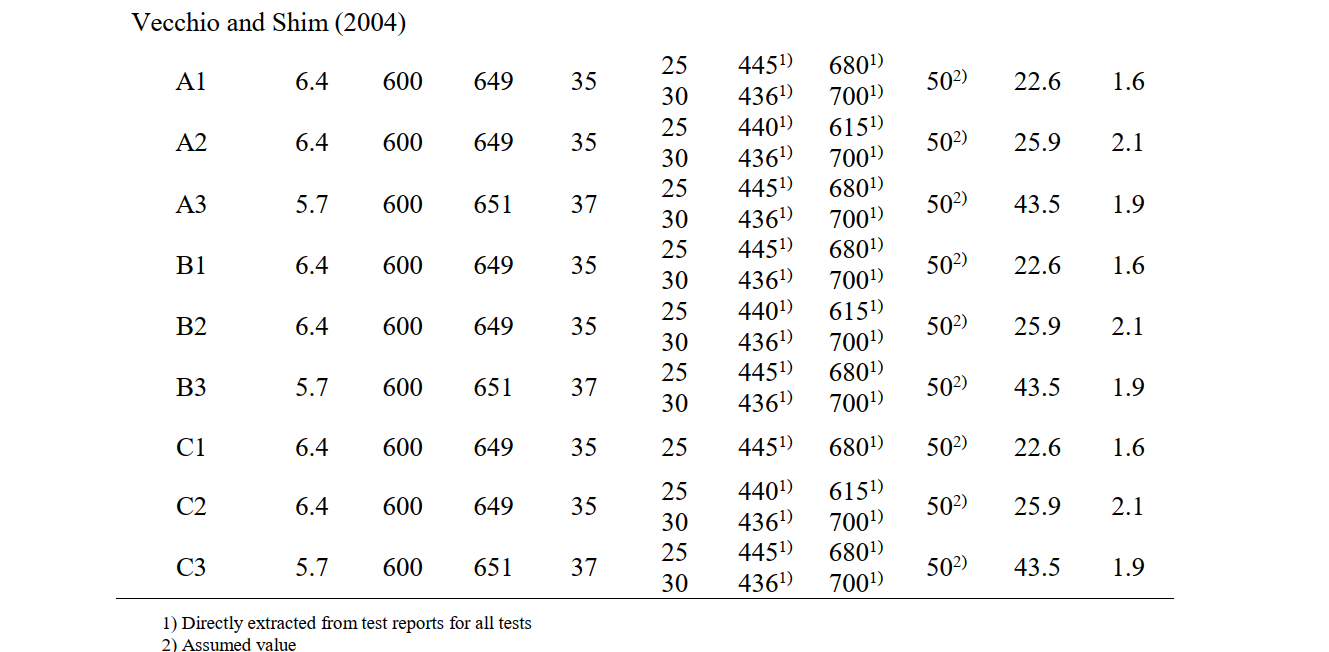
The material properties of the shear reinforcement, the flexural reinforcement and the concrete used in the CSFM analysis are summarized in Table 6.11. Most of the material properties required for the CSFM analysis were available in the corresponding test reports. The values that had to be assumed are indicated in Table 6.11.
Modeling with the CSFM
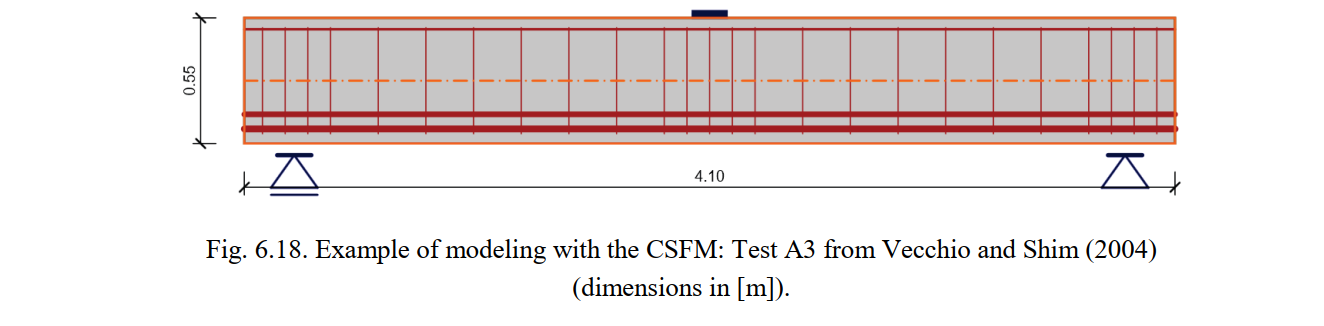
The geometry, reinforcement, support and loading conditions were modeled in the CSFM according to the experimental setups. Fig. 6.18 shows the modeling of Test A3 from Vecchio and Shim (2004) as an example.
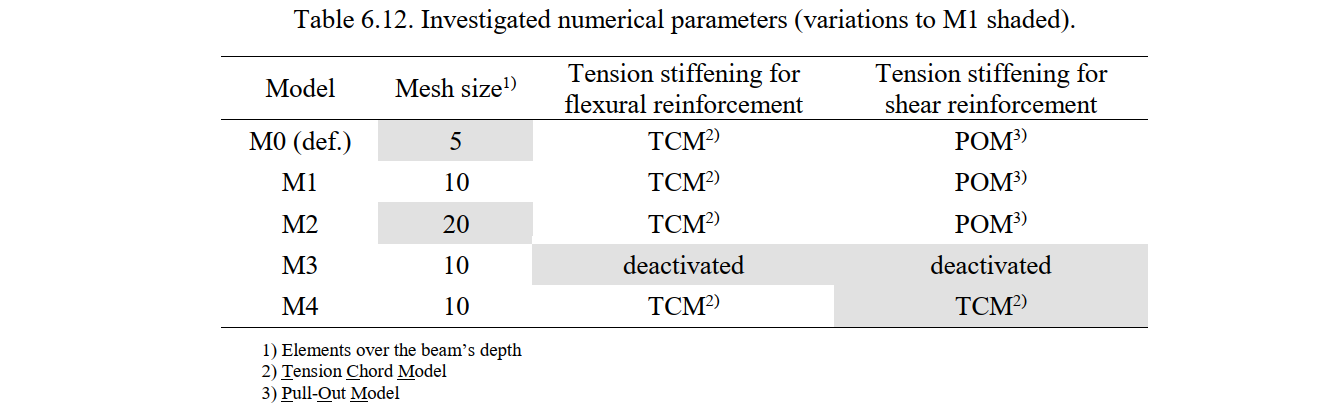
For each test, four numerical calculations were carried out using the following parameters:
- The mesh size, which varied from 5 (default value for these particular examples), through 10 up to 20 finite elements over the beam depth. Since the default mesh is already very coarse, only finer meshes are analyzed in this study, and the mesh with 10 elements was used except in M0.
- The consideration or not of the tension stiffening effect. By default tension stiffening is considered in the CSFM.
- The consideration or not of potentially non-stabilized cracking in stirrups. When considered (by default), the Pull-Out Model (POM) defines tension stiffening in stirrups (the geometric reinforcement ratios of all beams is below (ρcr),so the Tension Chord Model is never used). When deactivated, the models account for tension stiffening by means of the TCM.
\[ρ_{\text{cr}} = \frac{f_{\text{ct}}}{f_{\text{y}} - (n-1)f_{\text{ct}}}\]
where:
- \(f_y\) - reinforcement yield strength
- \(f_{ct}\) - concrete tensile strength
- \(n = \frac{E_s}{E_c}\) - modular ratio
Table 6.12 shows the parameters used in each numerical calculation. M0 corresponds to the model with the default settings in the CSFM.
Comparison with experimental results
This section contains comparisons between the ultimate loads and failure modes provided by the CSFM and the experimental results. In order to also verify the CSFM for serviceability behavior and deformation capacity, the load-deformation responses furnished by the model are compared with those from the tests for selected beams.
Failure modes and ultimate loads
Table 6.13 summarizes the ultimate shear forces measured in the tests (Vu,exp), the ultimate shear forces predicted by the CSFM (Vu,calc), and the respective failure modes. This table also provides the mean and coefficient of variation (CoV) of the ratios between the measured and the calculated ultimate loads for each numerical model. In all analyses (except M3, in which tension stiffening was neglected) a shear failure in the stirrups was predicted by the CSFM. This corresponds well with the failure mechanisms observed in the tests from Huber (2016) and Piyamahant (2002), but mismatches those observed in Vecchio and Shim (2004). The failure to capture the failure modes well led in this case to slightly conservative estimates of the ultimate load. Overall, the default parameters provide good strength estimates but slightly on the unsafe side (by 6% on average).
The sensitivity of the strength predictions of the CSFM to the different analyzed numerical parameters is shown in Fig. 6.19 by means of the ratio of experimental to calculated ultimate shear forces (Vu,exp/Vu,calc). The ultimate load is markedly sensitive to the selected size of the finite elements (see Fig. 6.19 a). The maximum difference between the coarsest and finest mesh (M0 and M2) amounts to 36% (Test 4 from Piyamahant (2002)), with an average difference around 15%. The predictions using default parameters (5 finite elements over the beam’s height in model M0) slightly overestimate the experimental strength (around 5%). When refining the mesh to 10 or 20 finite elements over the beam’s height (models M1 and M2, respectively), excellent strength predictions which are slightly on the safe side of the ultimate loads can be achieved. No changes in the failure modes were observed when varying the finite element mesh size. Even the results with the default mesh size are very satisfactory, considering that several experiments exhibited brittle shear failures, which are challenging to predict using design approaches.
The way tension stiffening is considered has a highly relevant impact on the strength predictions, as can be seen in Fig. 6.19 b-c. The consideration of tension stiffening in the stirrups by means of the POM (the default setting in the CSFM) leads on average to excellent agreement with the experimental results (see Fig. 6.19 b). However, neglecting tension stiffening leads to an average overestimation of the ultimate load of around 22% (see Table 6.12). When neglecting tension stiffening, the failure mode changes to flexural failure (see Table 6.12) and the observed shear failure modes are mismatched. The results are also very sensitive to the considered compression softening relationship. As can be seen in Fig. 6.19 c, the use of the Tension Chord Model in the stirrups (model M4) instead of the Pull-out Model (model M1) provides slightly better results than when neglecting tension stiffening (model M3), but still strongly overestimates the ultimate loads by about 15% (see Table 6.12). Therefore, it can be concluded that the use of the Pull-Out-Model is crucial in these examples for the proper modeling of load-bearing behavior.
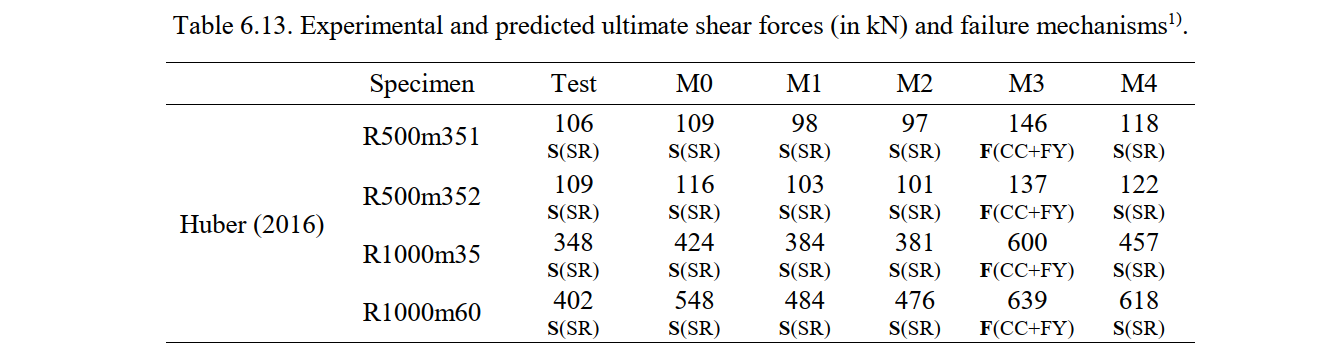
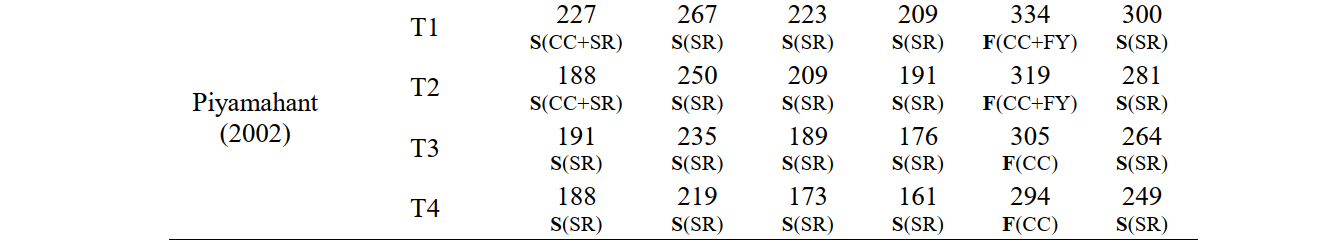
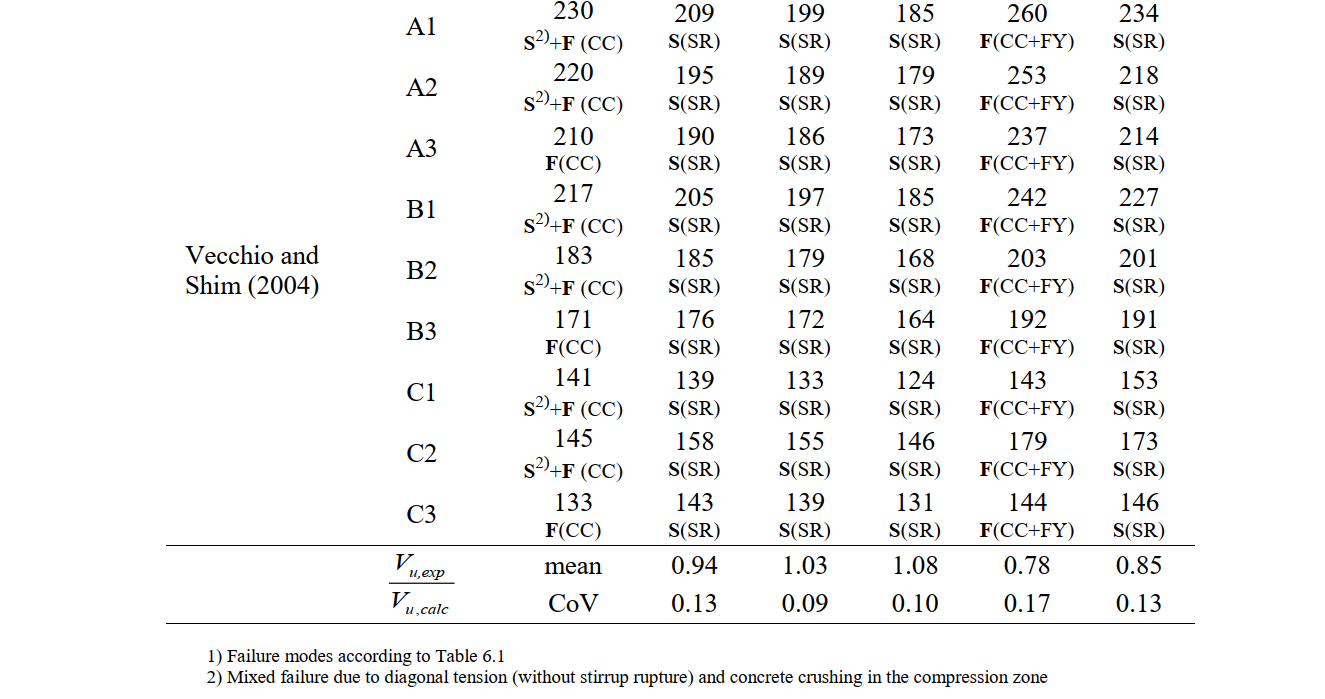
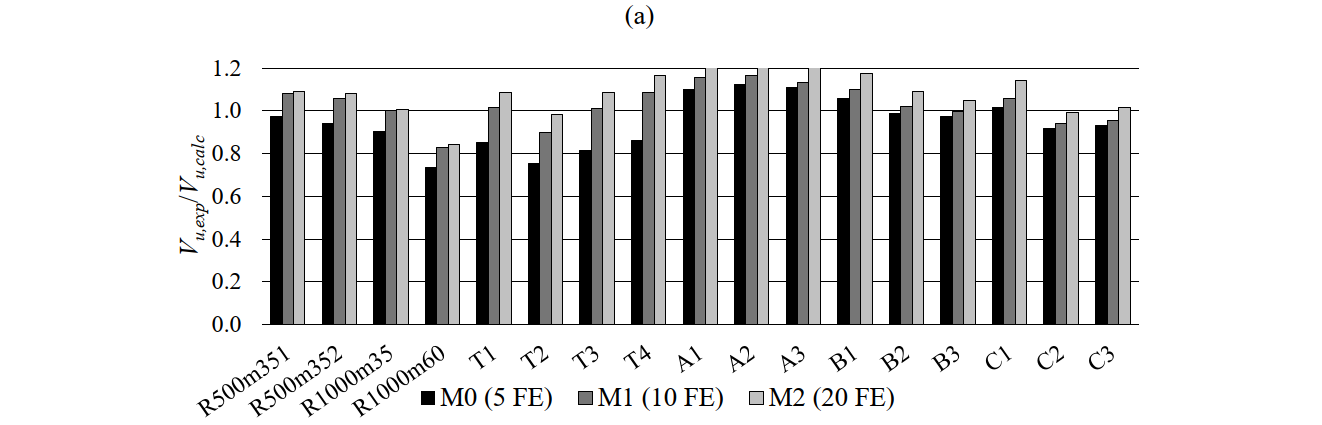
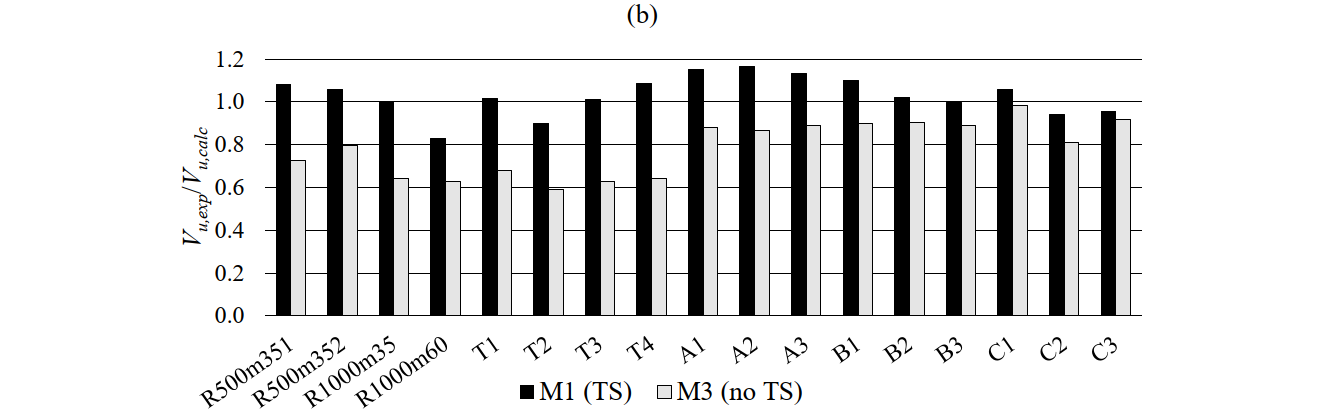
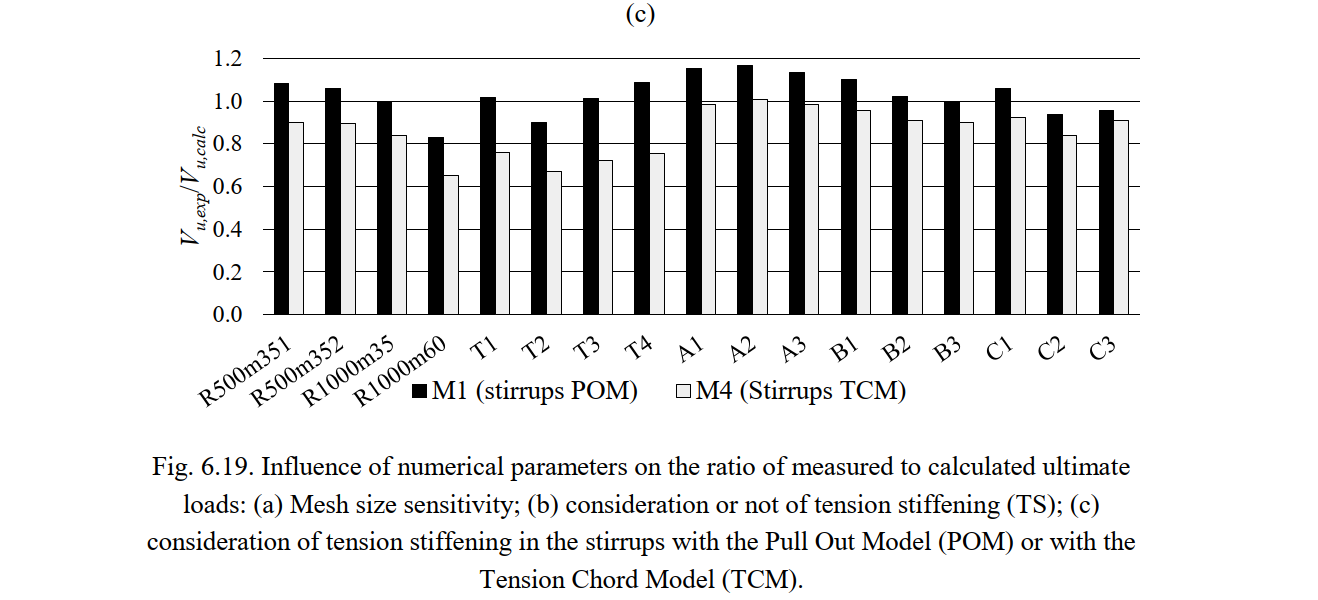
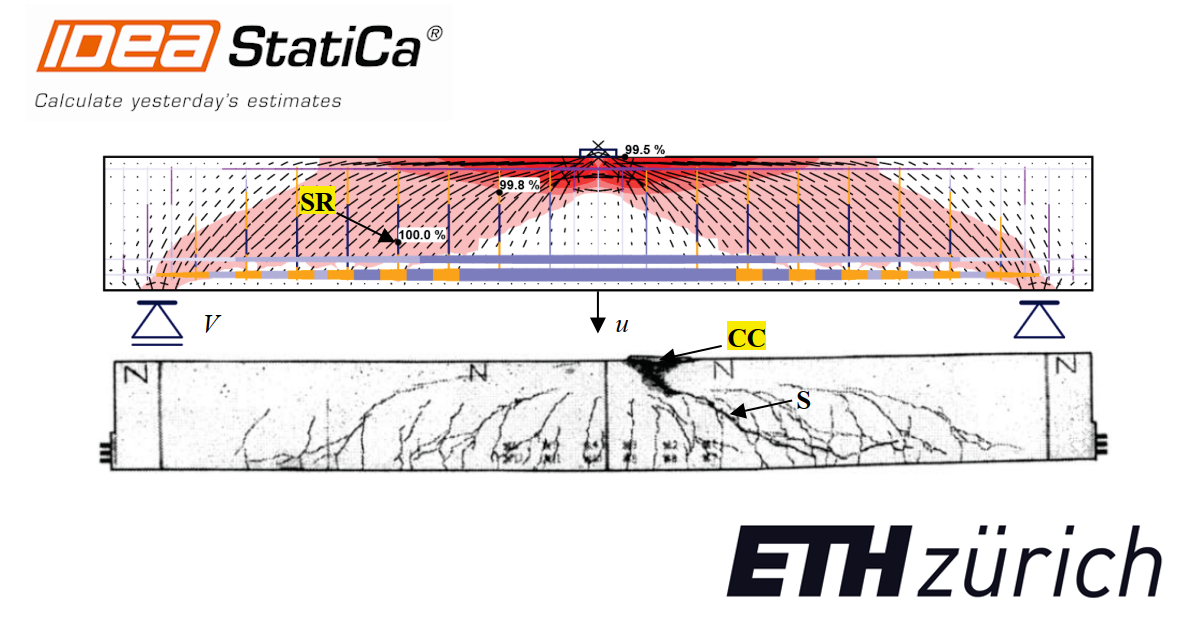
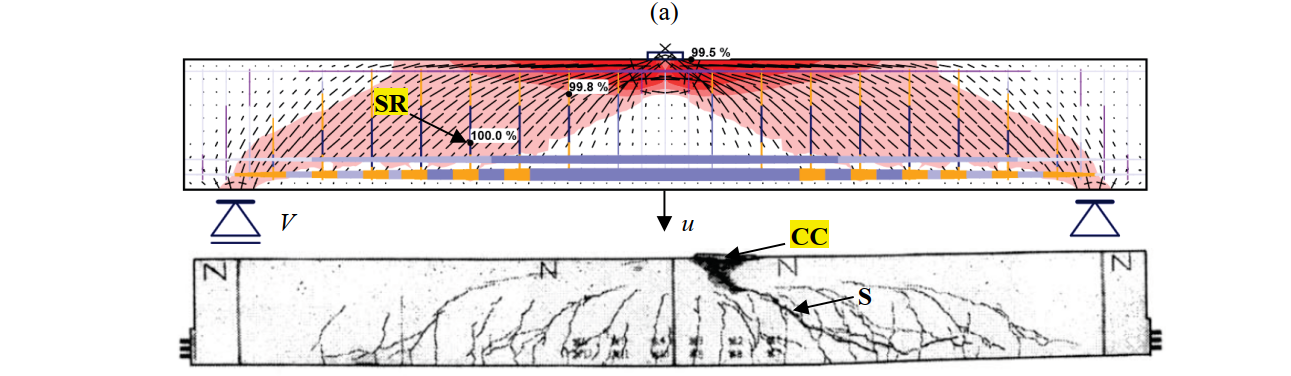
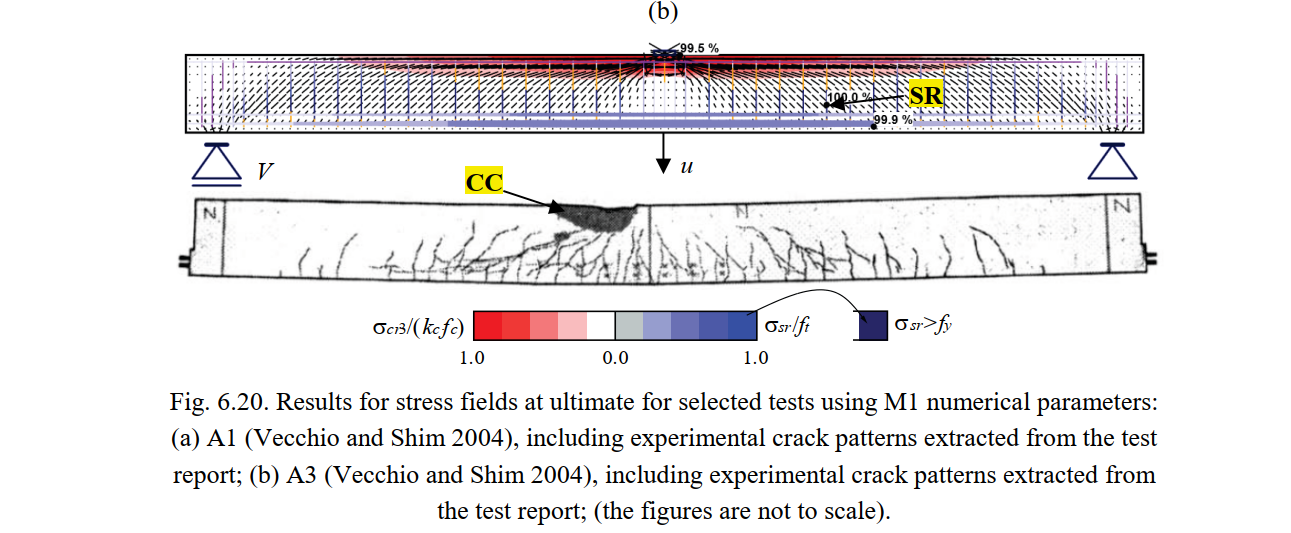
Fig. 6.20 shows the continuous stress field results (principal compressive stresses (σc) and steel stresses (σsr) at the cracks) for specimens A1 and A3 from Vecchio and Shim (2004), in which the predicted shear failures are highlighted. These results were calculated using the numerical parameters M1 (default parameters, except for the mesh size, which is half of the default value). As can be seen from the stress fields, the compressive stress in the compression zone due to bending is in the plastic branch (99.5 %). However, due to the considered criteria for concrete crushing, the rupture of the stirrups occurs before concrete crushing happens.
Load-deformation response
The calculated load-deformation responses obtained using the numerical parameters from M1 (considering the TCM for the flexural reinforcement and the POM for the stirrups) and M3 (neglecting any tension stiffening effects) are compared with the measured load-deformation responses in Fig. 6.21 for the Tests R500m352, T1, A1 and A3. The load V corresponds to the applied shear force and u corresponds to the deflection at midspan (see Fig. 6.20a).
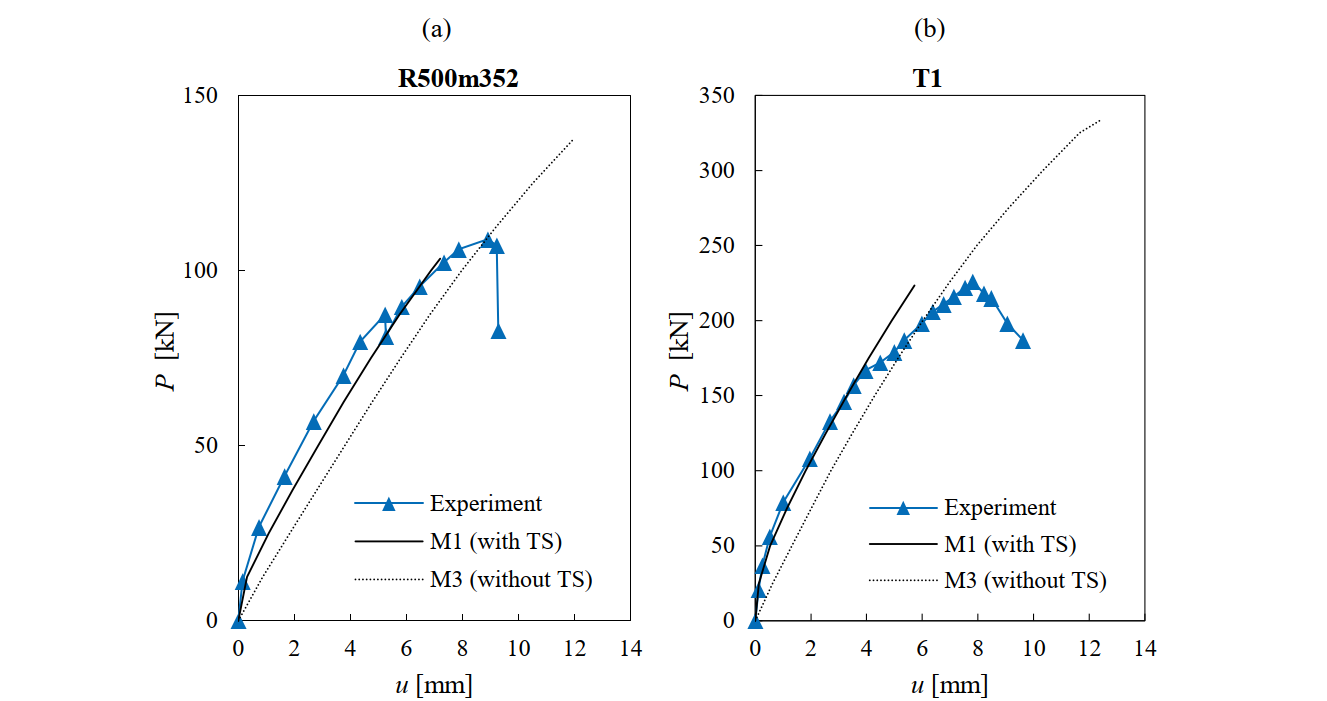
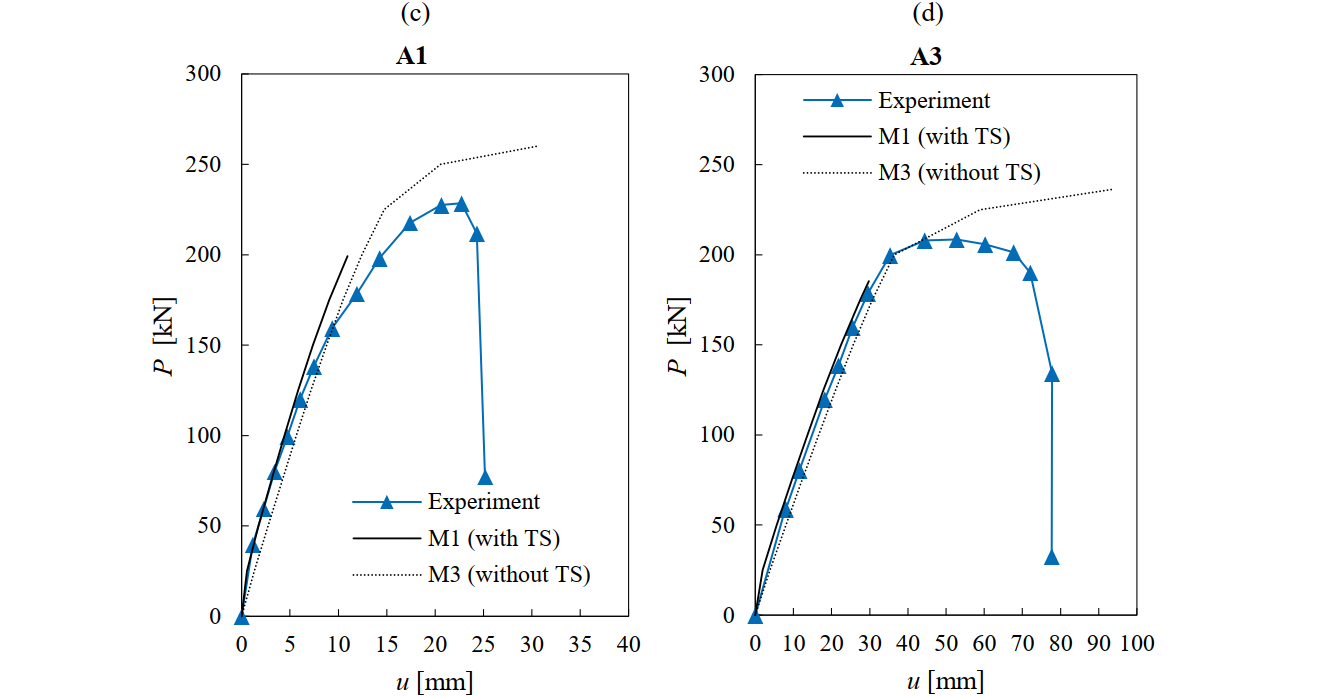

By taking into account tension stiffening effects, the experimental deflections can be predicted fairly well for the whole loading history, though the deflections at peak load are slightly underestimated. In particular, in Test A3 from Vecchio and Shim (2004), the observed plateau in the experiments due to yielding of the flexural reinforcement cannot be properly captured in the numerical analysis since the rupture of the stirrups is predicted first. Neglecting tension stiffening effects leads to the overestimation of the ultimate loads and deformations. These statements for the analyses without tension stiffening are also valid when using M4 parameters (the TCM used both in the stirrups and the flexural reinforcement).
Conclusions
The following conclusions can be stated regarding the comparison of the CSFM results and the observed behavior in the analyzed tests performed on simply supported beams with low amounts of stirrups:
- The CSFM yields good estimates of the ultimate load, which is slightly overestimated (on average by 5%) when using the default numerical parameters. It is difficult to capture combined failure modes due to shear and concrete crushing in bending; the CSFM predicts failures due to rupture of the stirrups, which leads to strength predictions that err on the conservative side.
- The ultimate load predictions are somewhat sensitive to variations in the finite element mesh size. The best predictions are obtained when the default finite element mesh is refined. Therefore, it is always recommended that the influence of the finite element size on the results be investigated when performing final verifications.
- Neglecting tension stiffening leads to a very pronounced overestimation of the ultimate load and deformation capacity. Even when modeling tension stiffening in the stirrups by means of the Tension Chord Model, the predicted ultimate load is clearly on the unsafe side. The best results are obtained when considering the effect of non-stabilized cracking in the stirrups for low amounts of reinforcement by means of the Pull Out Model. This is the tension stiffening model implemented by default in the CSFM.