Report in Detail application
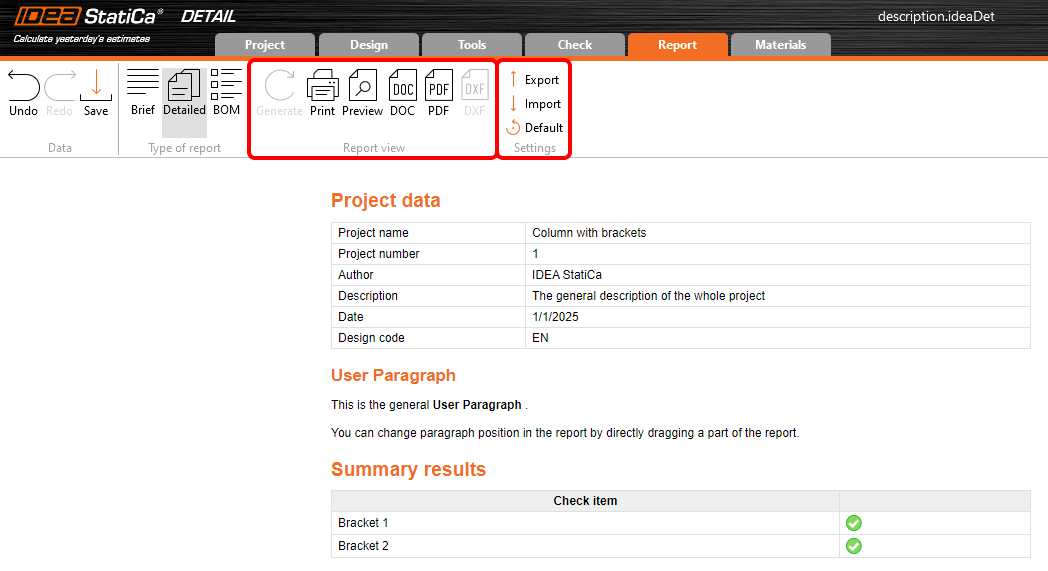
Once the discontinuity region is designed and checked, it is time to create the report. There is no need to do it manually. Simply use the report feature in the application.
Firstly, you need to set the report - what to display and what not. Images, tables, and descriptions are then created automatically. Moreover, you can add custom images made during design.
The basic structure of the report
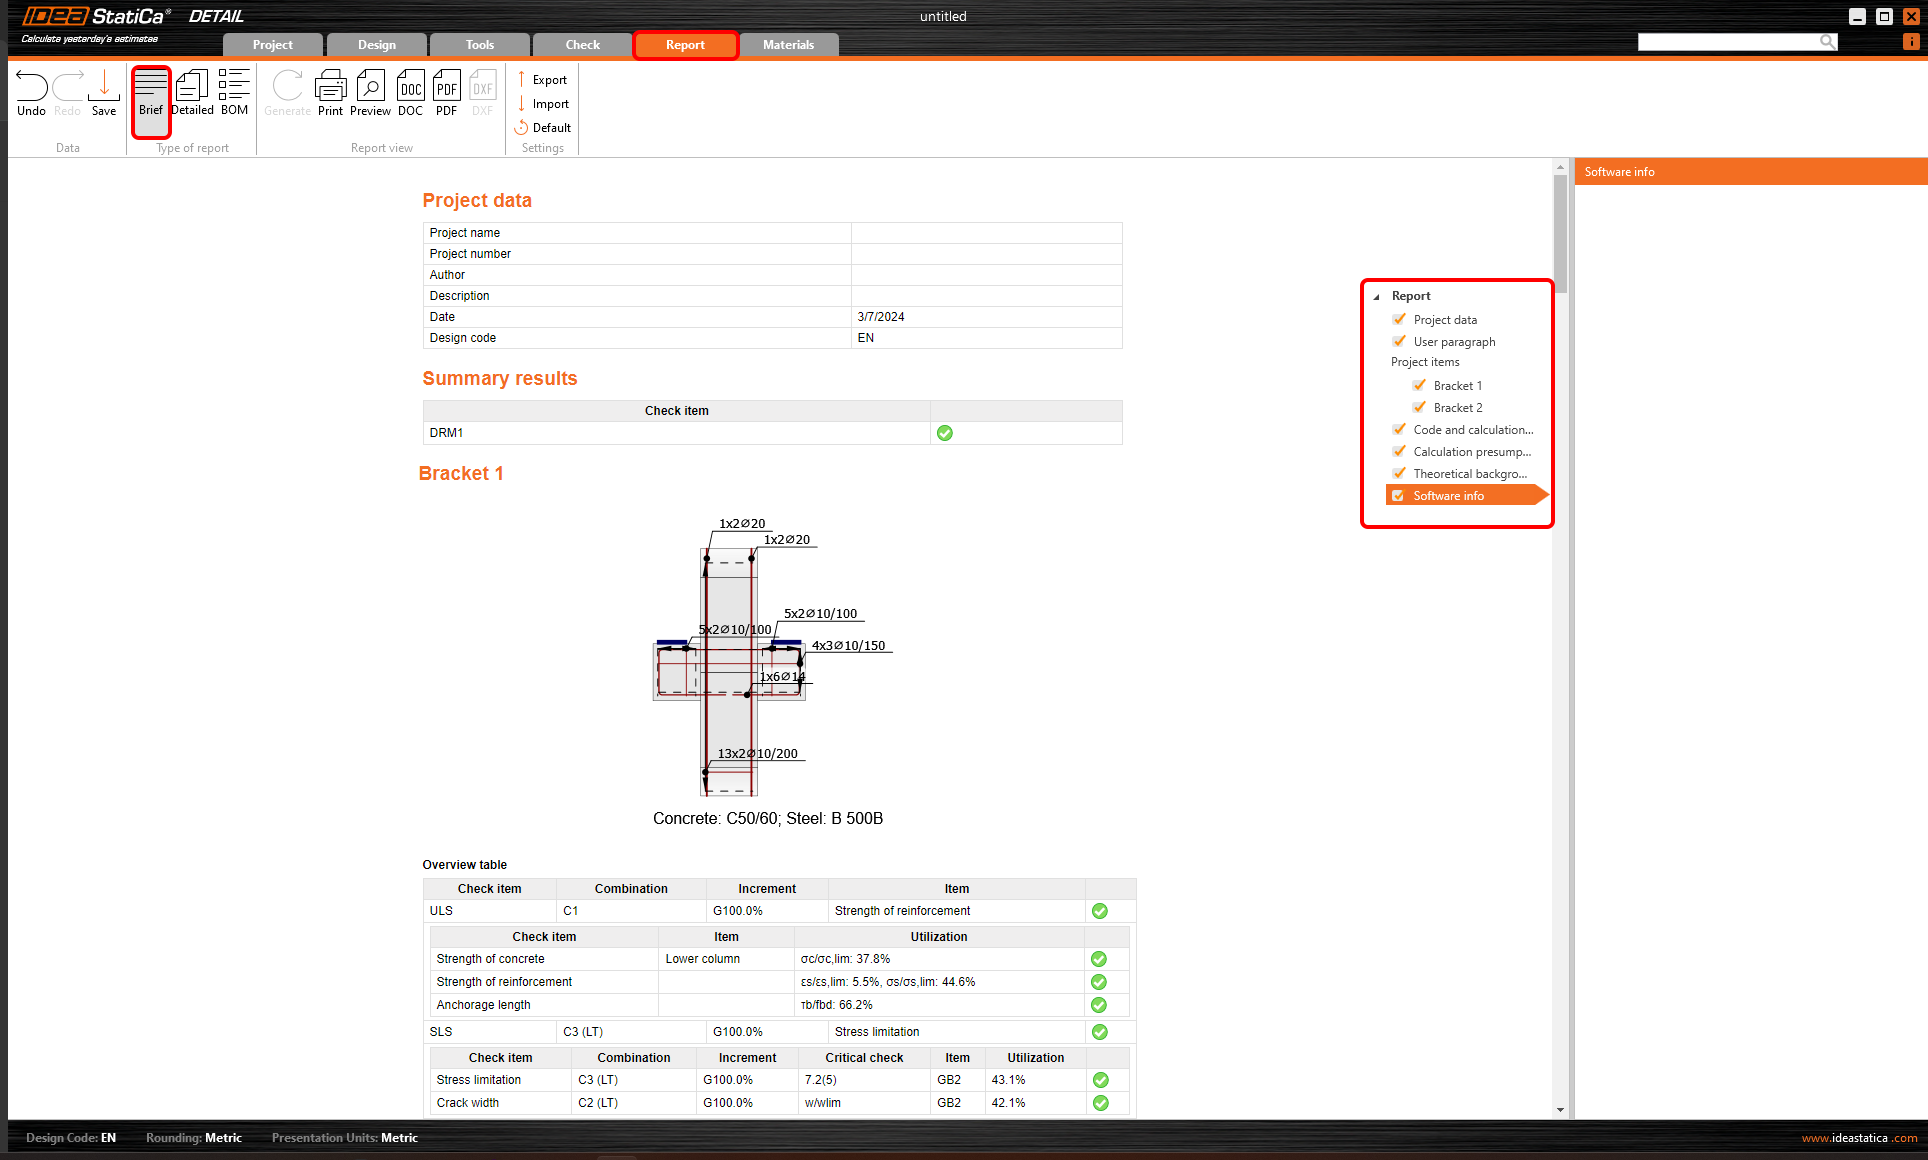
First, select the type of report. There are two options.
- Brief report
- Detailed report
The Brief report option offers a short summary of the project and its results.
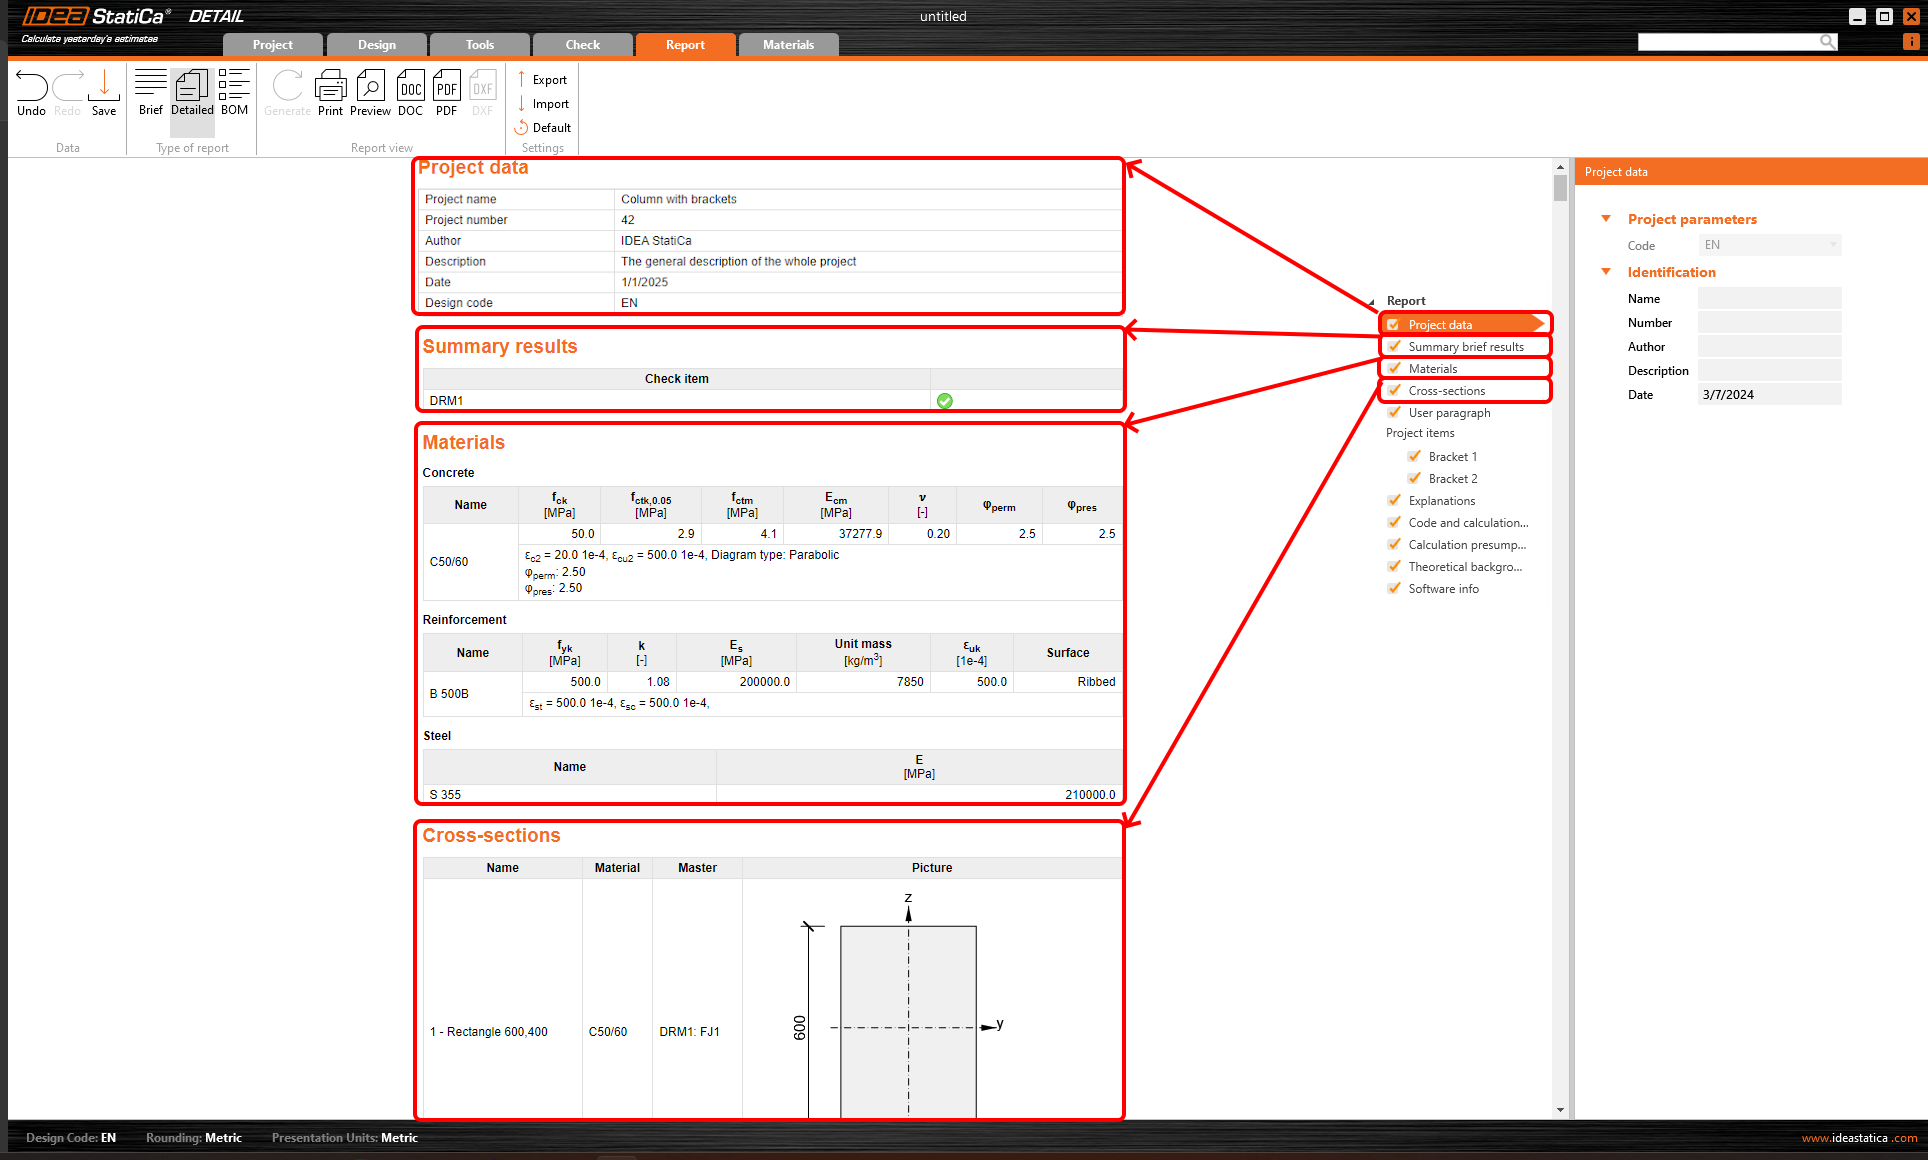
In the Detailed report, you obtain detailed information about the project and its results.

Let's look at the setting options.
Report Introduction
At the beginning of the report, you can find the introduction and essentials of the project using Project data, Summary brief results, Materials, and Cross-section options.
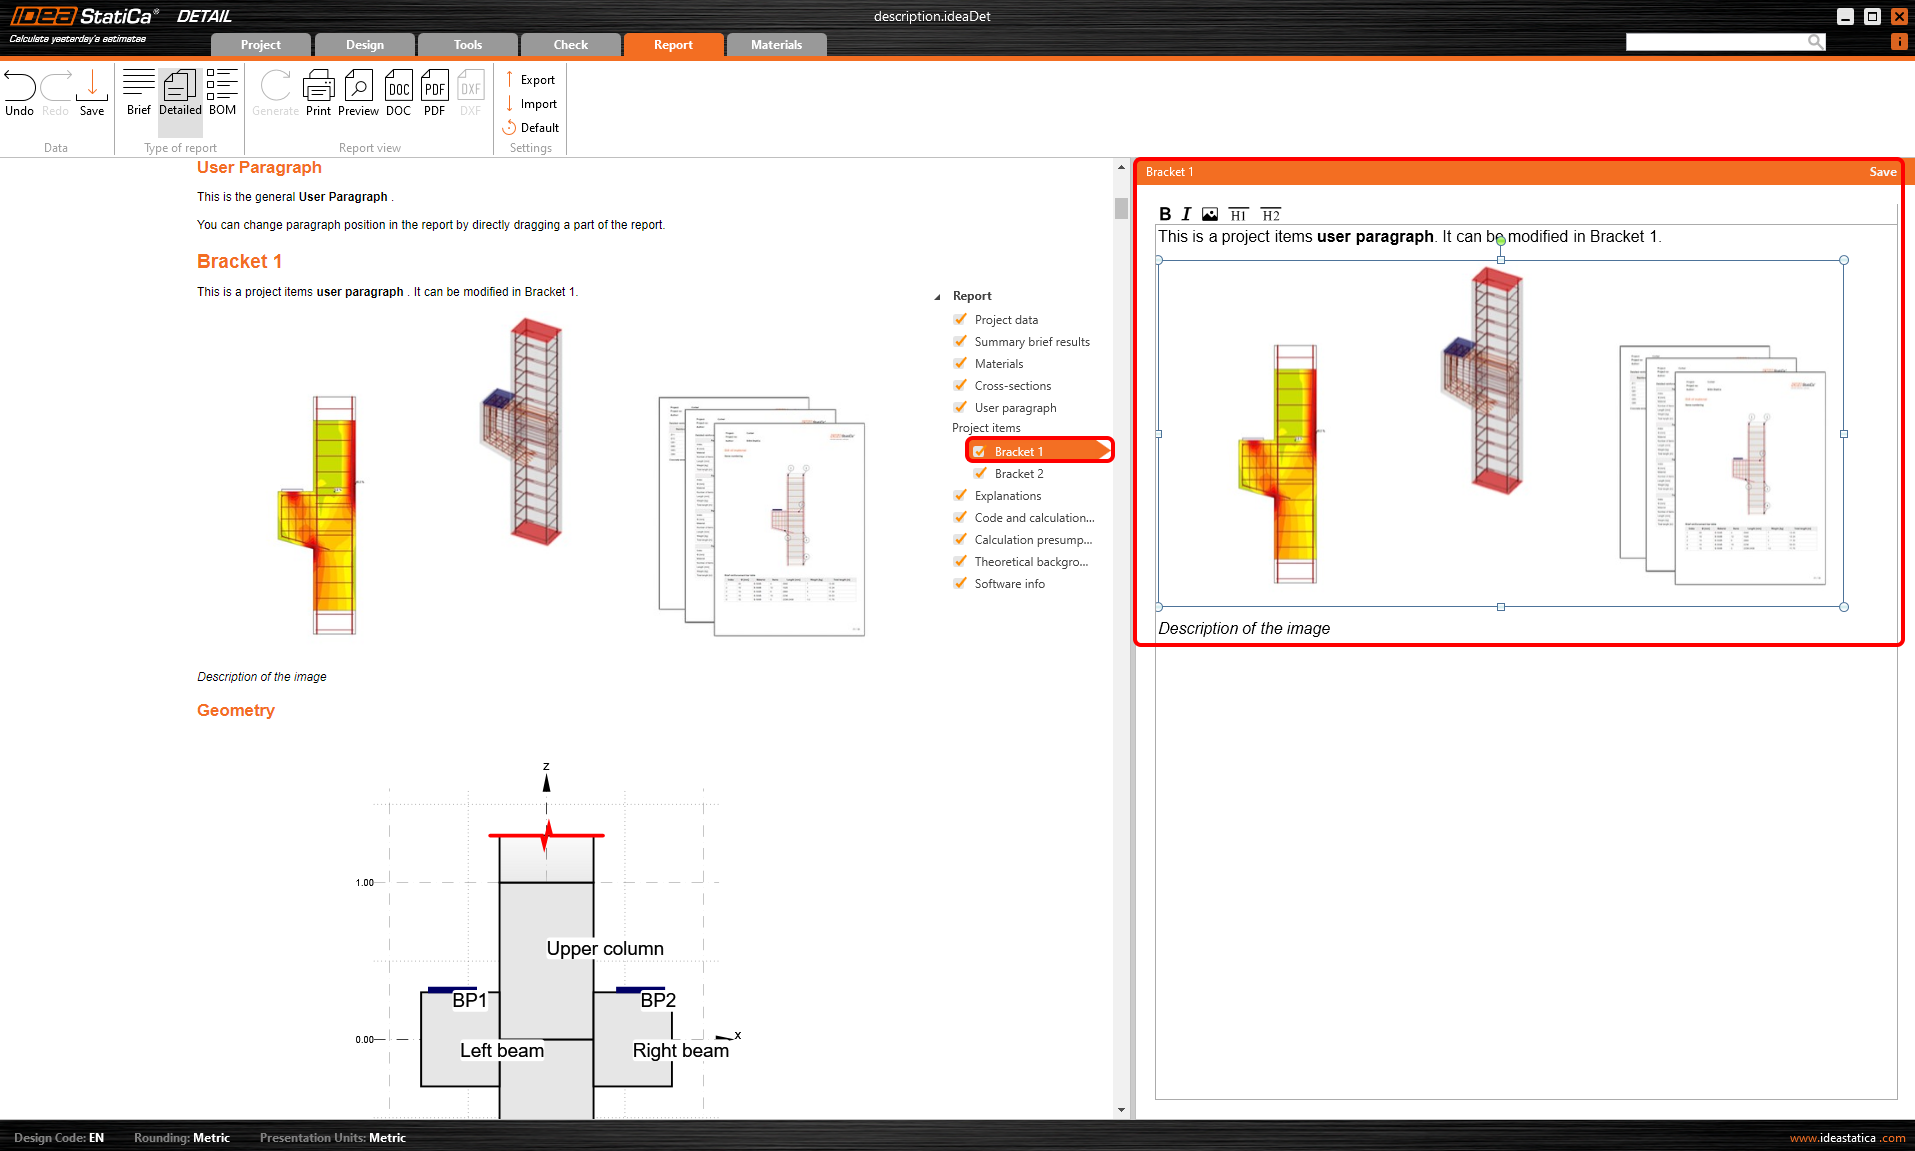
User paragraph
It is possible to add a general User paragraph with additional information. To set the User paragraph for the individual project item, select the item, and define the paragraph. You can write a description and include various images.
The order of the items can be changed manually. Simply drag and drop paragraphs to change their order in the report. When you refresh the view, the final document updates automatically to match the new arrangement.

Project items settings
In IDEA StatiCa Detail, there is an option to have more project items (Discontinuity regions) in one file. Thus, it is possible to generate the report for all items in the project or only selected ones. The selection is made in the Data tab in the navigator tree.
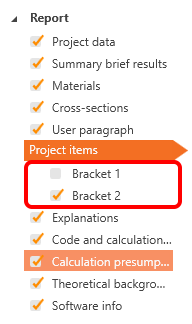
Selecting the Project items option in the navigator tree allows modifying the report for several individual sections.
Let's have a look at the settings for each section.
Geometry
You can include the image with the geometry of the structure and the geometry overview table.
The relative width of the picture can also be manually set.
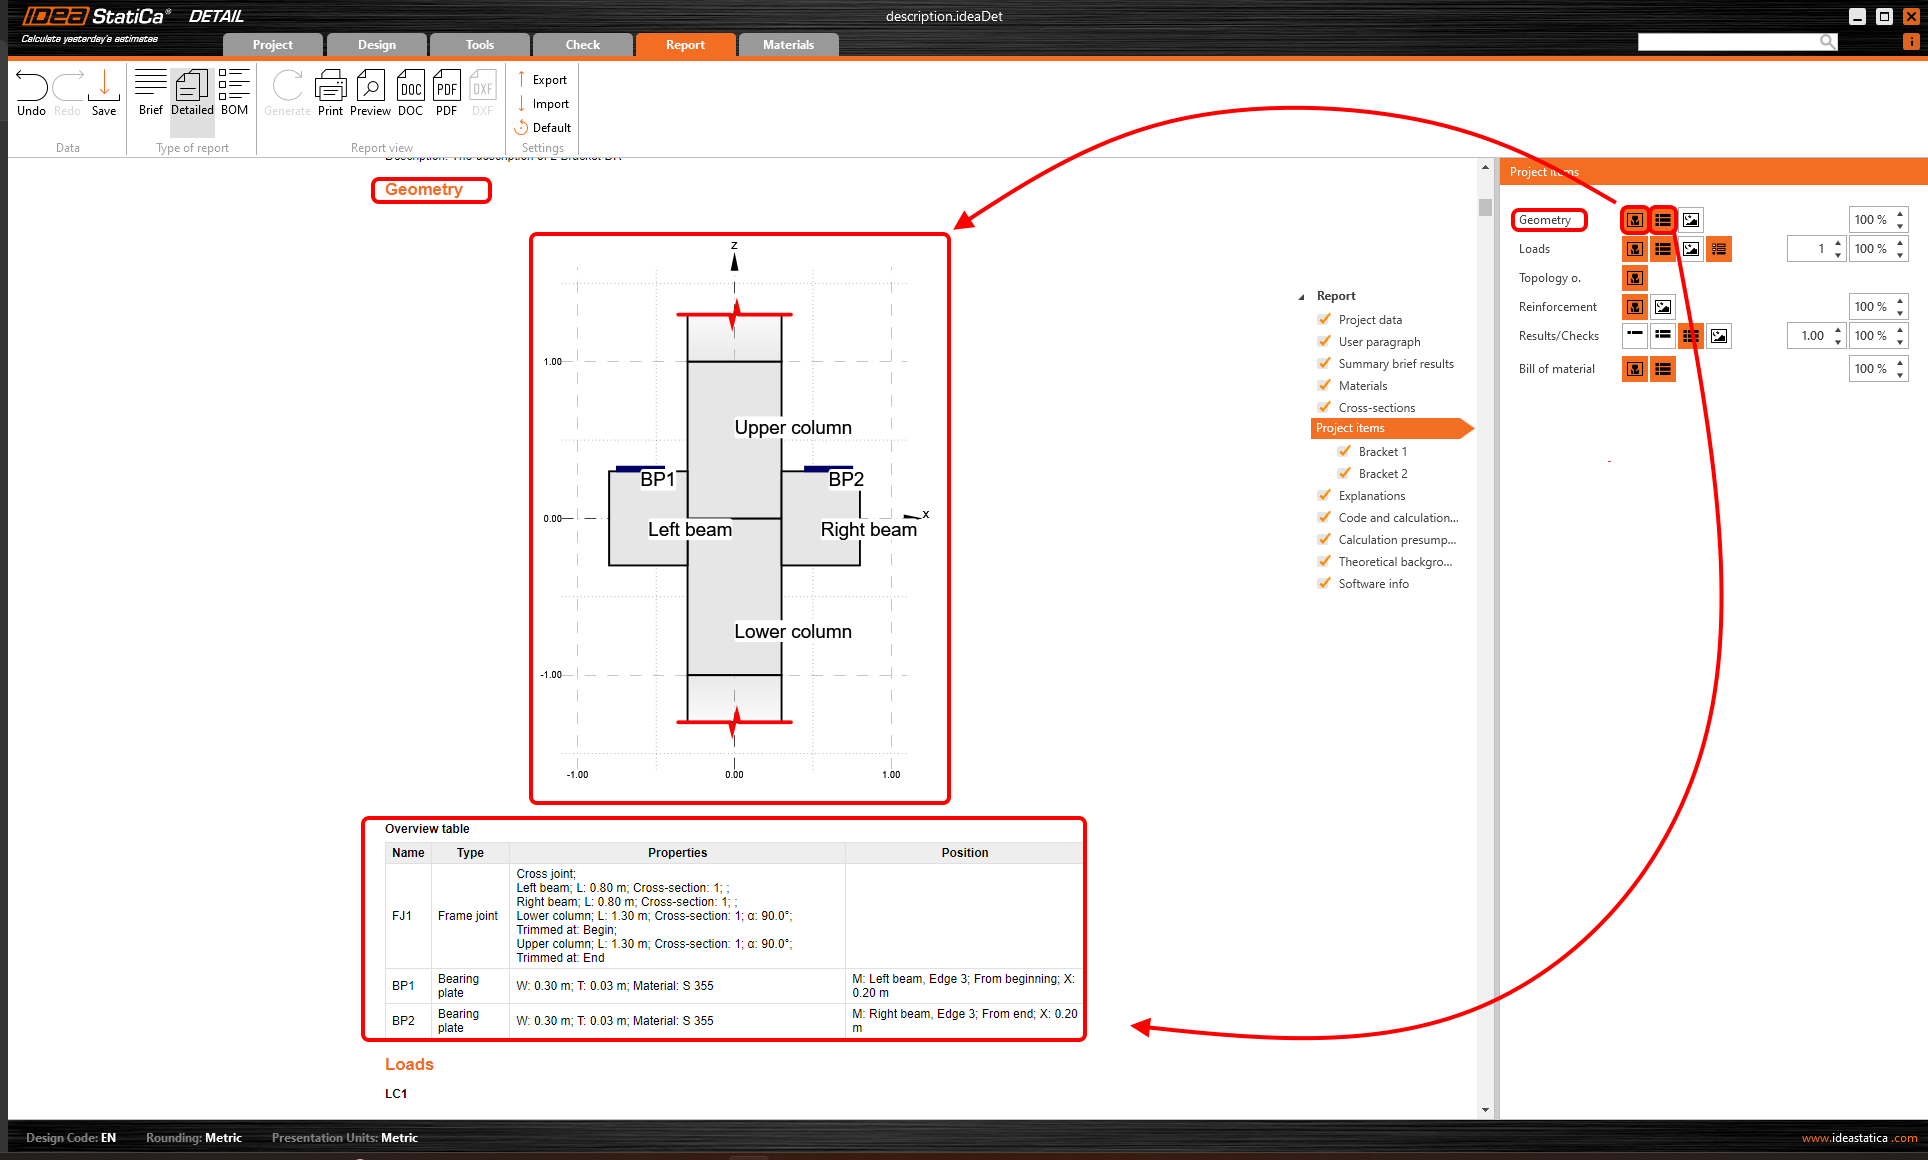
The third option in the Geometry settings serves to add user-defined pictures to the chapter via the gallery feature.
Loads
It is possible to display any load combination including internal forces diagrams. Moreover, add a table of load effects.
The relative width of the picture can be controlled, as well as the number of pictures in one line. In addition, you can see load cases included in active combinations.

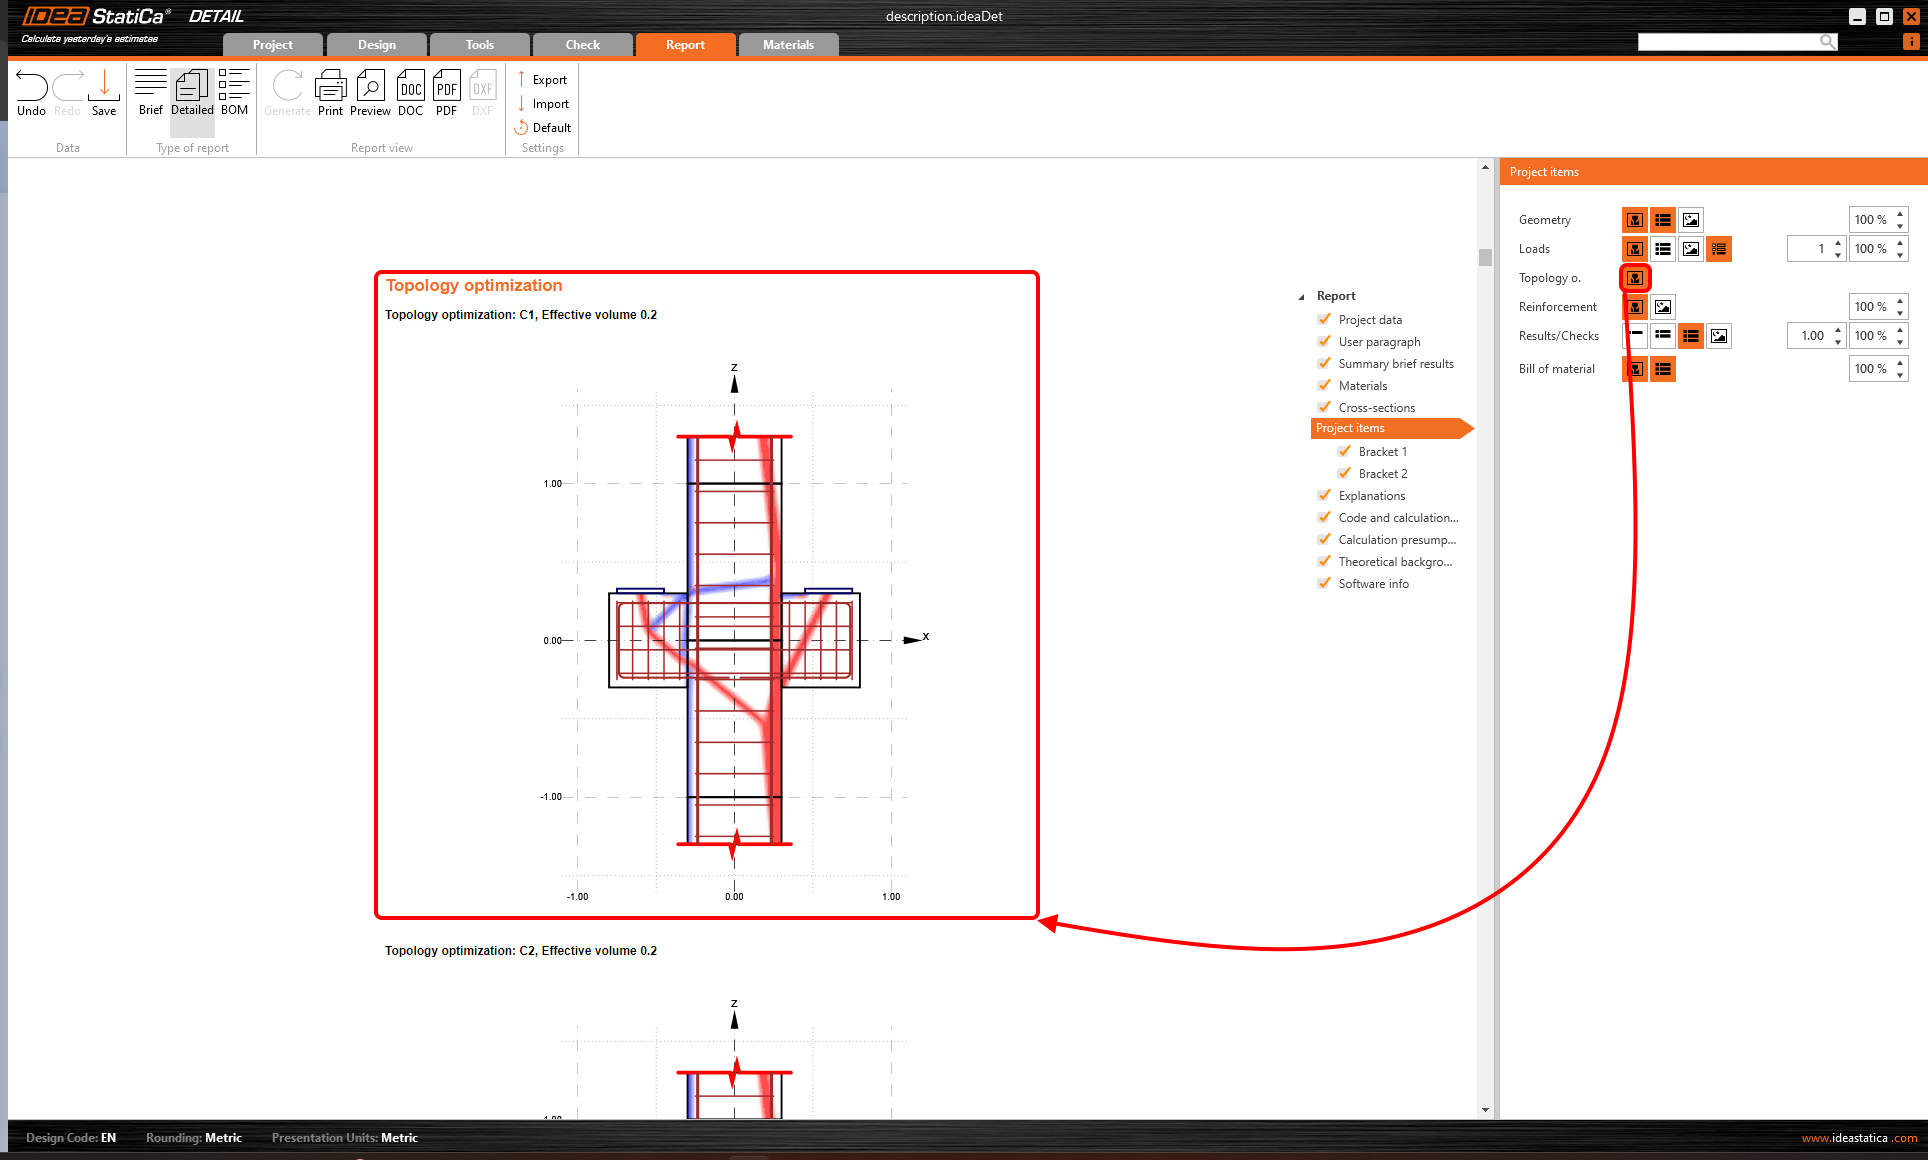
Topology optimization
The button turns on visualization of the Topology optimization for all combinations and specified volume levels.
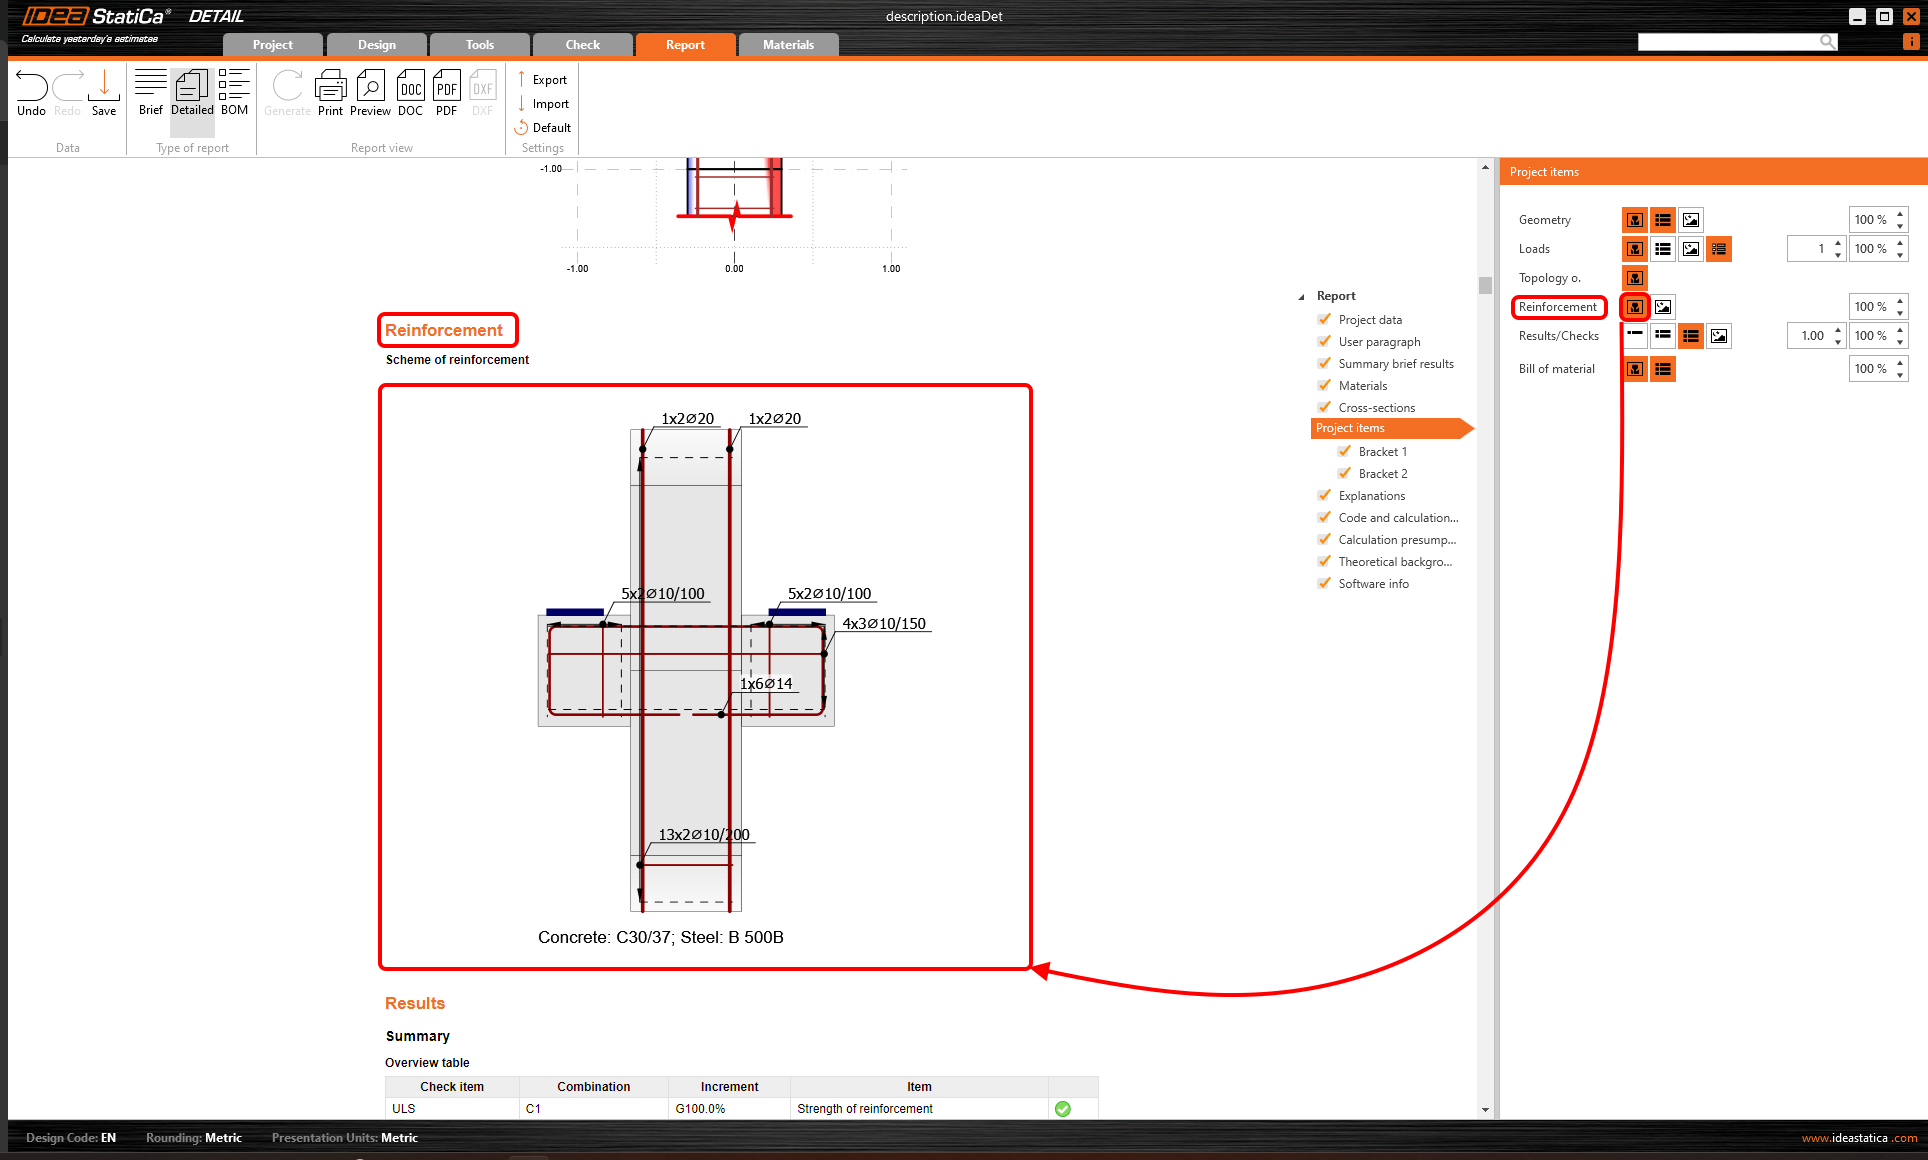
Reinforcement
You can enable a reinforcement scheme or add user images from the gallery.
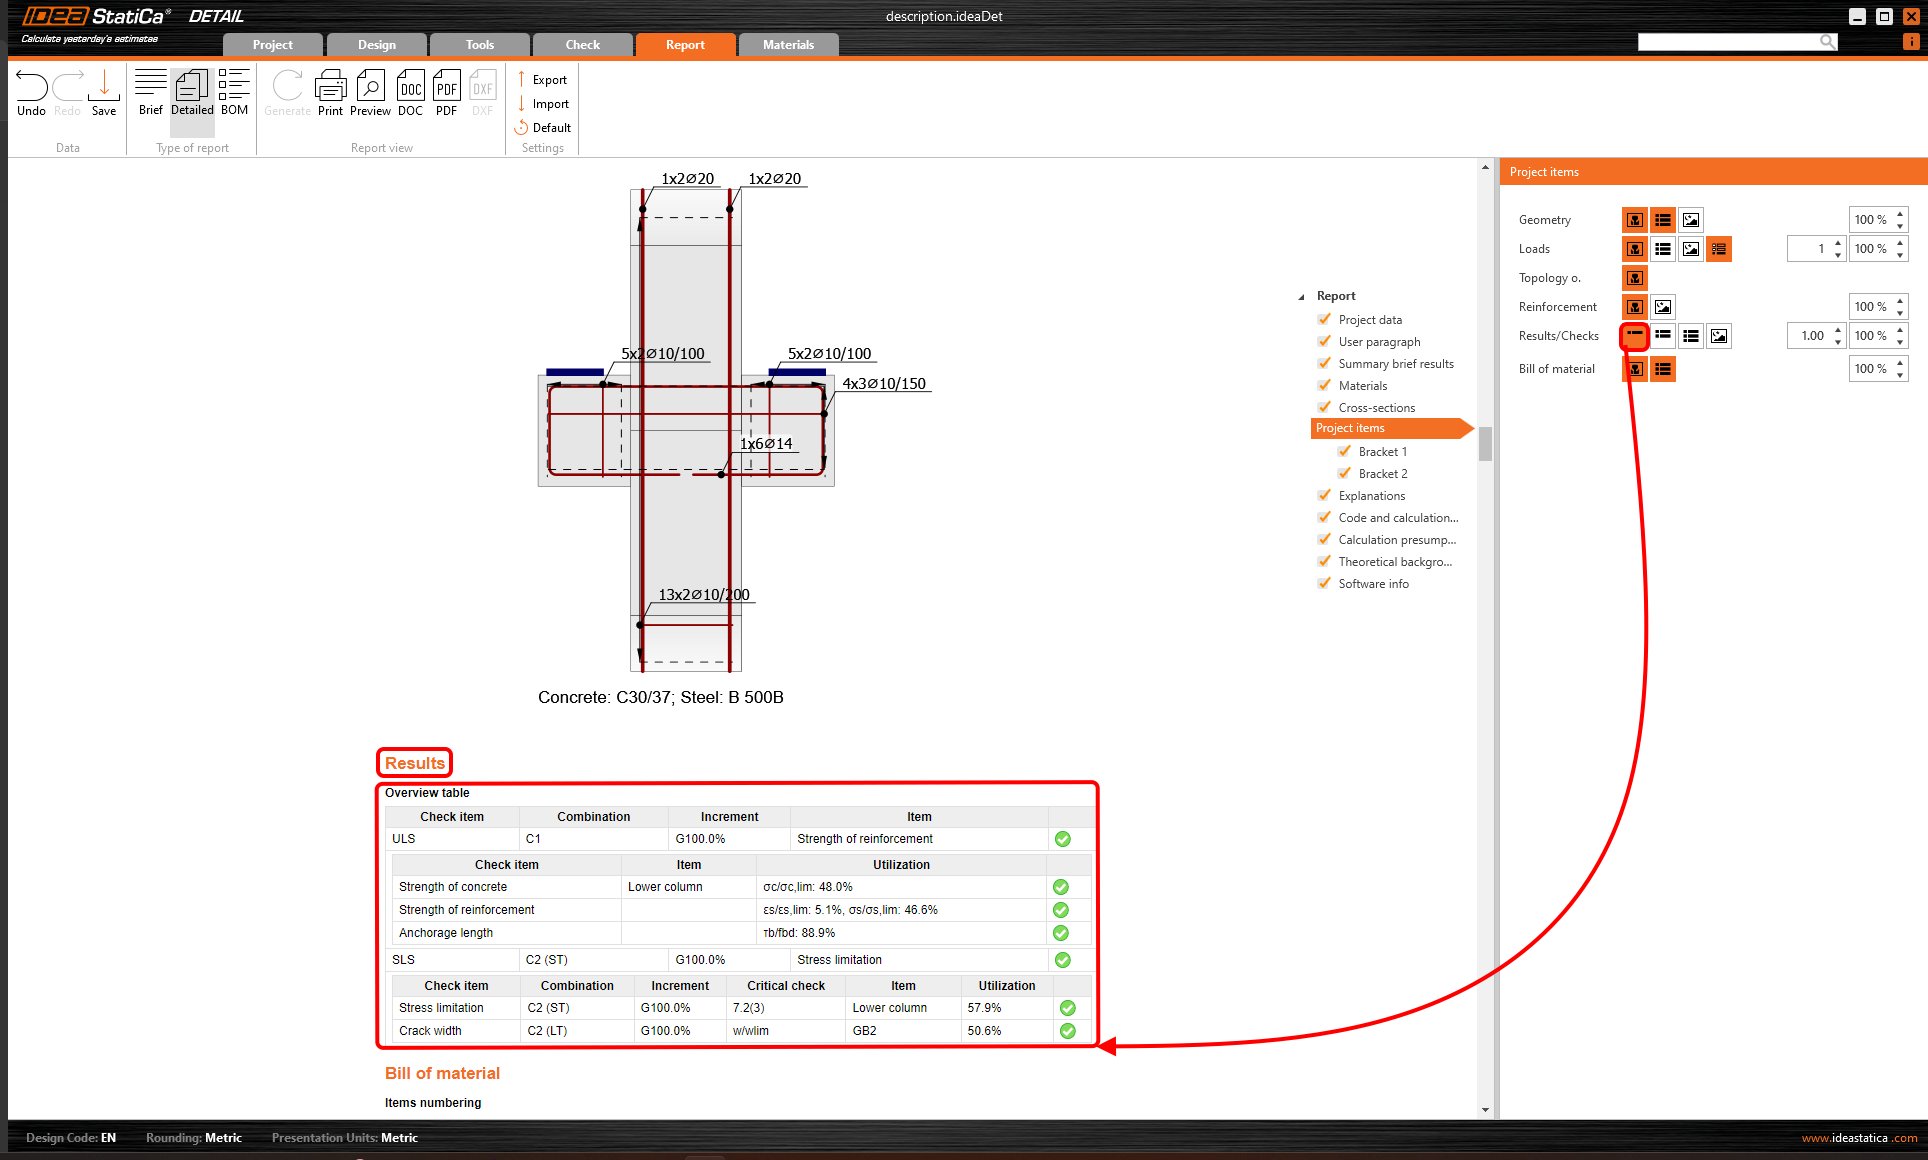
Results/Checks
There are three ways to display results.
- Brief results - only overview table
- Selected results
- Complete results
The first option is shown in the following figure.
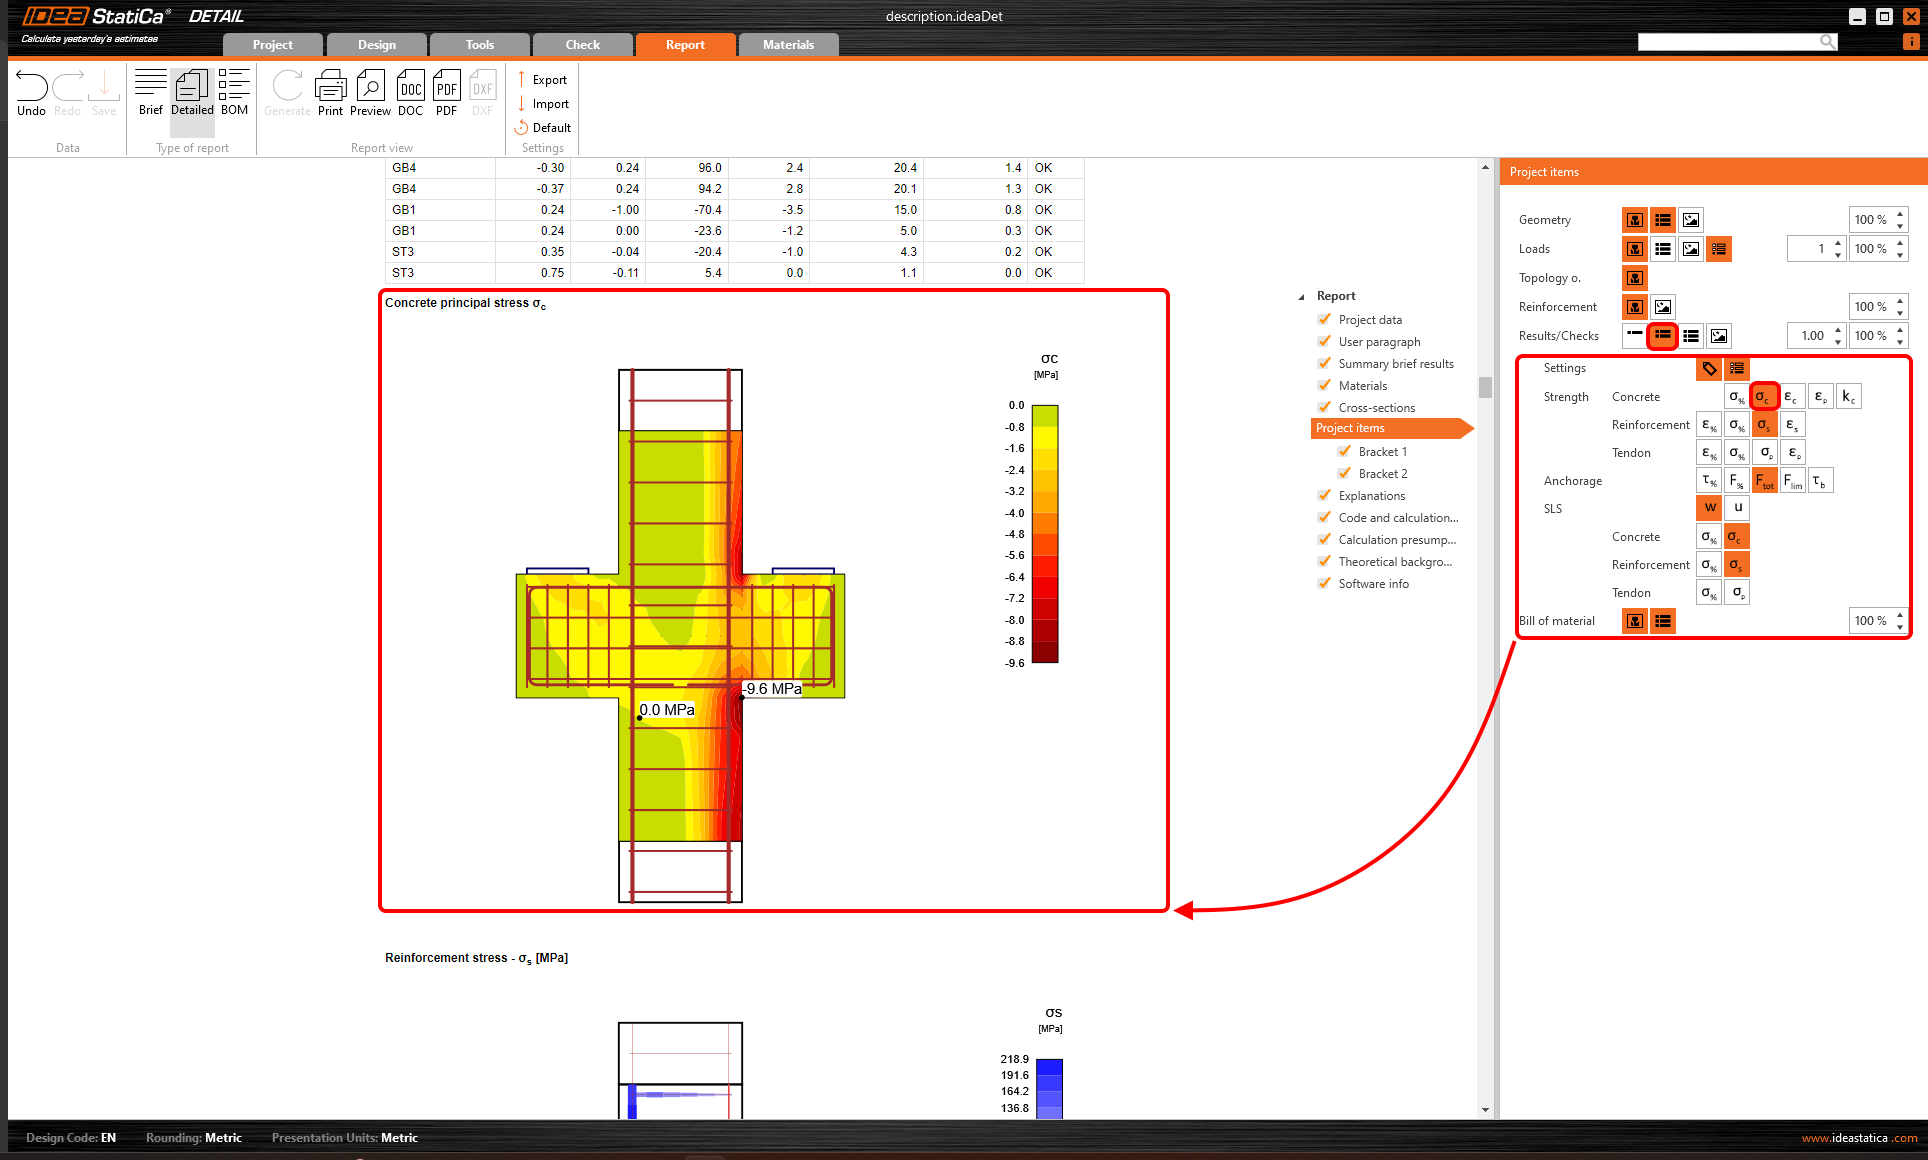
The second option allows you to select exactly what needs to be displayed.
The last option simply adds all results to the report.
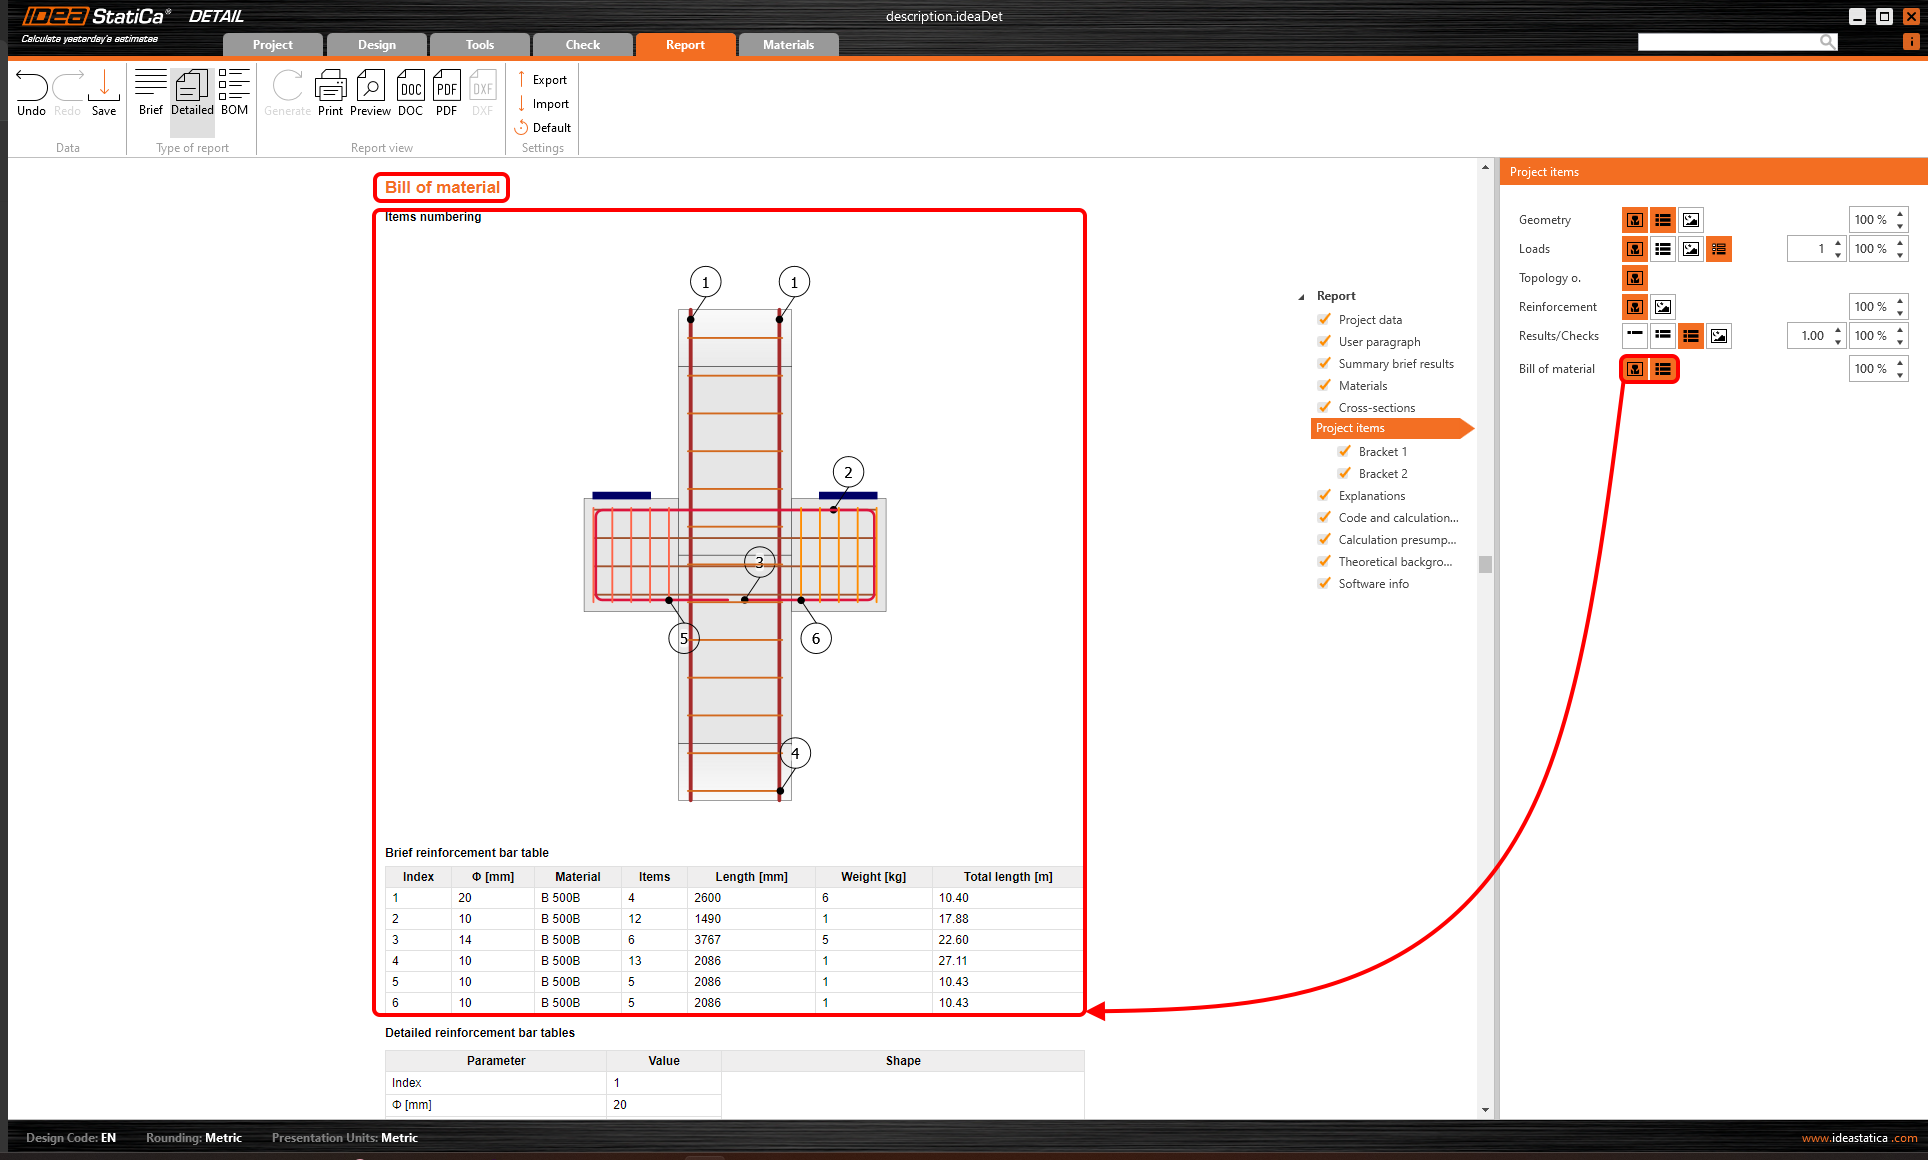
Bill of material
Click on the Bill of material button to check out the weight, number of items, shapes, and lengths of used reinforcement.
Drawings of the reinforcement layout, including shapes of reinforcing bars, can be exported from IDEA StatiCa Detail to the DXF file. The drawing can be further modified.
Conclusion of the report
The final part of the report, which delves into Explanations of used symbols, Code and calculation settings, and Calculation presumptions, is complemented by a crucial section presenting the theoretical background.
This part highlights the main assumptions of the method, contributing to a better understanding of the report outputs for all engineers.

All parts can be turned on or off.
Once everything is set up, you can preview and export the report to an editable format. Or print the report directly from the application.
The report settings can be shared within your company.