How to create a report according to your needs in RCS application
Once the section is designed and code-checked, it is time to create the report. There is no need to do it manually by print-screening images, creating tables, and writing tons of text. Simply use the report feature in the application. You need to set the report - what to display or not. Images, tables, and descriptions are created automatically.
Report options
In IDEA StatiCa RCS, there is an option to have more project sections in one file. And thus also, for the report, it is possible to generate all items in the project or only selected ones.
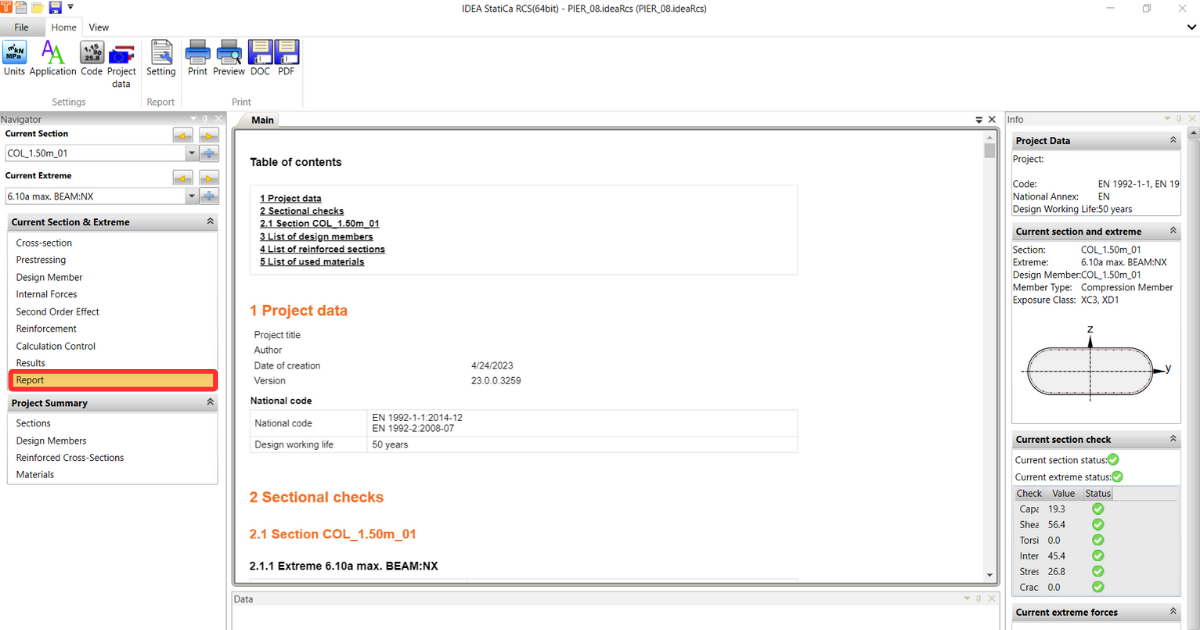
- For a single report, go to Current Section and Extreme -> Report. The report is automatically generated. You can adjust it or easily print it.
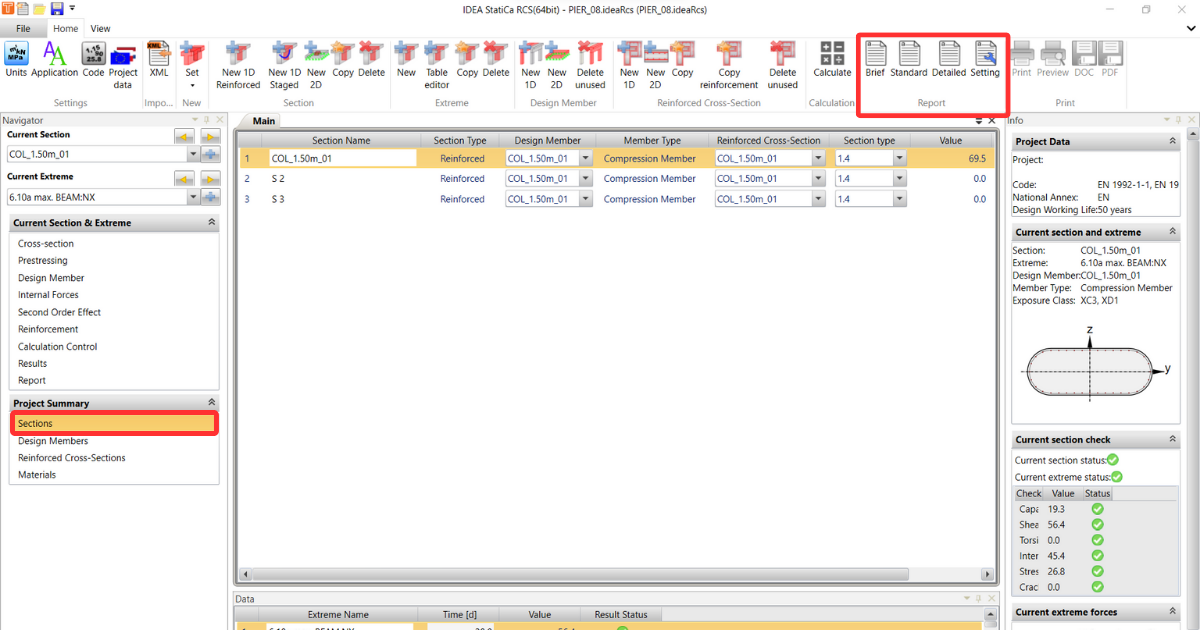
- For a summary report, go to Project Summary -> Sections. Here you can see the summary of the section and the extremes you have calculated, which can be displayed in the report.
There are three fast options for the report:
- Brief - The brief report is a short summary of the results of sectional checks. You can see the result status and ratio value of each section.
- Standard - The standard report additionally contains project data, an overview of the extremes, and overall results of each cross-section for the critical extreme.
- Detailed - The detailed report is a comprehensive file with a full detailed view of the results and checks, explanatory notes, norm-setting, and nonconformity warnings.
In addition to the previous fast options, you can customize the report to your specification through Settings.
Report Settings
The options in the project settings are the same for both reporting methods. After clicking on the Setting button, another pop-up window appears.
In the first half of the tab, you can easily switch on/off the part of the report you want to display or not:
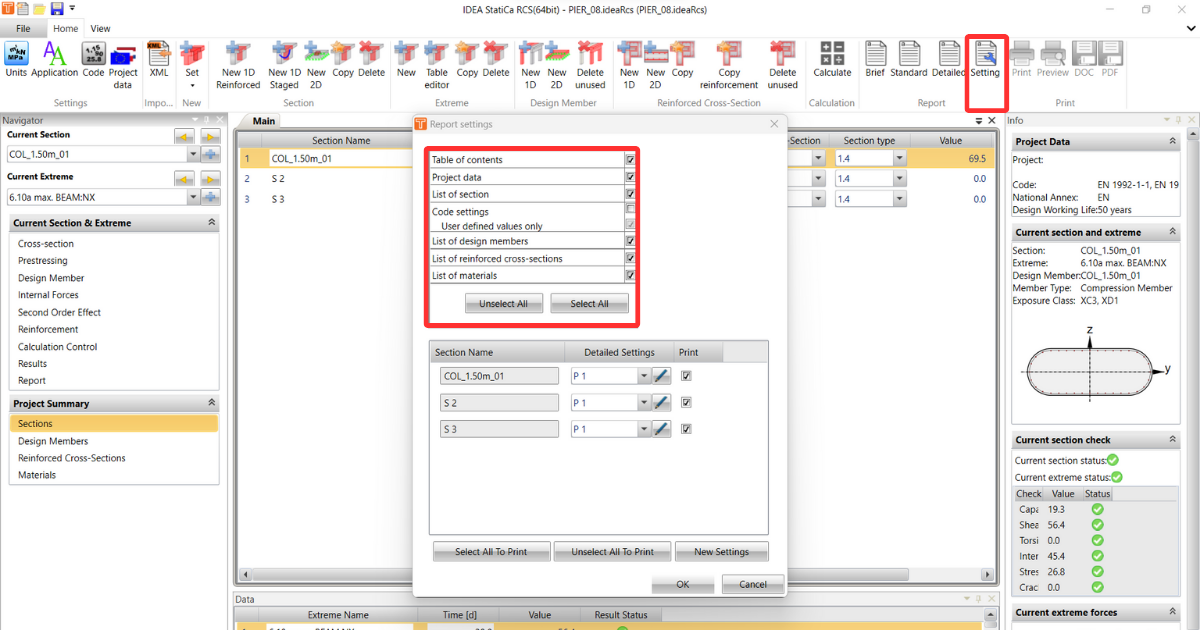
- Project data - shows only the basic data set at the beginning of the project, such as the title, author, national code, etc.
- Brief summary of results of sectional checks (in case of more sections) - summary of all checks in table format
- Sectional checks - detailed results of each the section
- List of design members - setting from the Design Member
- List of reinforced sections
- List of used materials
- Code settings - norm settings and factors, including user-set values
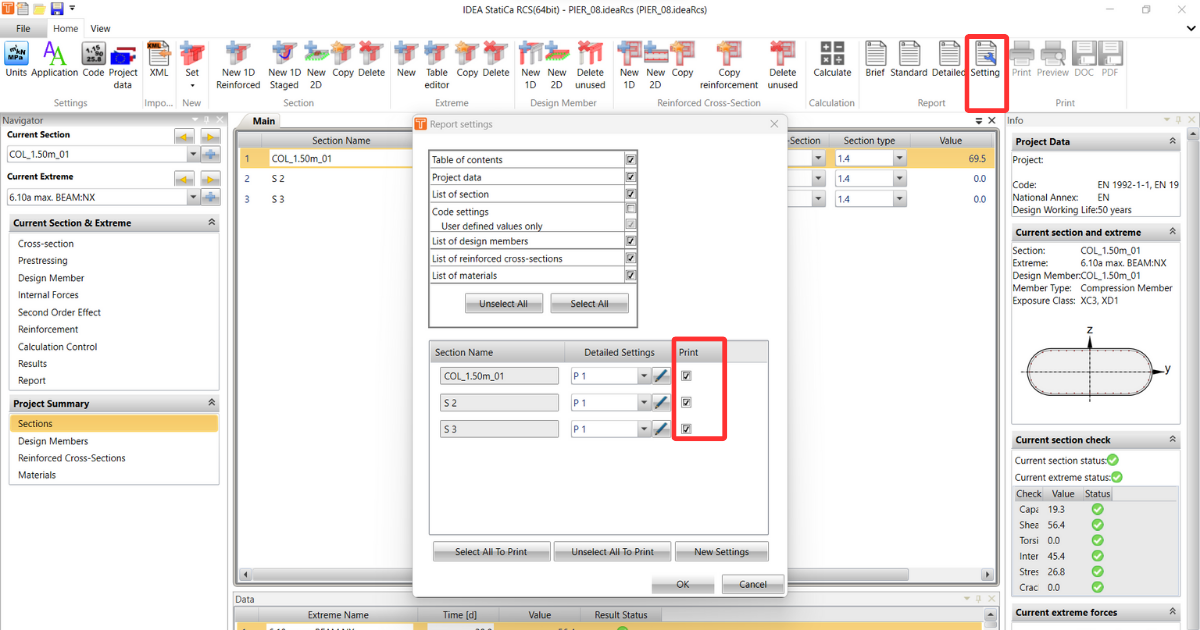
Now take a look at the second part:
In case you have more sections but you don't want to print them all. You can pick only some of them.
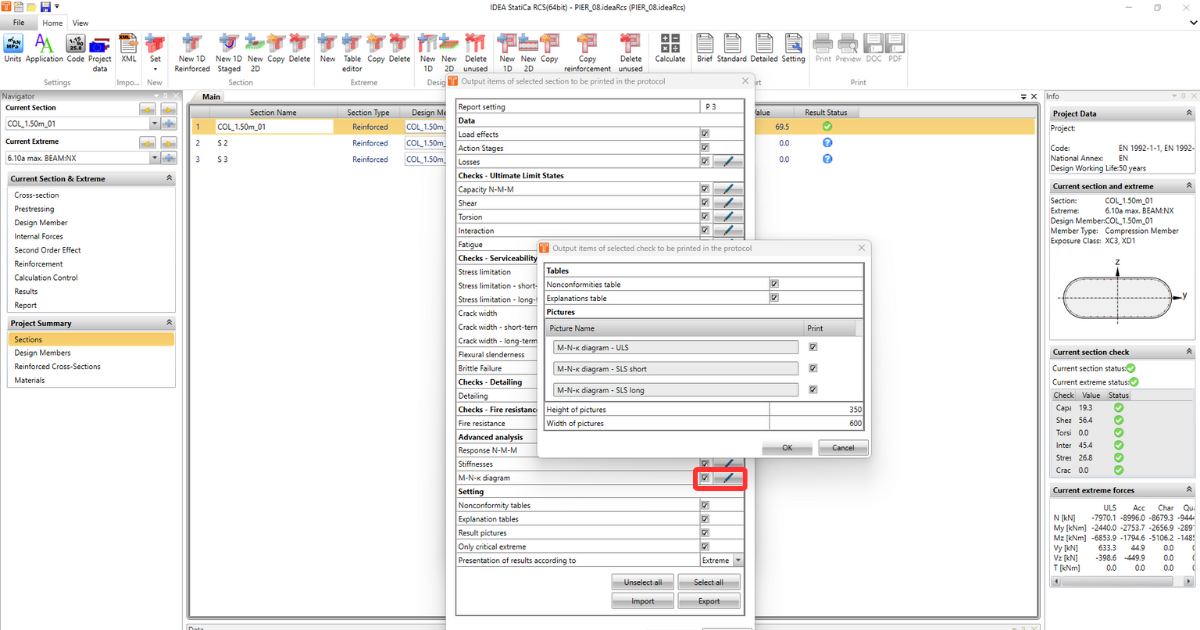
Also, you can create different Detailed Settings for each of the printing sections.
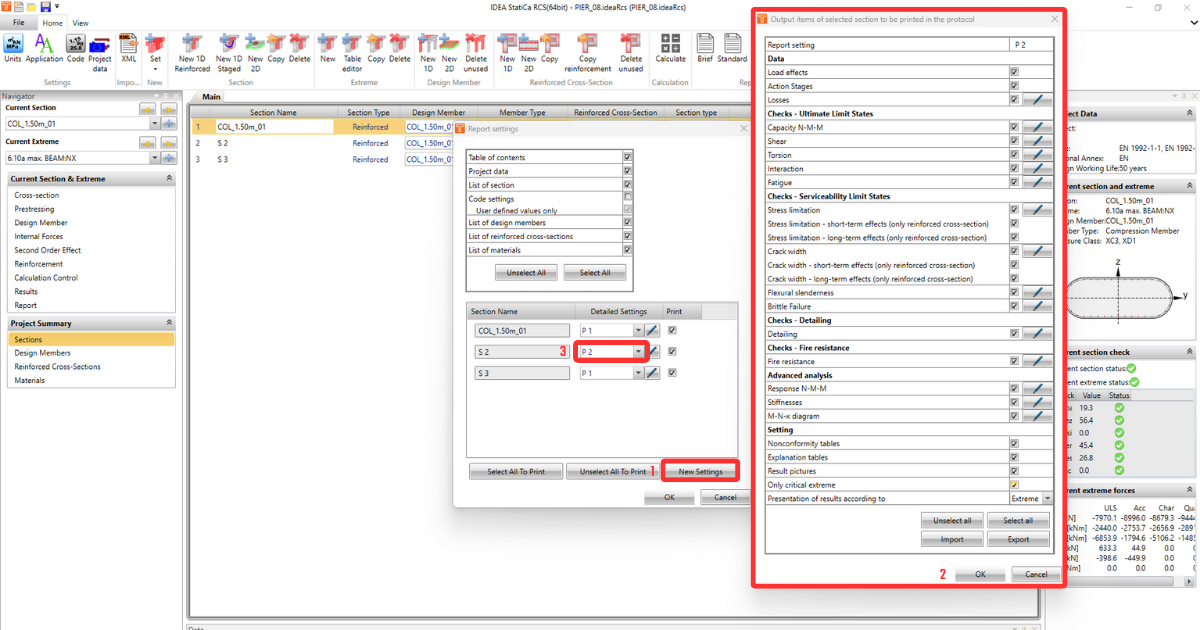
In Detailed Settings, you can switch on/off some specific data and possibly adjust the image display and other details according to your needs.
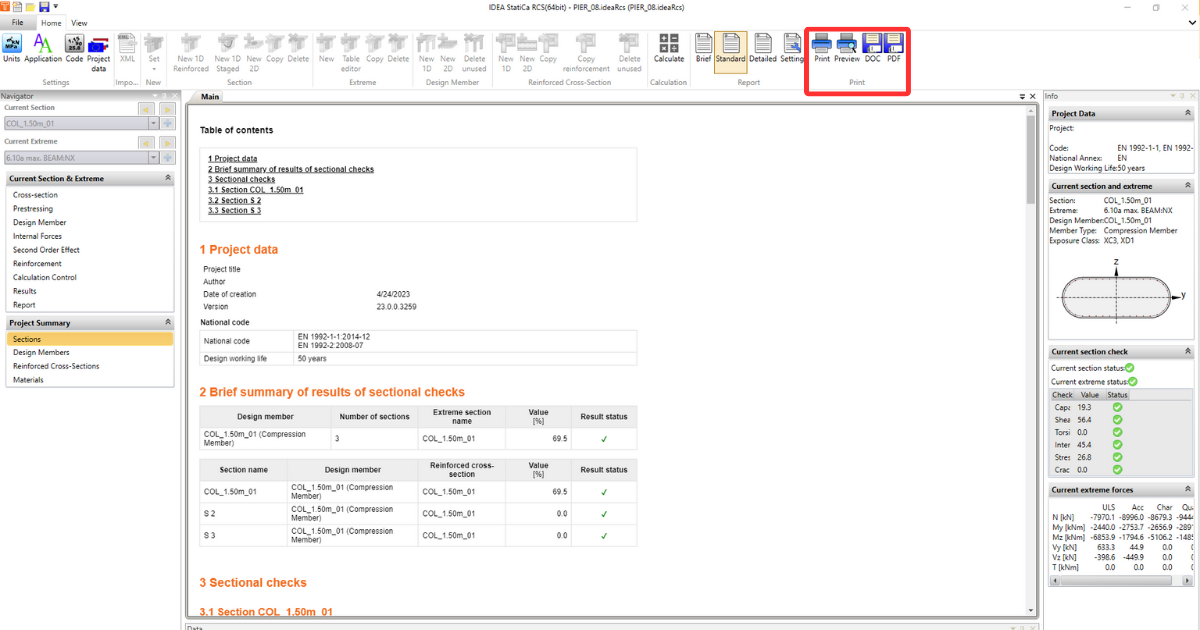
Print options
When the report is done, it is possible to print the report straight from the application. Another option is to save it into a pdf file or a doc file.