Description
The object of this study is verification of component-based finite element method (CBFEM) for a class 4 triangular haunch without a flange and a class 4 triangular haunch with a flange with reduced stiffness with research FEM model (RFEM) and design FEM model (DFEM).
Experimental investigation
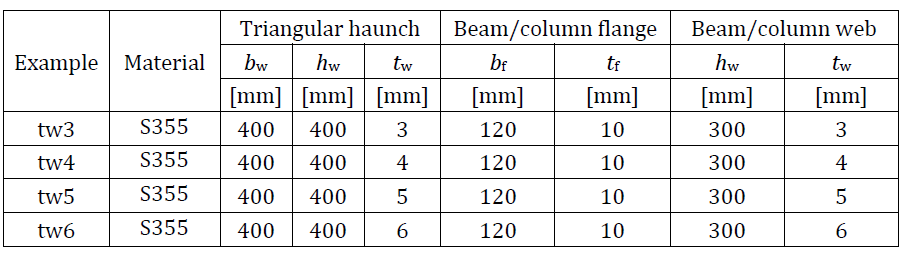
Experimental results of six specimens of haunches with and without flanges are presented. Three specimens are without flanges and three specimens are supported by additional flanges. Unstiffened specimens differ in the web thickness tw and the web width bw. Reinforced specimens differ in the web thickness tw, the flange thickness tf, and the flange width bf. The dimensions of specimens are summarized in Tab. 6.1.1. The test set-up for the specimen without a flange is shown in Fig. 6.1.1 (top) and for the specimen with a flange in Fig. 6.1.1 (bottom). Material characteristics of the steel plates are summed up in Tab. 6.1.2.
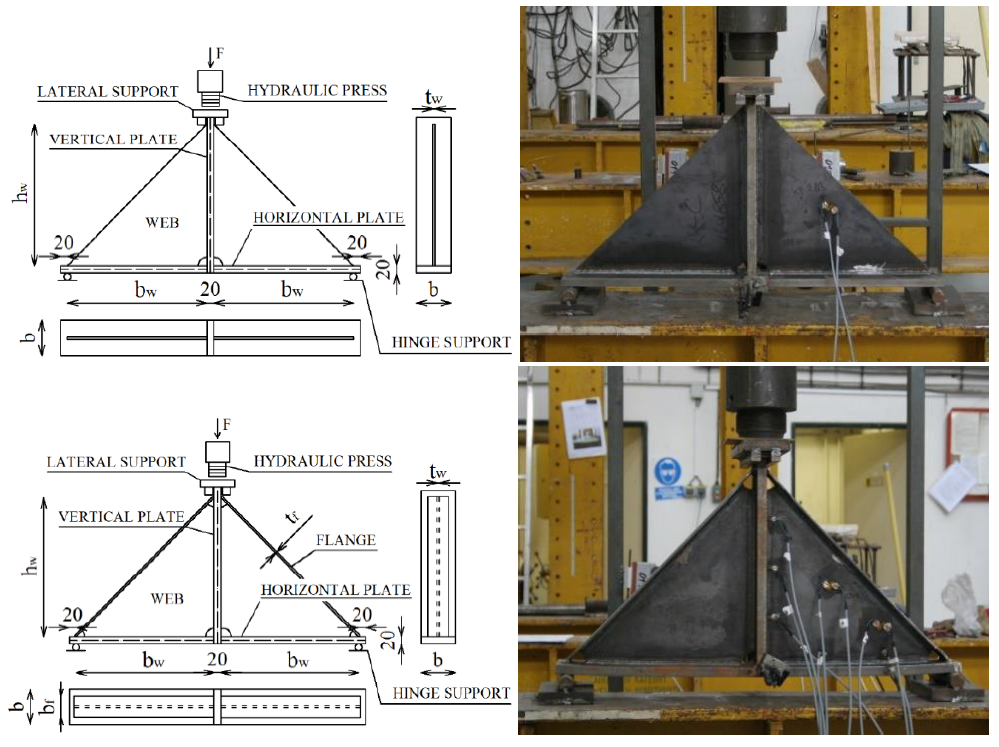
\[ \textsf{\textit{\footnotesize{Fig. 6.1.1 Specimens geometry and test set-up}}}\]
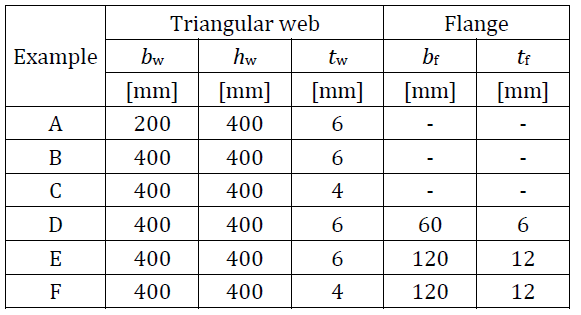
Tab. 6.1.1 Examples overview
Tab. 6.1.2 Material characteristics used in numerical models

Research FEM model
Research FEM model (RFEM) is used to verify the DFEM model and is validated on the experiments. In the numerical model, 4-node quadrilateral shell elements with nodes at their corners are applied, with a maximum side length of 10 mm. Materially and geometrically nonlinear analysis with imperfections (GMNIA) is applied. Equivalent geometric imperfections are derived from the first buckling mode, and the amplitude is set according to Annex C of EN 1993-1-5:2006. Numerical models are shown in Fig. 6.1.2.
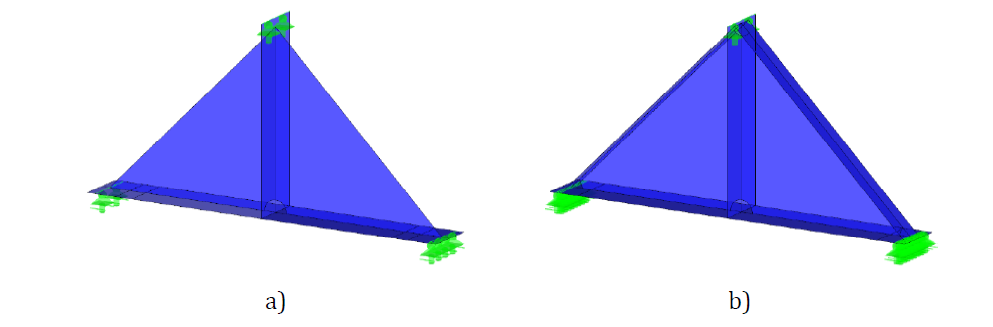
\[ \textsf{\textit{\footnotesize{Fig. 6.1.2 Research FEM model a) haunch without a flange b) haunch with a flange}}\]
An example of the comparison of RFEM and experimental test on the load-deflection behavior is shown in Fig. 6.1.3a. The comparison of resistances measured in the experiment and obtained from RFEM is shown in Fig. 6.1.3b. The resistance calculated in the numerical model is displayed on the horizontal axis. The resistance measured in the experimental study is displayed on the vertical axis. It can be seen that a good agreement exists.
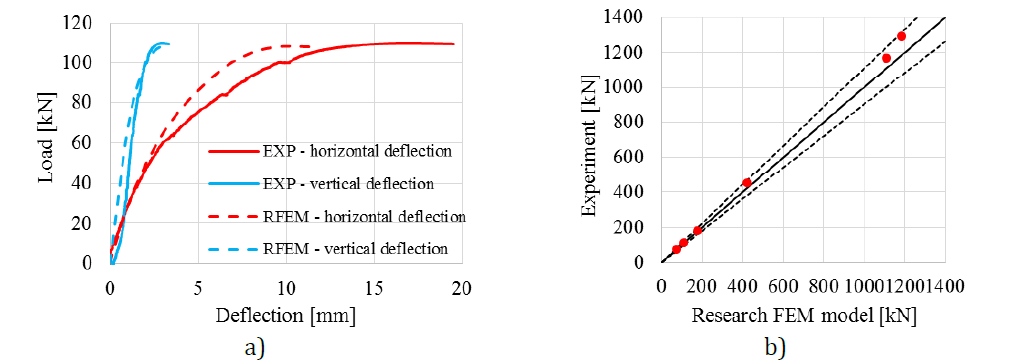
\[ \textsf{\textit{\footnotesize{Fig. 6.1.3 a) Load-deflection curve of a haunch without a flange b) Experiments’ resistances compared against RFEMs’}}}\]
The comparisons of the final deformation states between numerical simulations and experimental results are performed at the end of the tests. Fig. 6.1.4 presents the comparison of the deformation of specimens A, B, and D after failure with RFEA. It can be found that good agreements between numerical models and experimental results of the haunches exist in the failure mode. For more details, see (Kurejková and Wald, 2017).
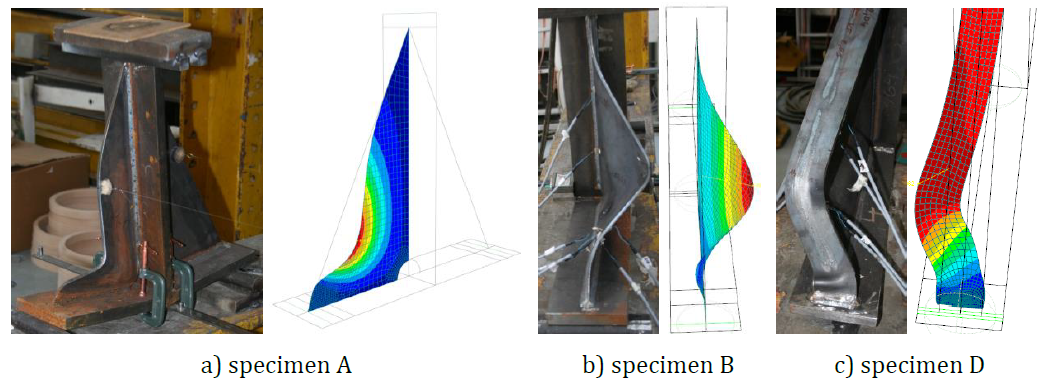
\[ \textsf{\textit{\footnotesize{Fig. 6.1.4 Experimental and numerical deflection of specimens A, B and D after failure}}}\]
Design FEM model
Design procedure for class 4 cross-sections is described in section 3.10 Local buckling.
The design procedure is verified on the comparison of DFEM and RFEM models. Both models are created in Dlubal RFEM software. The procedure is applied in CBFEM models; see (Kurejková et al. 2015). The resistance governed by 5% plastic strain is obtained in the first step and followed by linear buckling analysis. The critical component in the buckling analysis is studied. The design resistance is interpolated until the condition ρ∙αult,k = 1 is reached.
The first buckling mode of a haunch without a flange is shown in Fig. 6.1.5 a). The resistance is assessed according to formula (3.10.2) in section 3.10. The comparison of DFEM’s and RFEM’s resistances is shown in Fig. 6.1.5 b). The resistance calculated in the DFEM is displayed on the horizontal axis. The resistance calculated in RFEM is displayed on the vertical axis. It can be seen that a good agreement exists and the procedure is verified.
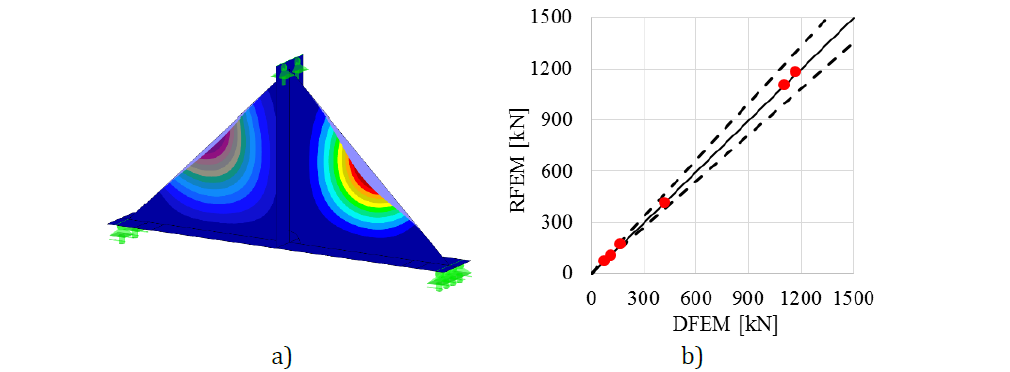
\[\textsf{\textit{\footnotesize{Fig. 6.1.5 a) First buckling mode of DFEM model b) Comparison of DFEM and RFEM resistances}}}\]
Global behavior and verification
Comparison of the global behavior of a haunch without flange described by load-deflection diagrams in DFEM model is prepared. The deflection is measured in the vertical direction in the middle of the specimen. Attention is focused on the main characteristics: design resistance and critical load. Two examples of a haunch without a flange are chosen to present as a reference; see Fig. 6.1.6. The design procedure in DFEM models covers the post-buckling reserve, which is observed in Fig. 6.1.6 a). The critical load Fcr is smaller than the design resistance FDFEM. The post-buckling reserve is observed in cases with very slender plates. The typical diagram is shown in Fig. 6.1.6 b), where the design resistance FDFEM does not reach the critical load Fcr. The load Fult,k refers to resistance by 5 % of plastic strain.
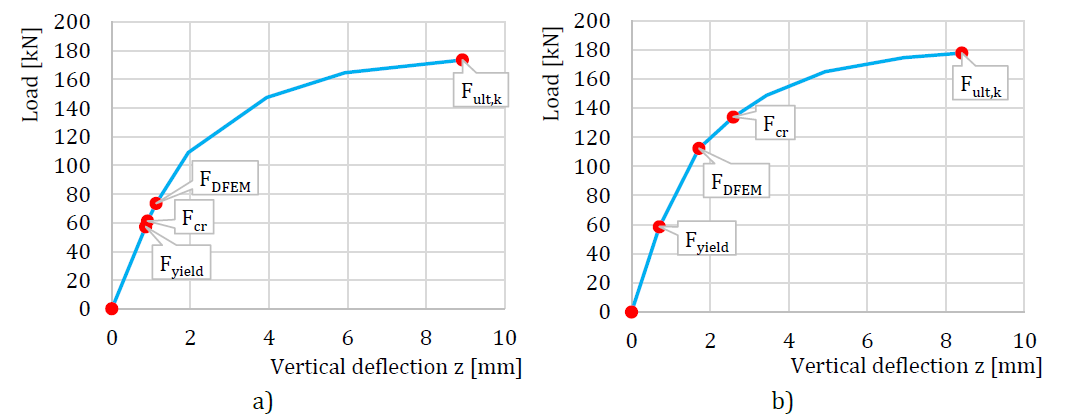
\[ \textsf{\textit{\footnotesize{Fig. 6.1.6 a) Load-deflection curve with post-buckling reserve b) Load-deflection curve without post-buckling reserve (Kuříková et al. 2019)}}}\]
The design procedure in CBFEM models is described in section 3.10 Local buckling. The buckling analysis is implemented in the software. The calculation of the design resistances is done manually according to the design procedure. FCBFEM is interpolated by the user until the formula (2) is equal to 1. A beam-column joint with a haunch without a flange is studied. The thicknesses of beam and column webs are changing in the same way as the thickness of the triangular haunch. The same cross-section is used for beam and column. The geometry of the examples is described in Tab. 6.1.3. The joint is loaded by bending moment.
Tab. 6.1.3 Examples overview (Kuříková et al. 2019)
Verification of resistance
The design resistance calculated by CBFEM is compared with the results obtained by RFEM. The comparison is focused on the design resistance and critical load. The results are ordered in Tab. 6.1.4. The diagram in Fig. 6.1.7 c) shows the influence of the widener thickness on the resistances and critical loads in the examined examples.
The results show very good agreement in critical load and design resistance. The post-buckling reserve is observed for beam web and triangular widener with thicknesses of 3 and 4 mm. The CBFEM model of the joint with a haunch with a thickness of 3 mm is shown in Fig. 6.1.7 a). The first buckling mode of the joint is shown in Fig. 6.1.7 b).
Tab. 6.1.4 Design resistance

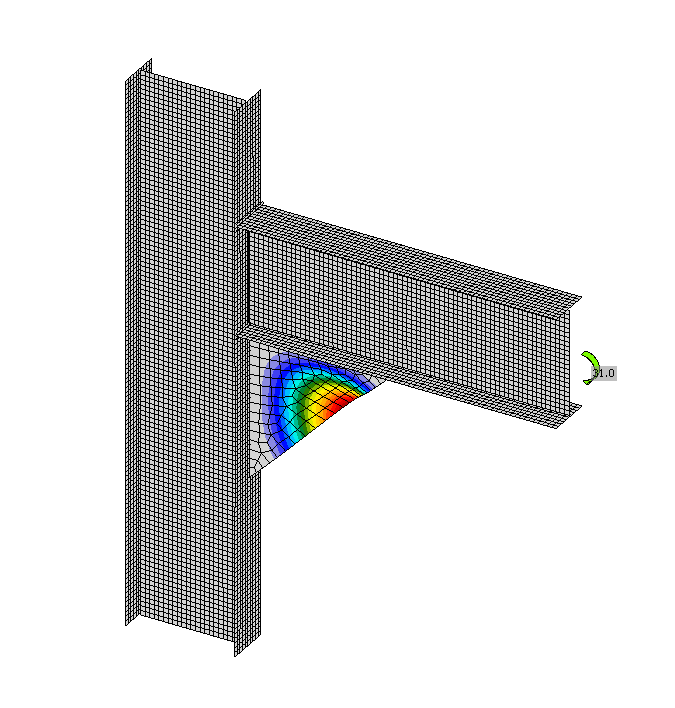
\[ \textsf{\textit{\footnotesize{a)}}}\]

\[ \textsf{\textit{\footnotesize{b)}}}\]
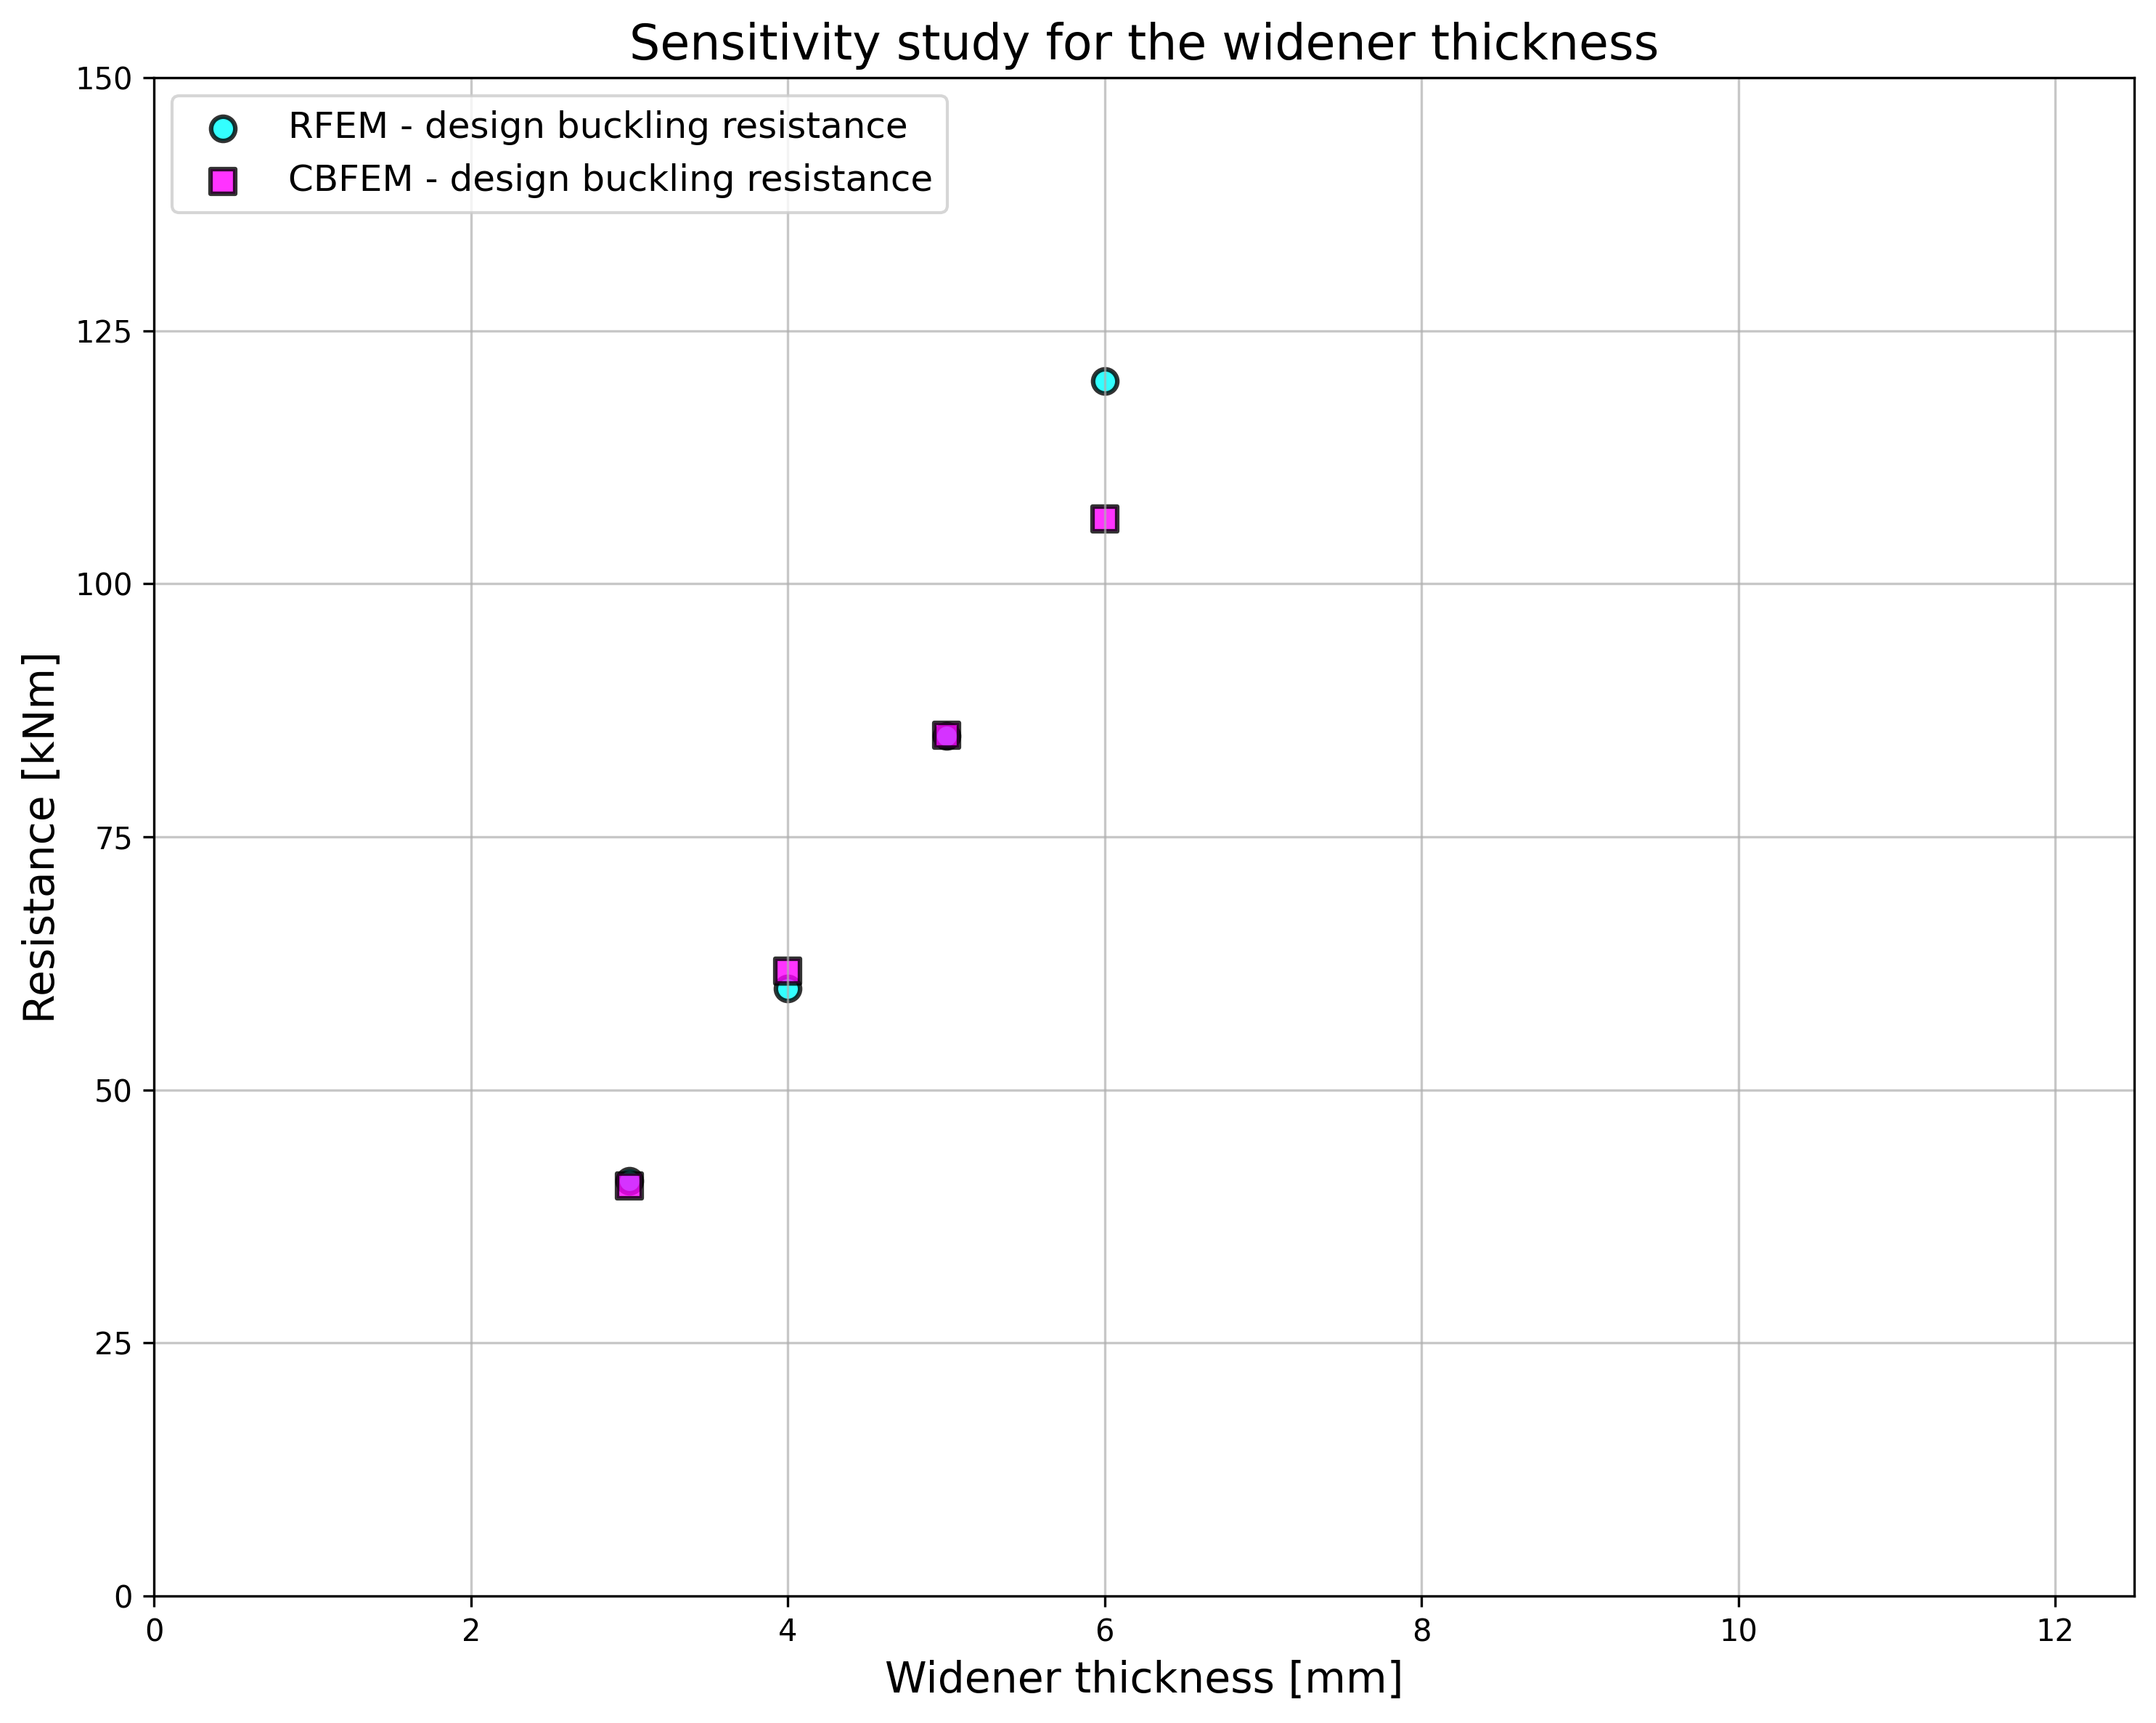
\[ \textsf{\textit{\footnotesize{c)}}}\]
\[ \textsf{\textit{\footnotesize{Fig. 6.1.7 a)First buckling mode b) CBFEM model c) Influence of hthe widener thickness on resistances and critical loads}}}\]
Verification studies confirm the accuracy of the CBFEM model for the prediction of a triangular haunch behavior. The results of CBFEM are compared with the results of the RFEM. The design procedure is verified on the RFEM model, which is validated on experiments. All procedures predict similar global behavior of the joint.
Benchmark example
Inputs
Beam and column
• Steel S355
• Flange thickness tf = 10 mm
• Flange width bf = 120 mm
• Web thickness tw = 3 mm
• Web height hw = 300 mm
Triangular haunch
• Thickness tw = 3 mm
• Width bw = 400 mm
• Height hw = 400 mm
Calculate
• Buckling analysis
Outputs
• Plastic resistance CBFEM = 138 kNm
• Design buckling resistance CBFEM = 41 kNm
• Critical buckling factor (for Design buckling resistance CBFEM = 41 kNm) αcr = 0,52
• Load factor by 5 % plastic strain αult,k = Plastic resistance CBFEM / Design buckling resistance CBFEM = 138 / 41 = 3,40
\[ \textsf{\textit{\footnotesize{Fig. 6.1.7 Triangular haunch calculated in the benchmark example}}}\]