Concrete pier caps
Introduction
This article addresses the analysis of discontinuity regions. The modeling of pier caps, which contain both static and geometric discontinuities, will be studied with the aid of an experimental study performed by Geevar and Menon (2018). Their study consisted of experiments on pier caps with four concentrated loads. The specimens were reinforced following standard rules used in design practice. Eight specimens were tested to investigate the influence of various parameters, such as the size of the bearing plates, the reinforcement layout, the geometry and the eccentricity of the applied loads. Given that the eccentricity of loading did not have a significant influence on the behavior of the specimens in the experiments, only the specimens with constant geometry and no load eccentricity (S1, S2, S3, S4 and S5) were analyzed with the CSFM.
Definition of failure modes
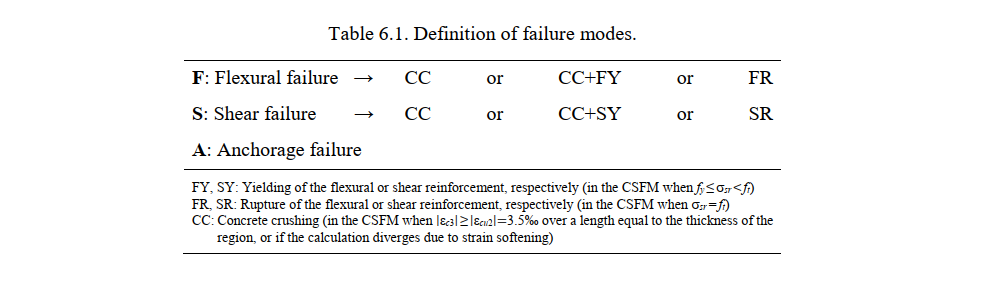
In order to compare the observed failure modes in the experiments with those predicted by the CSFM, the failure modes are classified as follows: flexural (F), shear (S) and anchorage (A). It should be noted that none of the experiments covered in this chapter exhibited an anchorage failure. Table 6.1 defines different failure subtypes depending on whether flexural and shear fail-ures are triggered by failure of the concrete or of the reinforcement. While yielding of the reinforcement does not represent a material failure, this is included as a failure subtype in combination with concrete crushing due to the importance of distinguishing concrete crushing failures without reinforcement yielding (very brittle) from those happening after the yielding of the reinforcement (which can exhibit a certain deformation capacity).
Experimental setup
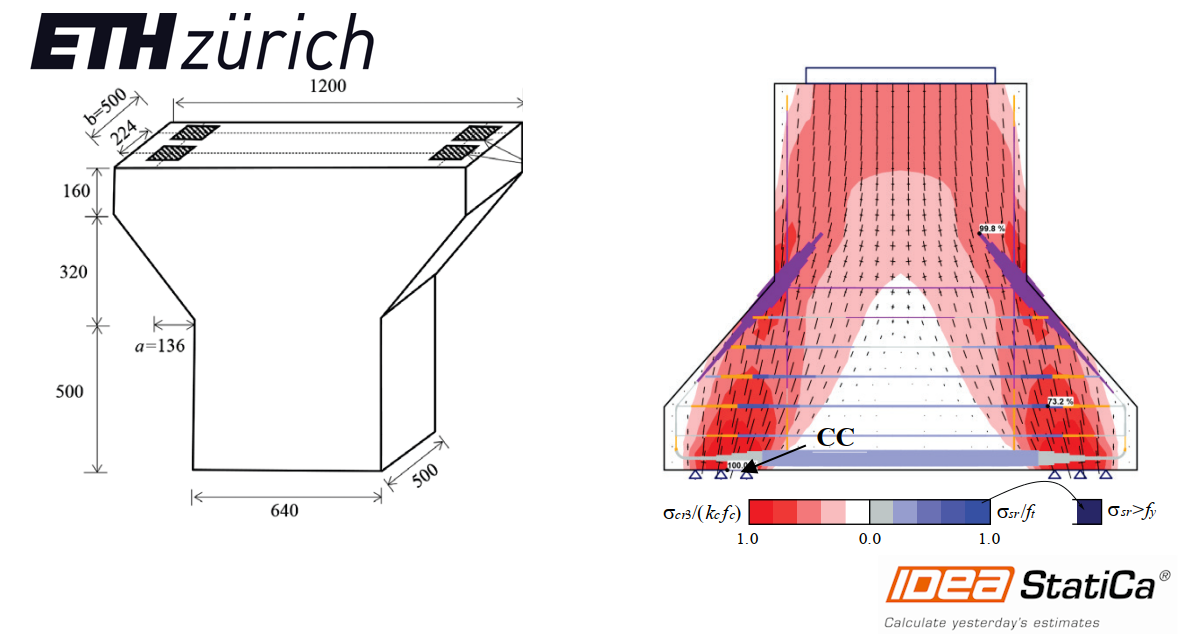
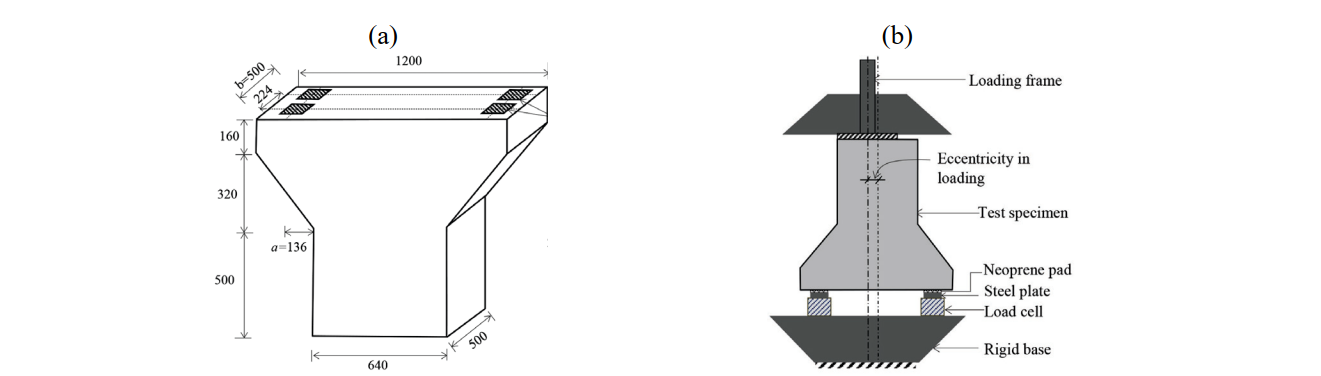
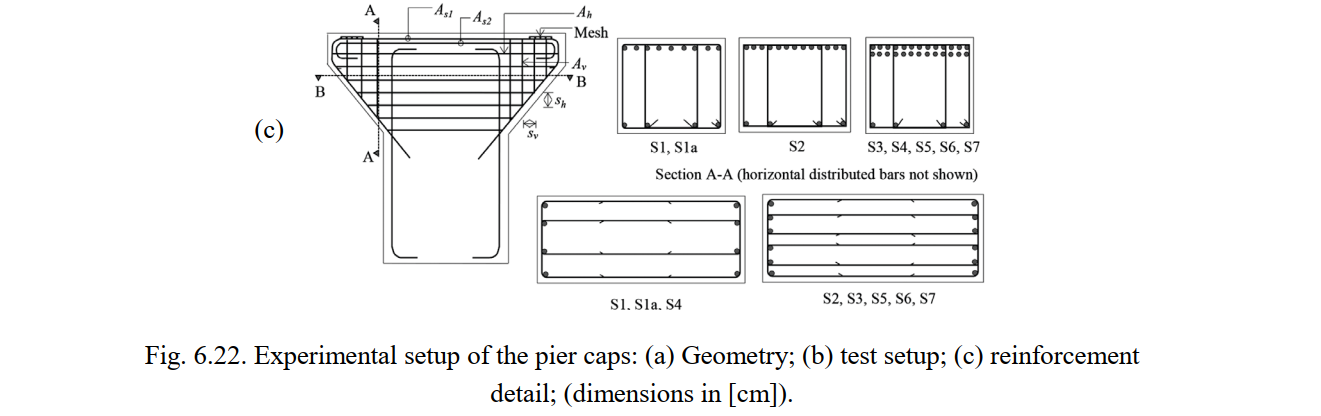
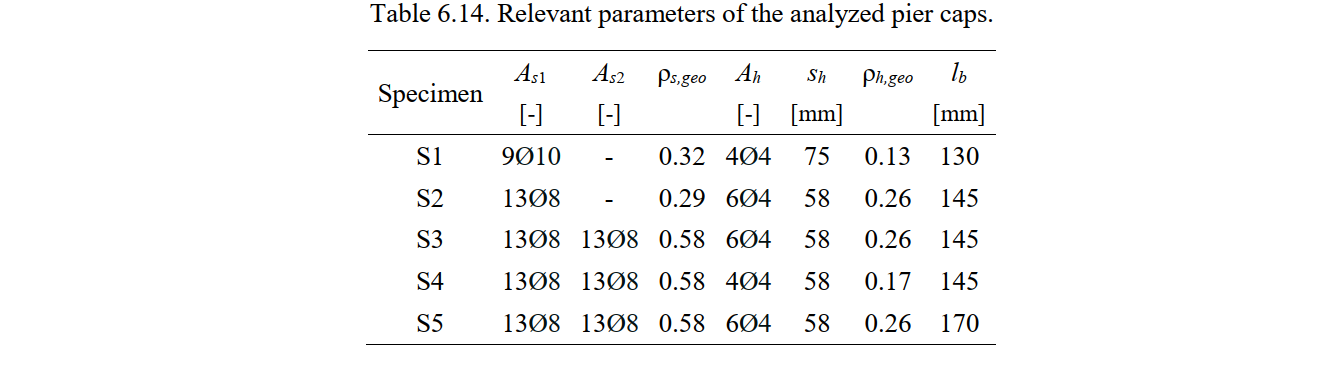
Fig. 6.22a shows the geometry of the specimens. The dimensions and reinforcement were de-signed at a scale of around 1:3.5 compared to typical pier caps used in bridge construction. To ensure stability while testing, the test setup was inverted with respect to the normal configuration of a pile cap. The specimens stood on four vertical supports (consisting of load cells, steel plates and thin neoprene pads) and were subjected to a vertical force at the top (see Fig. 6.22b). The vertical load was applied with zero eccentricity to Specimens S1, S2, S3, S4 and S5. The size of the loading plate (lb) varied in the tests, as indicated in Table 6.14. The reinforcement layout of the specimens is shown in Fig. 6.22c and the number and amount of reinforcing bars is detailed in Table 6.14. The layout was composed of primary reinforcement (As1), which was supplemented by additional reinforcement (As2) in Tests S3, S4 and S5. This reinforcement was fully anchored outside the zone of applied loads. The reinforcement also comprised distributed horizontal reinforcement (Ah with spacing sh) and distributed vertical reinforcement (Av). The distributed vertical reinforcement was observed to work mainly in compression and to not be effective. Therefore, this reinforcement was not modeled in the CSFM, as will be discussed in the following chapters.
Material properties
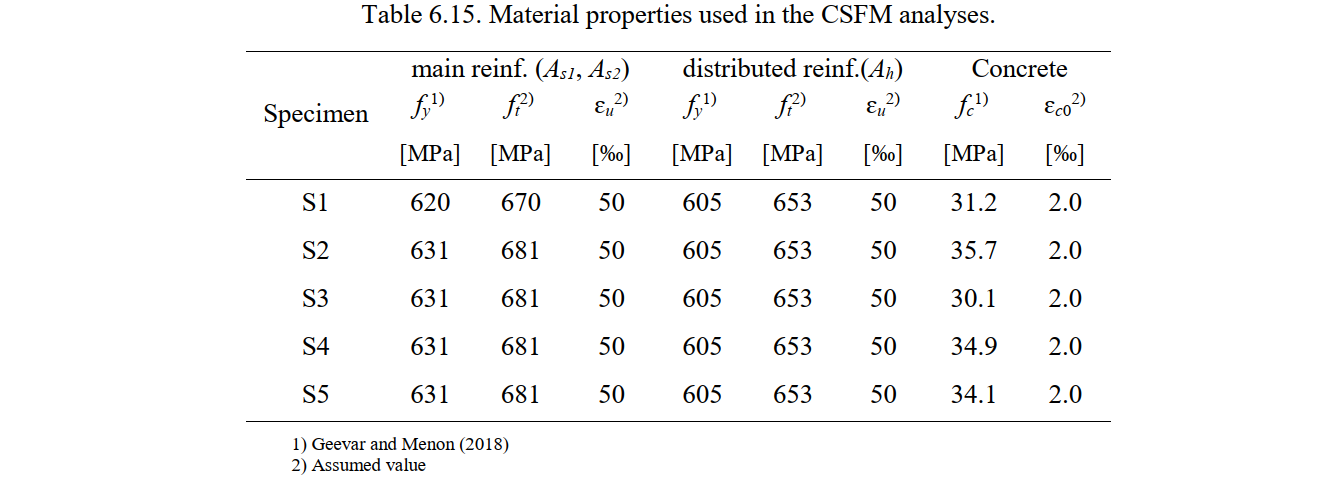
The material properties used in the numerical CSFM analyses are listed in Table 6.15. The strength ft and the ultimate strain εu of the reinforcement as well as the concrete strain ɛc0 were not given in the test report; plausible values were thus assumed for these parameters.
Modeling with the CSFM
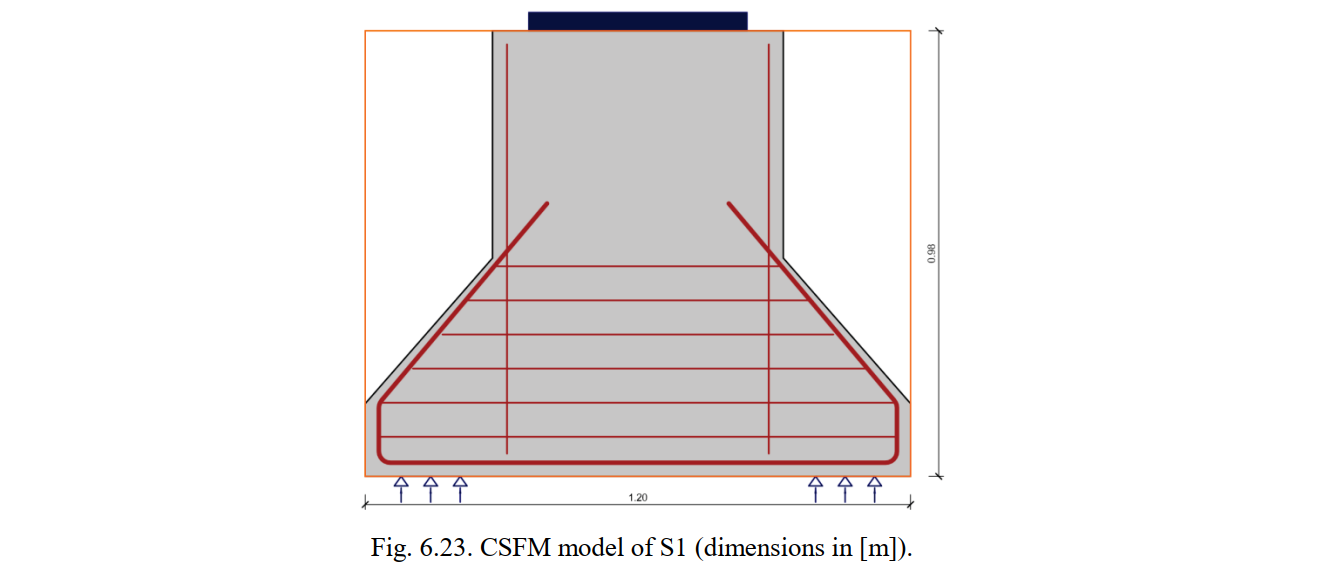
The geometry, reinforcement, supports and loading conditions were modeled in the CSFM according to the experimental setup. Fig. 6.18 shows the modeling of the S1 pier cap. It is assumed that the very thin (10 mm) neoprene plates do not allow significant horizontal deformation and therefore a fixed support is used in the horizontal and vertical directions. The load bearing plates are not arranged over the entire thickness of the pier caps (see Fig. 6.22a). Hence, the thickness in the CSFM analyses was set to be equal to the sum of the thickness of the load bearing plates (i.e., twice lb). By considering this, any positive triaxial confining effect due to the simultaneous spreading of the load in-plane and out-of-plane is implicitly neglected. As already indicated, the distributed vertical reinforcement (Av) was not modeled since it works mainly in compression and does not have a significant influence on specimen behavior. The Tension Chord Model was used in all cases to capture the tension stiffening effects (no reinforcement modeled as stirrups).
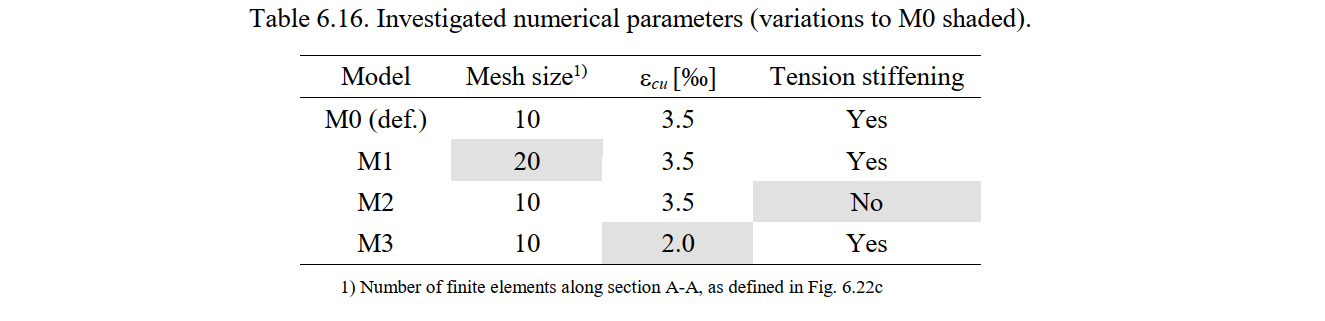
For each test, four numerical calculations were carried out using the following parameters:
- The mesh size, which was 10 (the default value for this particular example) and 20 finite elements along section A-A, as defined in Fig. 6.22c.
- The consideration or not of the tension stiffening effect. By default, tension stiffening (TS) is considered in the CSFM (the Tension Chord Model is used for all bars in this particular case).
- The strain limit for concrete crushing (εcu2), which was set to 2‰ and 3.5‰ (the default value used in other analyses in this chapter).
The parameters used in each numerical calculation are summarized in Table 6.16. Model M0 corresponds to the default settings in the CSFM.
Comparison with experimental results
This article provides comparisons between the ultimate loads and failure modes provided by the CSFM and the studied experimental results.
Failure modes and ultimate loads
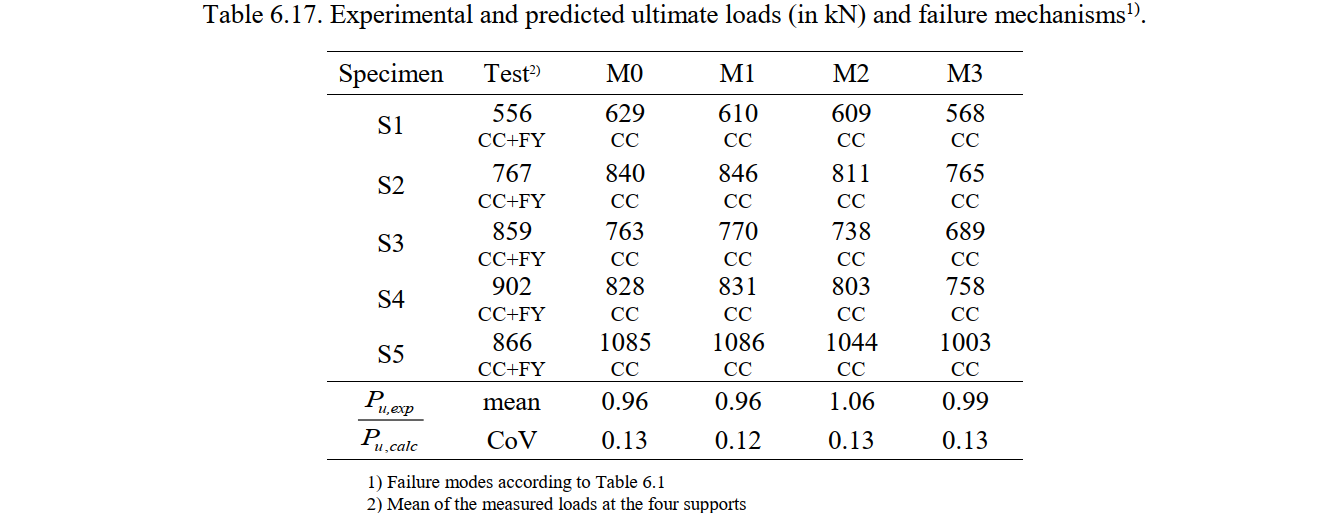
Table 6.17 summarizes the ultimate loads measured in the tests (Pu,exp) and predicted by the CSFM (Pu,calc), as well as the respective failure modes. The ultimate load Pu corresponds to the mean of the four reaction forces (i.e., a quarter of the total applied load). Table 6.17 also provides the mean and the coefficient of variation (CoV) of the ratios between the measured and the calculated ultimate loads for each numerical model. Ratios above one denote conservative predictions, while those below one indicate unsafe estimates of the ultimate load.
In all of the numerical analyses, failure was triggered by concrete crushing (see Table 6.17). In the experiments, the failure was also due to concrete crushing, but it was preceded by a slight yielding of the main reinforcement (As1), which does not limit the ultimate load. While the yielding of the reinforcement is not captured by the CSFM, this does not have a significant impact on the quality of the results. The default model M0 leads to slightly unsafe strength predictions (by 4% on average). It should be noted that the predictions are clearly unsafe for specimen S5 regardless of the considered numerical parameters. These unsatisfactory results from the CSFM might be partially explained by the fact that the strength result from the experiment was abnormally low. In spite of S5 being similar to S4 but containing a 50% higher amount of transversal reinforcement and 20% larger loading plates, its strength is significantly lower than that of S4. This could either be an abnormal experimental result or just a consequence of the large scatter, which is expected in compressive failures of a strut.
The disparities among the different CSFM analyses can be easily analyzed by means of the ratio of the experimental to the calculated ultimate load (Pu,exp/Pu,calc). The variation in the mesh size and the consideration or not of tension stiffening do not significantly influence the ultimate loads (variations below 5%; see Fig. 6.24a-b). While the consideration of tension stiffening might impact the results in concrete crushing failures with transverse reinforcement (as it lowers the reinforcement strains and consequently increases the effective compressive strength), this is not the case here since the transverse strains remain very small and the compressive strength is hardly affected by the compression softening factor. The results are sensitive though to the considered ultimate compressive strain in the concrete (εcu2). Considering an ultimate strain of 2‰ (model M3) instead of the 3.5 ‰ in the default model, reductions of up to 10% of the predicted ultimate loads are obtained (see Fig. 6.24c).
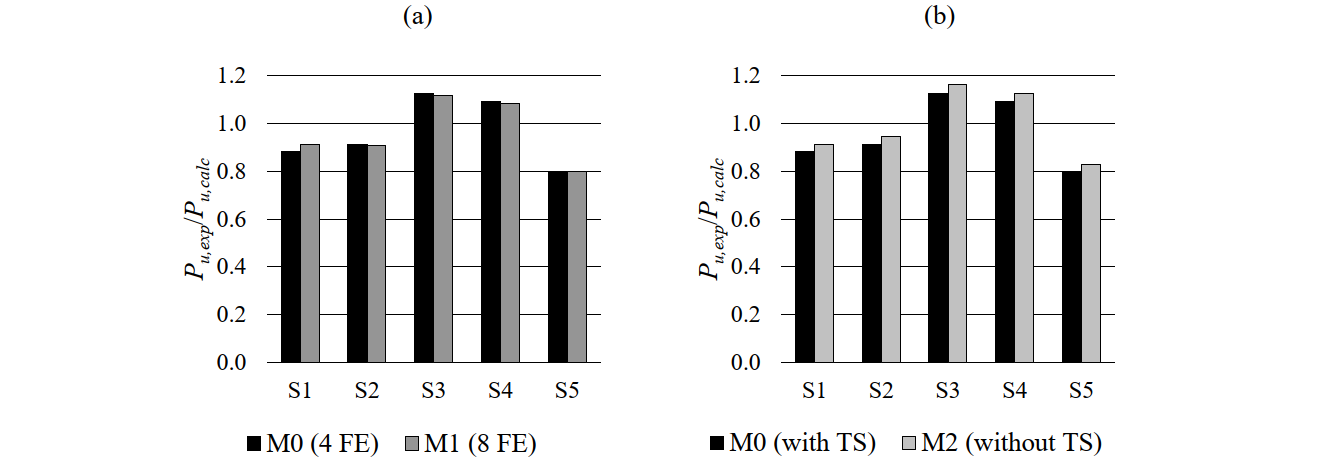
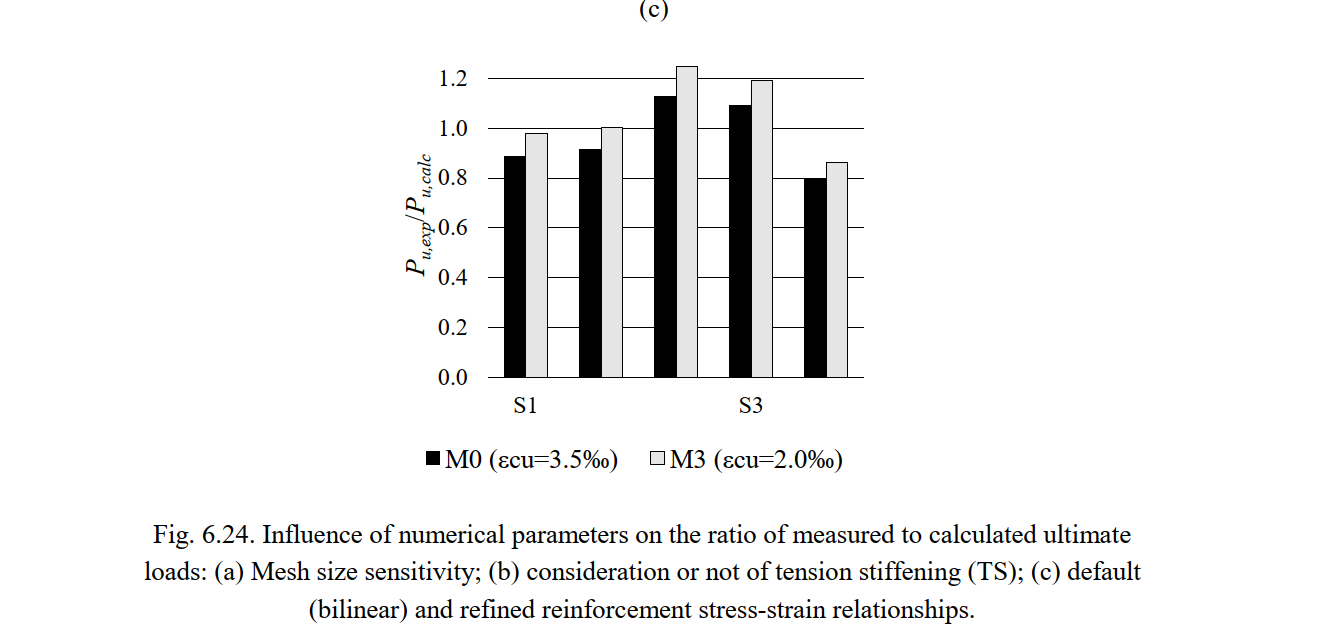
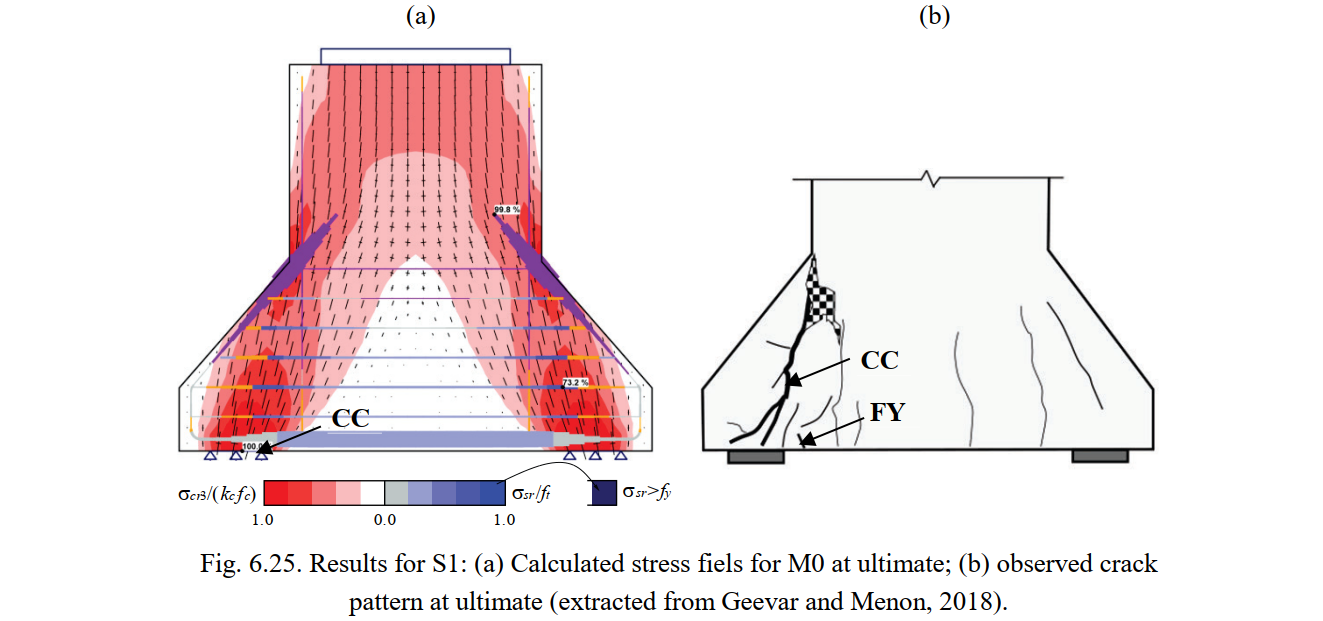
Fig. 6.25a shows the continuous stress field results (principal compressive stresses (σc) and steel stresses (σsr) at the cracks) for specimen S1; the predicted failure mode and location are marked. These results were calculated using the default numerical parameters M0. The observed crack patterns at ultimate are shown in Fig. 6.25b. The predicted locations where concrete is expected to be crushed agree with the experimental observations.
Conclusions
A good correspondence between the results from the CSFM and experimental observations can be found for the case of the discontinuity regions analyzed in this article. The following conclusions can be stated:
- CSFM analyses using default numerical parameters provide appropriate estimates of ultimate loads and failure modes. However, the results show that local compressive failures in a strut cannot be predicted with the same accuracy as failures in which the strength is limited by yielding of the reinforcement. This was an expectable result, which is compensated for in design codes by the higher safety coefficient for concrete in compression than for reinforcement.
- The variation in the mesh size and the consideration or not of tension stiffening do not significantly influence the ultimate loads in this case.