Svařovaný přípoj s nevyztuženou přírubou a svařovaným stojinou (WUF-W) – předkvalifikovaný přípoj dle AISC
Tento ověřovací příklad byl připraven v rámci společného projektu Ohio State University a IDEA StatiCa. Autoři jsou uvedeni níže:
- Baris Kasapoglu, doktorand
- Ali Nassiri, Ph.D.
- Halil Sezen, Ph.D.

3.1. Úvod
Třetím předkvalifikovaným přípojm zahrnutým v této ověřovací studii je momentový přípoj s nevyztuženou přírubou a svařovanou stojinou (WUF-W). V této kapitole bylo podobně jako v předchozích kapitolách vybráno šest experimentálně zkoumaných ocelových přípojů z literatury za účelem porovnání jejich ohybových momentových únosností získaných pomocí IDEA StatiCa a návrhového postupu AISC. Dále bylo provedeno porovnání závislosti moment–rotace mezi IDEA StatiCa a ABAQUS pro jeden ze vzorků vybraných jako základní model.
3.2 Experimentální studie
Ricles et al. (2000) provedli sérii experimentů za účelem zkoumání seismického chování tažných svařovaných přípojů s nevyztuženou přírubou na Lehigh University. Za tímto účelem bylo šest vnějších a pět vnitřních plnorozměrných přípojů vystaveno cyklickému zatížení. Přestože svařovací a geometrické detaily žádného z testovaných vzorků nutně nesplňují požadavky nejnovější normy AISC 358 (2016), byla tato experimentální studie vybrána pro zkoumání v rámci této ověřovací studie z následujících důvodů:
- V USA neexistuje žádný experimentální výzkum provedený pro WUF-W se vzorky, které splňují všechny požadavky uvedené v AISC 358 (2016)
- Tato studie je jednou z experimentálních studií, které tvořily základ požadavků na předkvalifikaci momentových přípojů WUF-W v AISC 358 (2016)
- Tento experimentální výzkum byl sponzorován sdružením SAC Joint Venture s financováním od Federal Emergency Management Agency (FEMA) za účelem vyhodnocení vylepšených detailů momentových přípojů WUF-W. Program výzkumu SAC byl realizován s cílem zlepšit návrh a výkonnost ocelových přípojů po špatném chování pozorovaném u některých přípojů po zemětřesení Northridge v roce 1994.
Zkušební uspořádání pro vnitřní přípoje je znázorněno na obrázku 3.1. Délka mezi podporou nosníku a osou sloupu byla 177 in. (4,50 m) a délka od aktuátoru ke spodní podpoře sloupu byla 156 in. (3,96 m). Z 11 testovaných přípojů bylo vybráno šest pro zahrnutí do této ověřovací studie. Geometrické a materiálové vlastnosti vybraných šesti přípojů jsou uvedeny v tabulkách 3.1 a 3.2 a konfigurace vzorků jsou zobrazeny na obrázcích 3.2 až 3.4.
Tabulka 3.1: Vlastnosti vzorků WUF-W
| Číslo vzorku | Nosník | Sloup | Rozměr smykového plechu (in.) | Tloušťka zdvojovacího plechu (in.) | Tloušťka výztuhy kontinuity (in.) |
| Základní model (T1) | W36x150 | W14x311 | 5/8x5x30.5 | - | 1,0 |
| T5 | W36x150 | W14x311 | 5/8x5x30.5 | 1/2 (jedna strana) | - |
| C1 | W36x150 | W14x398 | 5/8x5x30.5 | 3/4 (obě strany) | - |
| C2 | W36x150 | W14x398 | 5/8x5x30.5 | 3/8 (obě strany) | 1,0 |
| C3 | W36x150 | W27x258 | 5/8x5x30.5 | 3/8 (obě strany) | - |
| C4 | W36x150 | W27x258 | 5/8x5x30.5 | 3/4 (obě strany) | 1,0 |
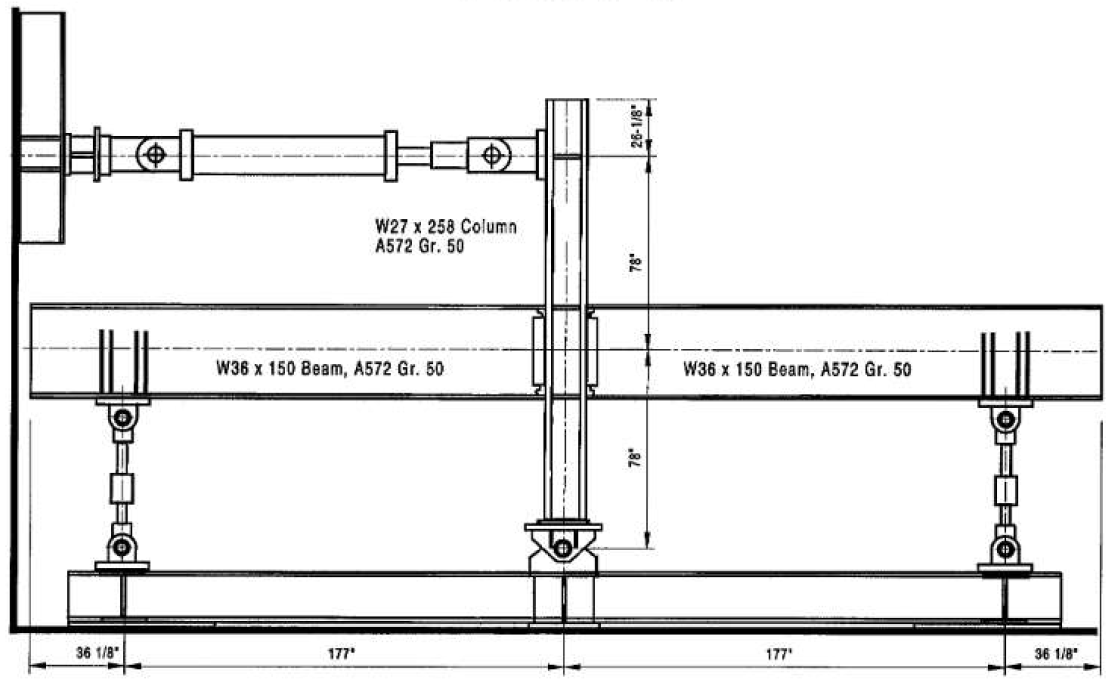
Obrázek 3.1: Zkušební uspořádání (Ricles et al., 2000)
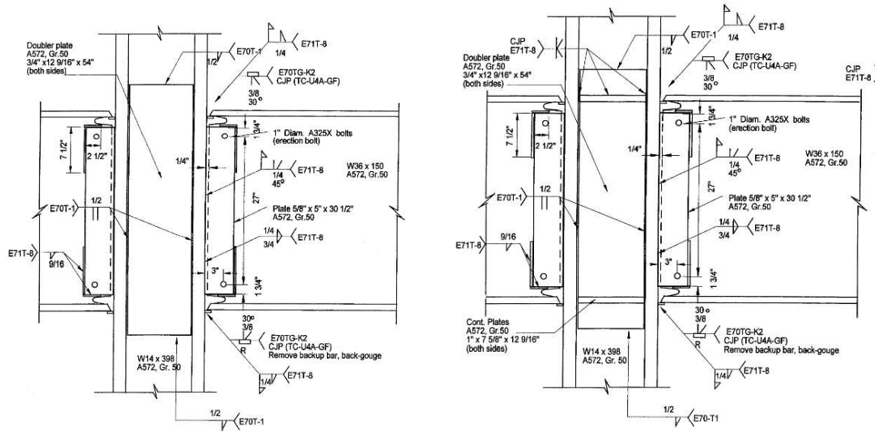
Obrázek 3.2: Vlevo) Konfigurace základního modelu T1; vpravo) konfigurace vzorku T5 (Ricles et al., 2000)
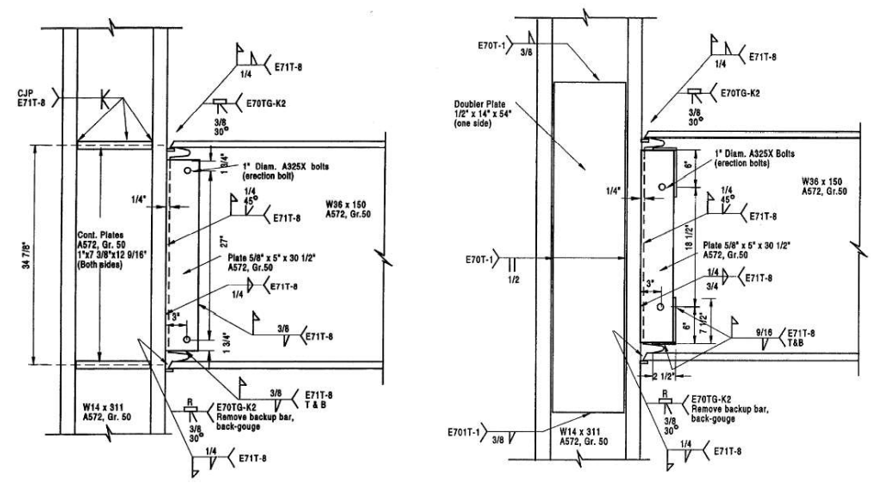
Obrázek 3.3: Vlevo) Konfigurace vzorku C1; vpravo) konfigurace vzorku C2 (Ricles et al., 2000)
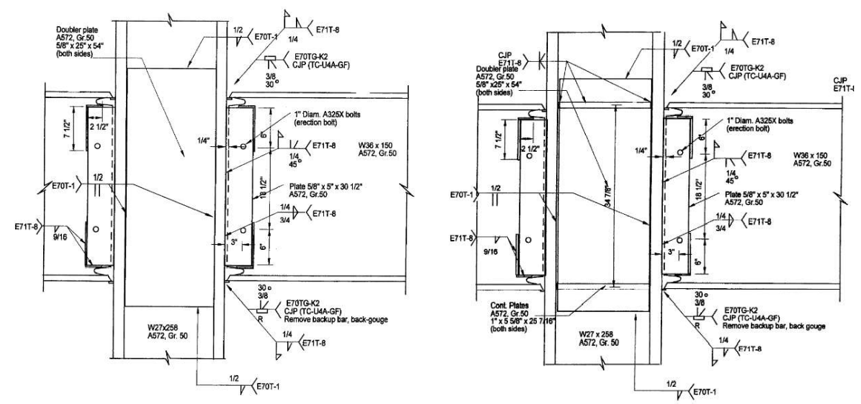
Obrázek 3.4: Vlevo) Konfigurace vzorku C3; vpravo) konfigurace vzorku C4 (Ricles et al., 2000)
Tabulka 3.2: Naměřené materiálové vlastnosti vzorků WUF-W (Ricles et al., 2000)
| Číslo vzorku | Průřez | Mez kluzu (ksi) | Mez pevnosti (ksi) |
| Základní model (T1) | Sloup (příruba) | 47,3 | 69,5 |
| Nosník (příruba) | 55,1 | 71,6 | |
| Smykový plech | 51,3 | 75,5 | |
| Výztuha kontinuity | 38,2 | 62,9 | |
| T5 | Sloup (příruba) | 47,3 | 69,5 |
| Nosník (příruba) | 55,1 | 71,6 | |
| Smykový plech | 51,3 | 75,5 | |
| Zdvojovací plech | 53,0 | 72,0 | |
| C1 | Sloup (příruba) | 53,2 | 72,4 |
| Nosník (příruba) | 56,7 | 72,5 | |
| Smykový plech | 51,3 | 75,5 | |
| Zdvojovací plech | 57,1 | 76,7 | |
| C2 | Sloup (příruba) | 53,2 | 72,4 |
| Nosník (příruba) | 56,7 | 72,5 | |
| Smykový plech | 51,3 | 75,5 | |
| Zdvojovací plech | 57,1 | 76,7 | |
| Výztuha kontinuity | 53,0 | 70,9 | |
| C3 | Sloup (příruba) | 50,2 | 73,3 |
| Nosník (příruba) | 55,1 | 71,6 | |
| Smykový plech | 51,3 | 75,5 | |
| Zdvojovací plech | 64,5 | 85,2 | |
| C4 | Sloup (příruba) | 50,2 | 73,3 |
| Nosník (příruba) | 55,1 | 71,6 | |
| Smykový plech | 51,3 | 75,5 | |
| Zdvojovací plech | 64,5 | 75,5 | |
| Výztuha kontinuity | 64,5 | 85,2 |
Základní model (vzorek T1) a vzorek T5 jsou vnější přípoje, zatímco ostatní jsou vnitřní přípoje, které se skládají ze stejných nosníků a přípojů připojených ke stejnému sloupu z každé vodorovné strany (viz obrázek 3.1). Protože stejné přípoje vykazovaly během zkoušení téměř stejné chování, jsou níže pro každý vnitřní vzorek zahrnutý v této studii (vzorky C1, C2, C3 a C4) sdíleny pouze jedna fotografie po zkoušce a závislost moment–rotace.
Stojina nosníku základního modelu byla tupým svarem přivařena k přírubě sloupu a přídavný svar byl proveden nepřetržitě po obvodu hran smykového plechu. Bylo hlášeno, že tupý svar mezi smykovým plechem a přírubou sloupu praskl během cyklů 2% driftu a příruby nosníku praskly během cyklů 4% driftu, jak je znázorněno na obrázku 3.5. Vzorek T5 byl navržen odlišně od základního modelu se zdvojovacím plechem, částečným svarem mezi smykovým plechem a stojinou nosníku, větší velikostí koutového svaru mezi smykovým plechem a přírubou sloupu a bez výztuhy kontinuity. Bylo hlášeno, že k tažnému lomu v přírubě nosníku došlo během cyklů 6% (viz obrázek 6).
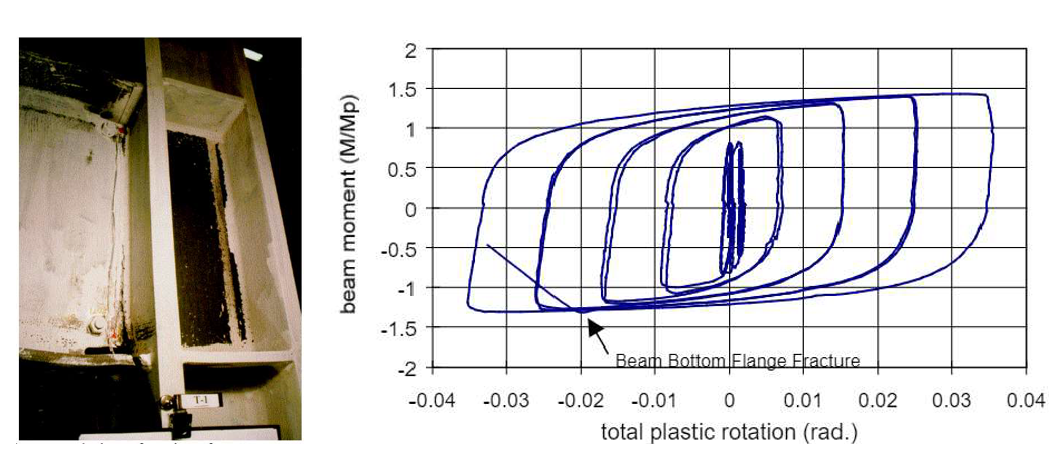
Obrázek 3.5: Vlevo) Základní model (T1) po zkoušení; vpravo) závislost moment–celková plastická rotace (Ricles et al., 2000)
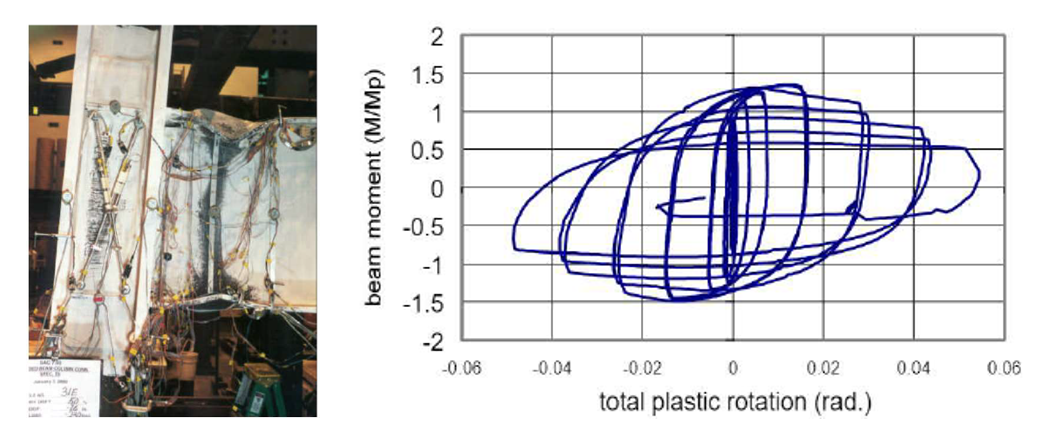
Obrázek 3.6: Vlevo) Vzorek T5 po zkoušení; vpravo) závislost moment–celková plastická rotace (Ricles et al., 2000)
Vzorek C1 byl jedním ze čtyř vnitřních přípojů zahrnutých v této studii. Měl větší rozměr sloupu a silnější zdvojovací plech ve srovnání se vzorkem T5. Tažný lom byl pozorován v prvním cyklu 5% driftu na horní přírubě západního nosníku a ve druhém cyklu 5% driftu na horní přírubě východního nosníku, jak je znázorněno na obrázku 3.7. Vzorek C2 byl na rozdíl od vzorku C1 navržen s výztuhou kontinuity a tenčím zdvojovacím plechem. Experimentální výsledky ukázaly, že vzorek C2 selhal během cyklů 6% driftu v důsledku tažného lomu na obou přírubách nosníku , jak je znázorněno na obrázku 3.8.
Vzorek C3 se skládal z hlubšího a tenčího sloupu ve srovnání s prvními čtyřmi vzorky. Ve zkušební zprávě bylo uvedeno, že tažný lom západní příruby nosníku byl pozorován během prvního cyklu 5,5% mezipodlažního driftu, jak je znázorněno na obrázku 3.9. Vzorek C4 měl silnější zdvojovací a výztuhy kontinuity navíc ke konfiguraci vzorku C3. Během experimentu došlo k tažnému lomu na konci cyklu 6% driftu (obrázek 3.10).
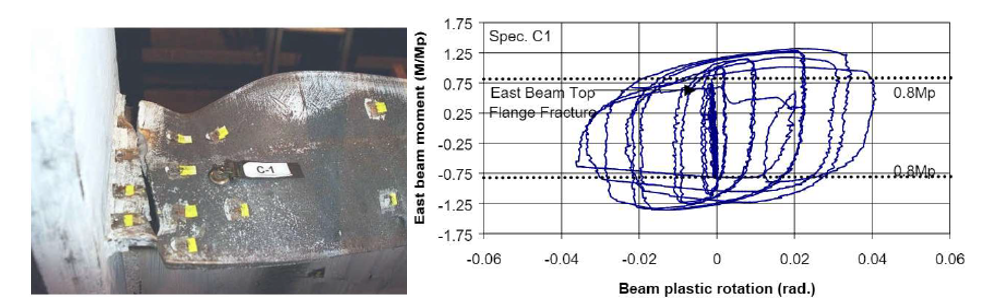
Obrázek 3.7: Vlevo) Vzorek C1 po zkoušení; vpravo) závislost moment–celková plastická rotace (Ricles et al., 2000)
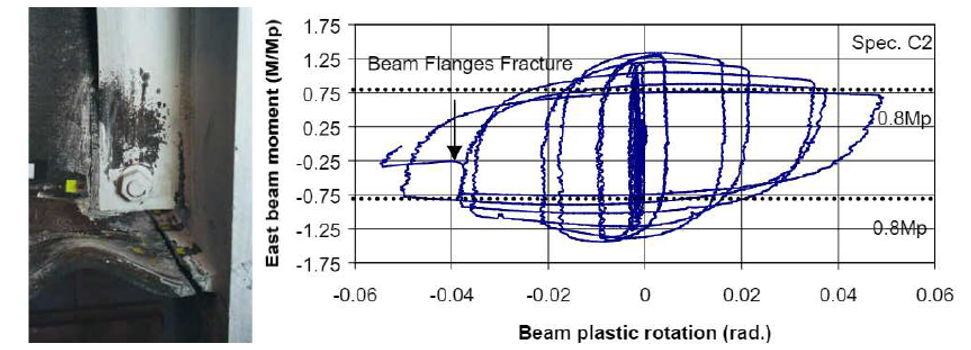
Obrázek 3.8: Vlevo) Vzorek C2 po zkoušení; vpravo) závislost moment–celková plastická rotace (Ricles et al., 2000)
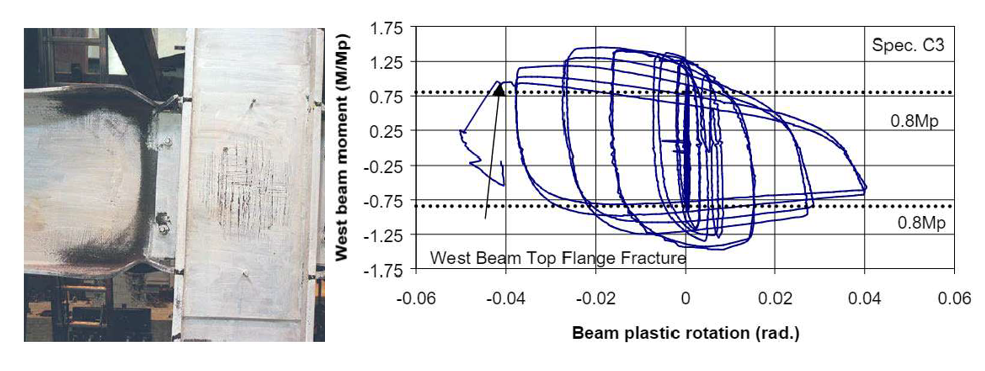
Obrázek 3.9: Vlevo) Vzorek C3 po zkoušení; vpravo) závislost moment–celková plastická rotace (Ricles et al., 2000)
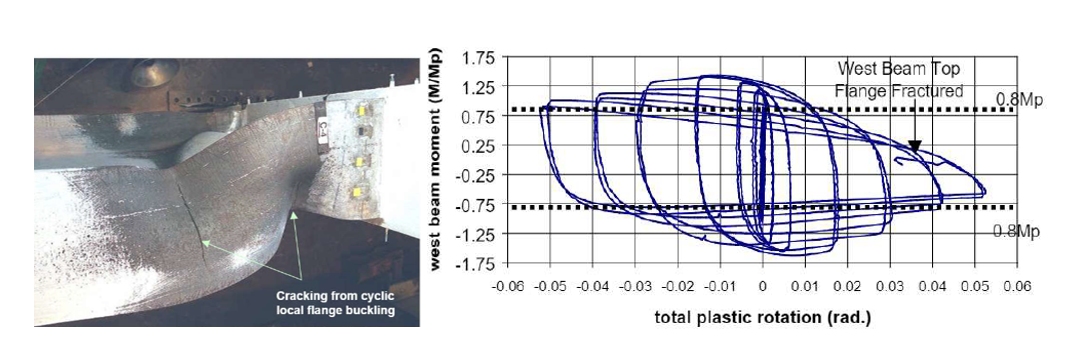
Obrázek 3.10: Vlevo) Vzorek C4 po zkoušení; vpravo) závislost moment–celková plastická rotace (Ricles et al., 2000)
3.3 Výpočty dle normy
Byl dodržen postup uvedený v oddílu 8.7 normy AISC 358 (2016) pro přípoje WUF-W a pro šest vzorků byla provedena následující posouzení.
- Posouzení geometrických omezení nosníku (AISC 358 Sec. 8.3.1)
- Posouzení geometrických omezení sloupu (AISC 358 Sec. 8.3.2)
- Posouzení návrhové smykové únosnosti nosníku (AISC 358, Sec. 8.7)
- Posouzení ohybové únosnosti (AISC 360, Eq. F2-1)
- Posouzení požadavků na výztuhy kontinuity (AISC 341, Sec.E3.6f.2)
- Posouzení vztahu únosností sloup–nosník (AISC 358 Section 8.4)
- Posouzení svarů příruby nosníku k přírubě sloupu (AISC 358 Section 8.5)
- Posouzení geometrie otvoru pro přístup ke svaru (AWS D1.8/D1.8M)
- Posouzení přípoje stojiny nosníku ke sloupu (AISC 358 Section 8.6)
Přehled normových posouzení dle AISC 358 (2016) pro šest vzorků je uveden v tabulce 3.3. Podrobnosti výpočtů a posouzení jsou uvedeny v přílohách E a F.
Tabulka 3.3: Normová posouzení dle AISC 358 (2016) pro vzorky
| Normová posouzení | Základní model (T1) | T5 | C1 | C2 | C3 | C4 |
| Geometrická omezení nosníku | OK | OK | OK | OK | OK | OK |
| Geometrická omezení sloupu | OK | OK | OK | OK | OK | OK |
| Návrhová smyková únosnost nosníku | OK | Nevyhovuje | Nevyhovuje | Nevyhovuje | Nevyhovuje | Nevyhovuje |
| Ohybová únosnost nosníku | OK | OK | OK | OK | OK | OK |
| Požadavky na výztuhy kontinuity | Nevyhovuje | - | - | Nevyhovuje | - | Nevyhovuje |
| Vztah únosností sloup–nosník | OK | OK | OK | OK | OK | OK |
| Přípoj příruby nosníku k přírubě sloupu | OK | OK | OK | OK | OK | OK |
| Geometrie otvoru pro přístup ke svaru | Nevyhovuje | Nevyhovuje | Nevyhovuje | Nevyhovuje | Nevyhovuje | Nevyhovuje |
| Přípoj stojiny nosníku ke sloupu | Nevyhovuje | OK | OK | OK | OK | OK |
| Styčníkový panel | OK | OK | OK | Nevyhovuje | OK | OK |
Předpokládá se, že plastický kloub vzniká na líci sloupu v souladu s oddílem 8.7 normy AISC 358 (2016). Momentová únosnost nosníku v místě plastického kloubu, \(M_{by@ph}\), může být vypočtena pomocí rovnice 3.1.
\(M_{by@ph}\) = \(F_{yb}Z_{bx}\) (3.1)
kde \(F_{yb}\) je mez kluzu nosníku, \(Z_{bx}\) je plastický průřezový modul nosníku. Plastické momentové únosnosti vzorků byly vypočteny a jsou uvedeny v tabulce 3.4.
Tabulka 3.4: Plastické momentové únosnosti vzorků vypočtené dle návrhového postupu AISC
| Číslo vzorku | Plastická momentová únosnost (kips-in.) |
| Základní model | 32 013 |
| T5 | 32 013 |
| C1 | 32 943 |
| C2 | 32 943 |
| C3 | 32 013 |
| C4 | 32 013 |
3.4 Analýza v IDEA StatiCa
Vybraných šest vzorků bylo modelováno v IDEA StatiCa s cílem simulovat chování experimentů. Jejich momentové únosnosti a způsoby porušení byly identifikovány pomocí analýzy typu napětí-přetvoření (tj. EPS). Naměřené materiálové vlastnosti uvedené v Ricles et al. (2000) (viz tabulka 3.2) byly zadány do softwaru a součinitele únosnosti byly nastaveny na hodnotu 1,0. Pomocí analýzy tuhosti přípoje (tj. ST) v IDEA StatiCa byla vypočtena závislost moment–rotace pro základní model.
3.4.1 Analýza základního modelu
V IDEA StatiCa byl vytvořen model základního vzorku. Byly zadány naměřené materiálové vlastnosti a součinitele nadpevnosti \(R_{y}\) a \(R_{t}\) byly nastaveny na hodnotu 1,0 (viz obrázek 3.11). Dále byly všechny součinitele únosnosti LRFD nastaveny na hodnotu 1,0, aby bylo možné porovnat vypočtenou skutečnou odezvu přípojů s odezvou naměřenou během laboratorního experimentu (Ricles et al., 2000). Pro získání zatížení v ose sloupu byl v SAP2000 vytvořen rámový model sloup–nosník s využitím délek sloupu a nosníku ze zkušebního uspořádání. Na spodním konci sloupu byla použita kloubová podpora a na konci nosníku posuvná podpora.
Pro výpočet momentové únosnosti základního modelu bylo aplikováno přírůstkové zatížení pomocí analýzy napětí-přetvoření (tj. EPS) s možností „zatížení v rovnováze" v modelu IDEA StatiCa, dokud nebylo dosaženo jedné z následujících podmínek:
- 5% plastického přetvoření v pleších
- 100% únosnosti šroubů
- 100% únosnosti svarů
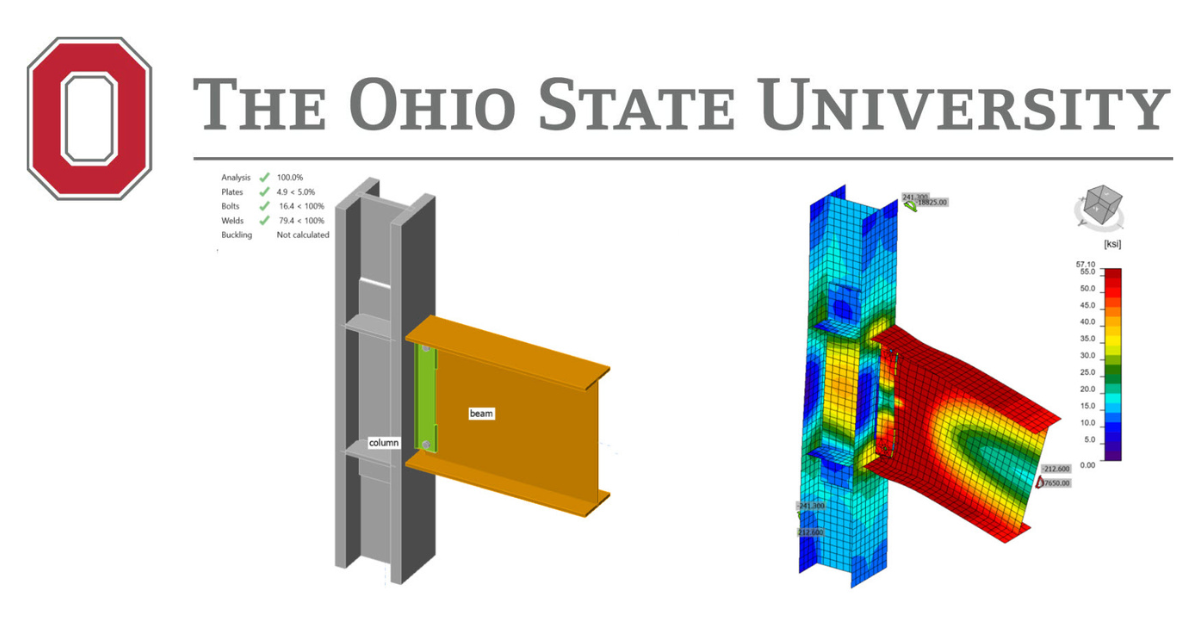
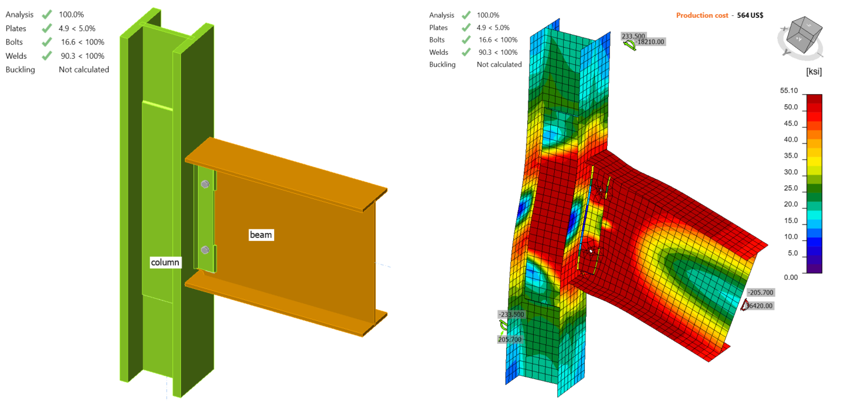
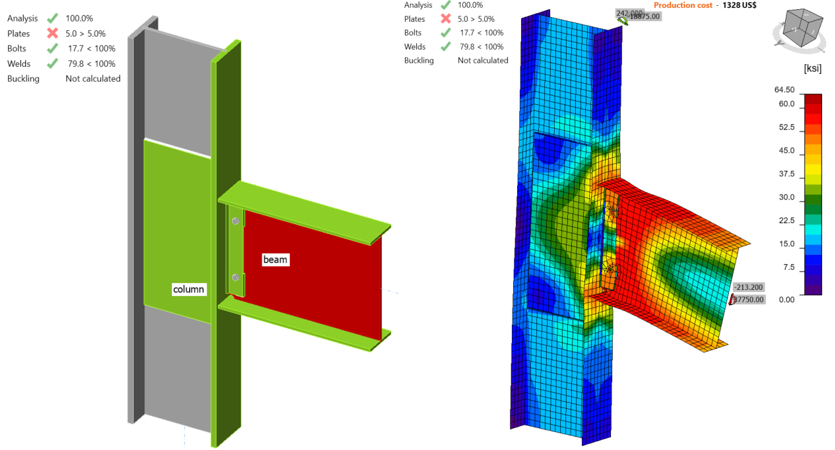
Svar mezi smykovým plechem a přírubou sloupu dosáhl své únosnosti při hodnotách posouvající síly a odpovídajícího momentu 167,70 kips a 29 700 kips-in. (obrázek 3.11). Pomocí analýzy „ST" byla získána závislost moment–rotace, která je znázorněna na obrázku 3.12.
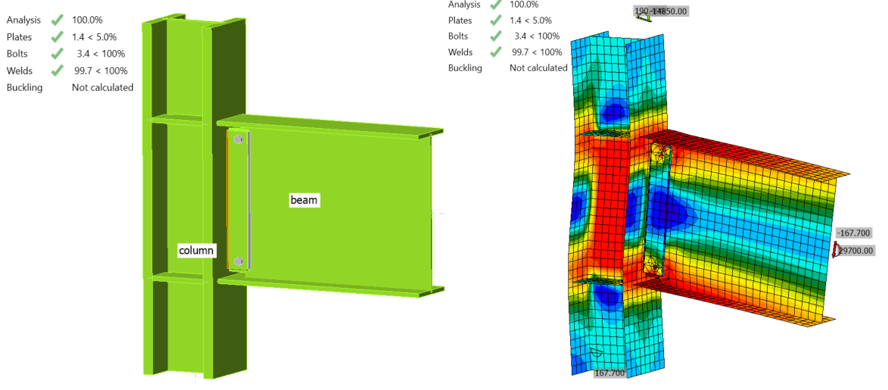
Obrázek 3.11: Model IDEA StatiCa pro základní model
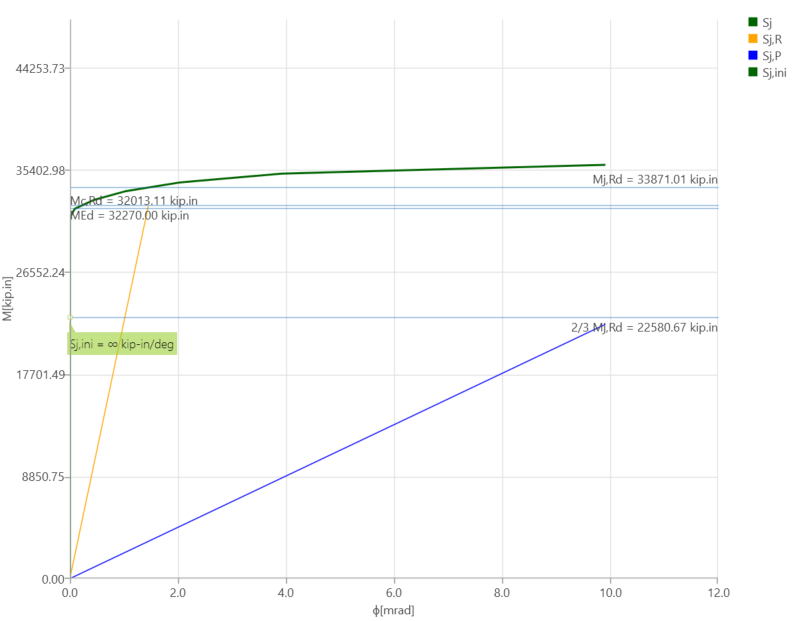
Obrázek 3.12: Závislost moment–rotace pro základní model
3.4.2 Analýza variantních vzorků
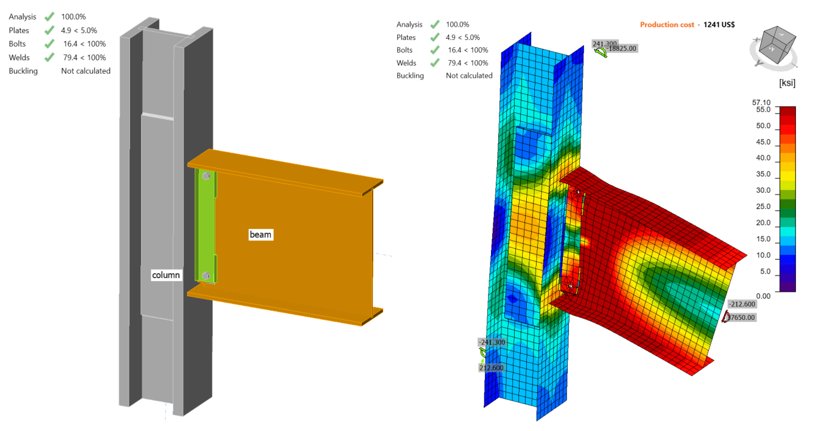
Analýza v IDEA StatiCa byla provedena pro vzorek T5 podle postupu popsaného pro základní model. Bylo zjištěno, že stojina nosníku dosáhla 5% plastického přetvoření při hodnotách posouvající síly a odpovídajícího momentu 205,70 kips a 36 420 kips-in. (obrázek 3.13).
Obrázek 3.13: Model IDEA StatiCa pro vzorek T5
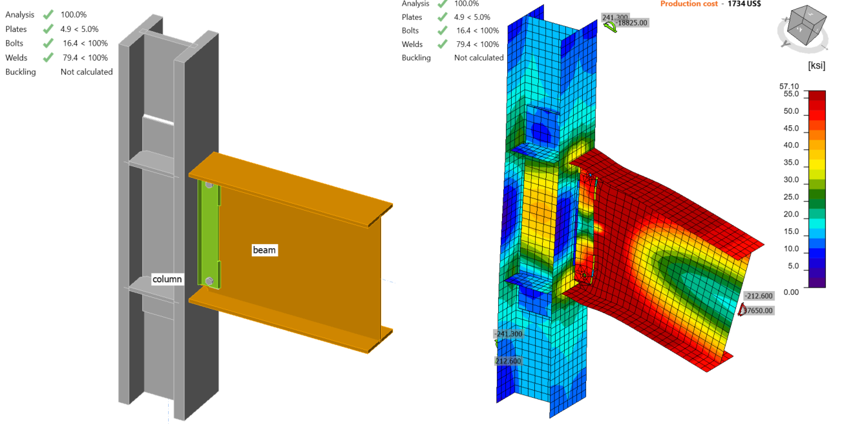
Vzorek C1 byl modelován a analyzován v IDEA StatiCa podle stejného postupu. Bylo zjištěno, že stojina nosníku dosáhla 5% plastického přetvoření při hodnotách posouvající síly a odpovídajícího momentu 212,60 kips a 37 650 kips-in. (obrázek 3.14).
Obrázek 3.14: Model IDEA StatiCa pro vzorek C1
Podle stejného postupu popsaného v této části byla provedena analýza v IDEA StatiCa pro vzorek C2. Bylo zjištěno, že stojina nosníku dosáhla 5% plastického přetvoření při hodnotách posouvající síly a odpovídajícího momentu 212,60 kips a 37 650 kips-in. (obrázek 3.15).
Obrázek 3.15: Model IDEA StatiCa pro vzorek C2
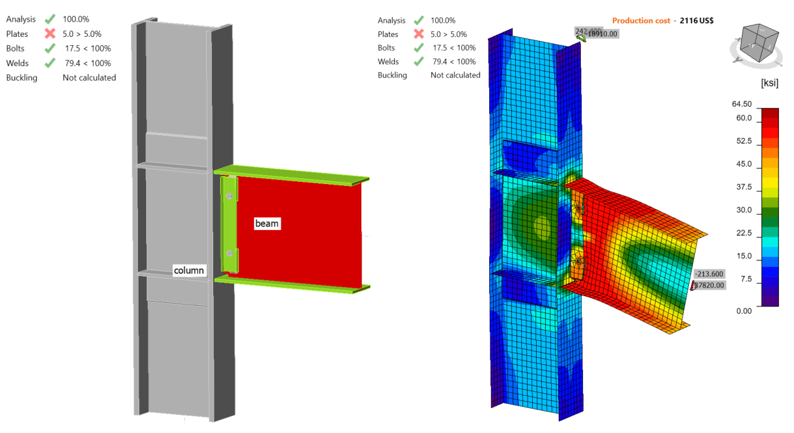
Podle stejného postupu byla provedena analýza v IDEA StatiCa pro vzorek C3. Bylo zjištěno, že stojina nosníku dosáhla 5% plastického přetvoření při hodnotách posouvající síly a odpovídajícího momentu 213,20 kips a 37 750 kips-in. (obrázek 3.16).
Obrázek 3.16: Model IDEA StatiCa pro vzorek C3
Podle stejného postupu byla provedena analýza v IDEA StatiCa pro vzorek C4. Bylo zjištěno, že stojina nosníku dosáhla 5% plastického přetvoření při hodnotách posouvající síly a odpovídajícího momentu 213,60 kips a 37 820 kips-in. (obrázek 3.17).
Obrázek 3.17: Model IDEA StatiCa pro vzorek C4
Šest vzorků bylo analyzováno v IDEA StatiCa a jejich momentové únosnosti v ose sloupu byly vypočteny při simulaci podmínek zkoušení. Pro porovnání momentových únosností s hodnotami vypočtenými dle postupu AISC 358 byly momentové únosnosti na líci sloupu vypočteny pomocí rovnice 3.6 a jsou uvedeny v tabulce 3.5.
\(M_{y@foc}\) = \(M_{y@cc} + V\frac{d_{c}}{2}\) (3.6)
kde \(M_{y@foc}\) je momentová únosnost na líci sloupu, \(M_{y@cc}\) je momentová únosnost v ose sloupu, \(V\) je posouvající síla a \(d_{c}\) je výška sloupu.
Tabulka 3.5: Momentová únosnost vypočtená pomocí IDEA StatiCa
| Číslo vzorku | (kips) | (in.) | (kips-in.) | (kips-in.) |
| Základní model (T1) | 167,70 | 17,1 | 29 700 | 28 266 |
| T5 | 205,70 | 17,1 | 36 420 | 34 662 |
| C1 | 212,60 | 18,3 | 37 650 | 35 705 |
| C2 | 212,60 | 18,3 | 37 650 | 35 705 |
| C3 | 213,20 | 29,0 | 37 750 | 34 659 |
| C4 | 213,60 | 29,0 | 37 820 | 34 723 |
3.5. Analýza v ABAQUS
V této části byl základní model vyvinutý v oddílu 3.4.1 znovu vytvořen v softwaru ABAQUS (verze 2022) pro analýzu metodou konečných prvků a výsledky byly porovnány s IDEA StatiCa. CAD model pro analýzu metodou konečných prvků byl vygenerován pomocí platformy prohlížeče IDEA StatiCa. Dva šrouby a 5 svarových linií (tj. mezi smykovým plechem–stojinou nosníku a smykovým plechem–přírubou sloupu) byly následně ručně přidány do sestavy pomocí CAD rozhraní v ABAQUS. Svislé zatížení 182,2 kips a odpovídající moment 32 270 kips-in. (kolem osy Y) byly aplikovány na definovaný referenční bod (tj. RF1) v ose sloupu, jak je znázorněno na obrázku 3.18. Analytická délka sloupu v IDEA StatiCa byla 215,45 in. Proto, aby byla v ABAQUS simulována stejná délka sloupu, byly zavedeny dva další referenční body (tj. RF2 a RF3) ve vzdálenosti 107,725 in. od středu sloupu podél osy Z v obou směrech (viz obrázek 3.18). Tyto dva referenční body byly pevně uloženy ve všech směrech a byly spojeny s horní a dolní plochou sloupu pomocí modulu pro tvorbu konektorů v ABAQUS. V ABAQUS byla po analýze citlivosti sítě zvolena velikost prvku v rozsahu 0,1–0,25 in. a celkem bylo vygenerováno 240 417 prvků. Jako typ prvku byl zvolen 3D napěťový, 8uzlový lineární kvádrový prvek se sníženou integrací (tj. C3D8R).
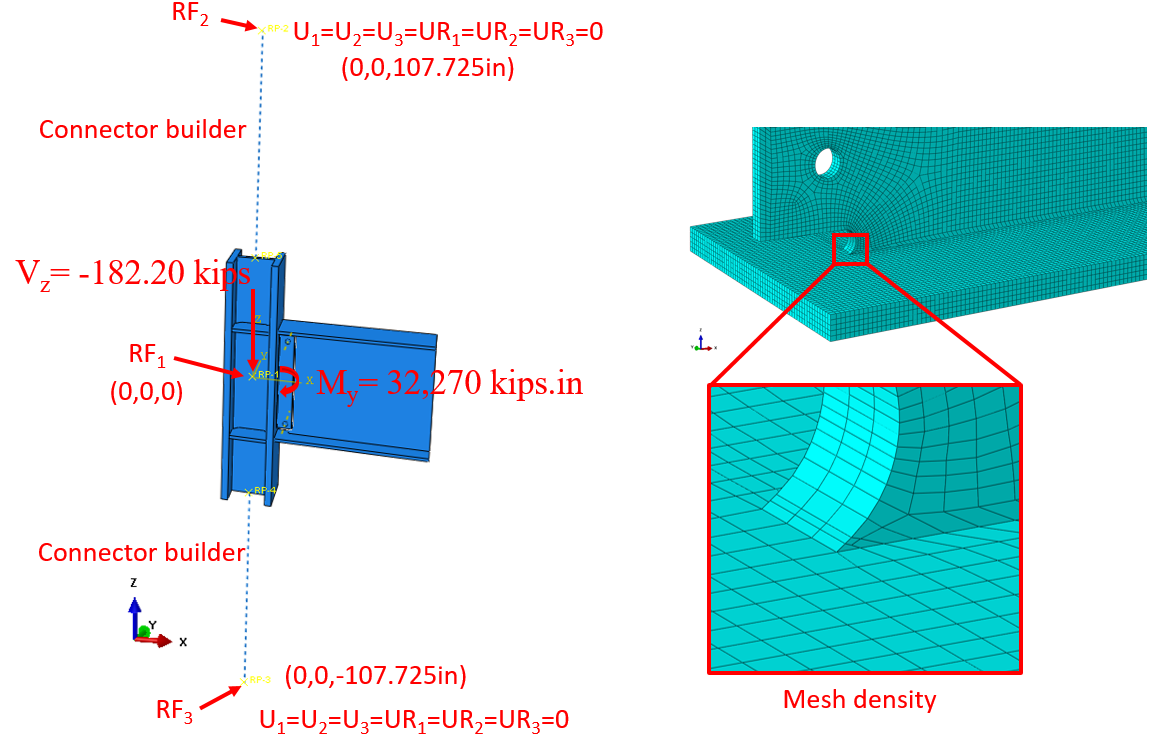
Obrázek 3.18: Nastavení modelu v ABAQUS
Mezi svarovými liniemi a připojenými částmi byla aplikována vazba „tie". Chování materiálu bylo modelováno pomocí bilineární plasticity v ABAQUS. Ostatní parametry, včetně hustoty, modulu pružnosti a Poissonova poměru, byly převzaty z knihovny materiálů IDEA StatiCa. Numerická simulace byla provedena na čtyřech procesorech (Intel Xenon (R) CPU E5-2698 v4 @ 2,20 GHz) a trvala přibližně 155 minut. Obrázek 3.19 porovnává předpovězené napětí von Mises mezi IDEA StatiCa a ABAQUS.
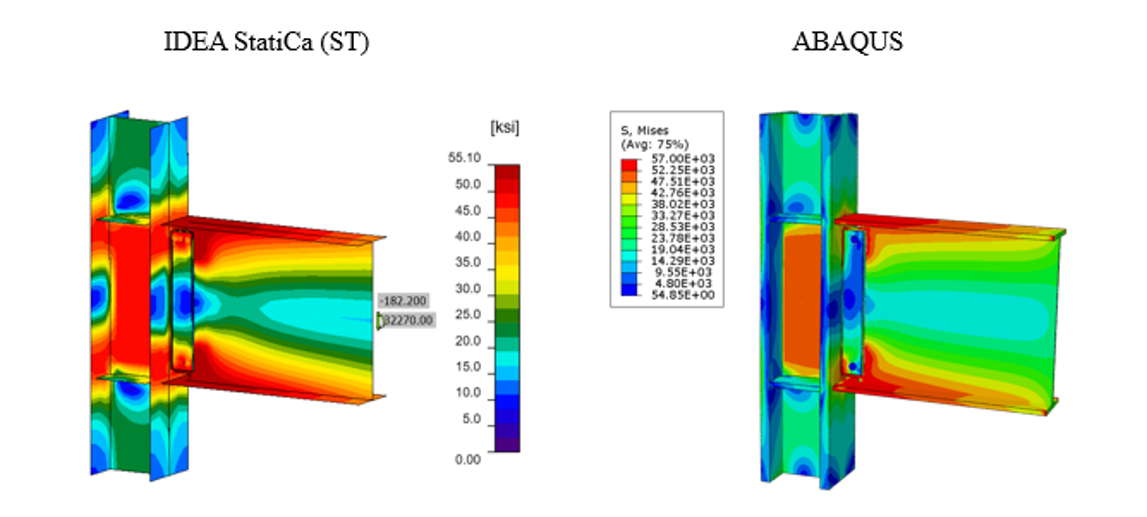
Obrázek 3.19: Porovnání vypočteného napětí von Mises mezi modely IDEA StatiCa a ABAQUS
Maximální předpovězené napětí v IDEA StatiCa bylo 55,90 ksi na horní přírubě nosníku (poznámka: legenda IDEA StatiCa zobrazuje návrhové hodnoty), zatímco model ABAQUS vykazuje maximální napětí 56,5 ksi na stejném místě. Maximální napětí 57 ksi v legendě ABAQUS náleží přední dlouhé svarové linii spojující smykový plech se sloupem. Mírně odlišné rozložení napětí je pravděpodobně způsobeno zohledněním délky sloupu v ABAQUS a způsobem aplikace okrajových podmínek, použitím jemnější sítě v analýze metodou konečných prvků a zjednodušeným CAD modelem v IDEA StatiCa. Autoři provedli standardní analýzu citlivosti sítě také pro model IDEA StatiCa a byly zaznamenány určité nesrovnalosti ve výsledcích.
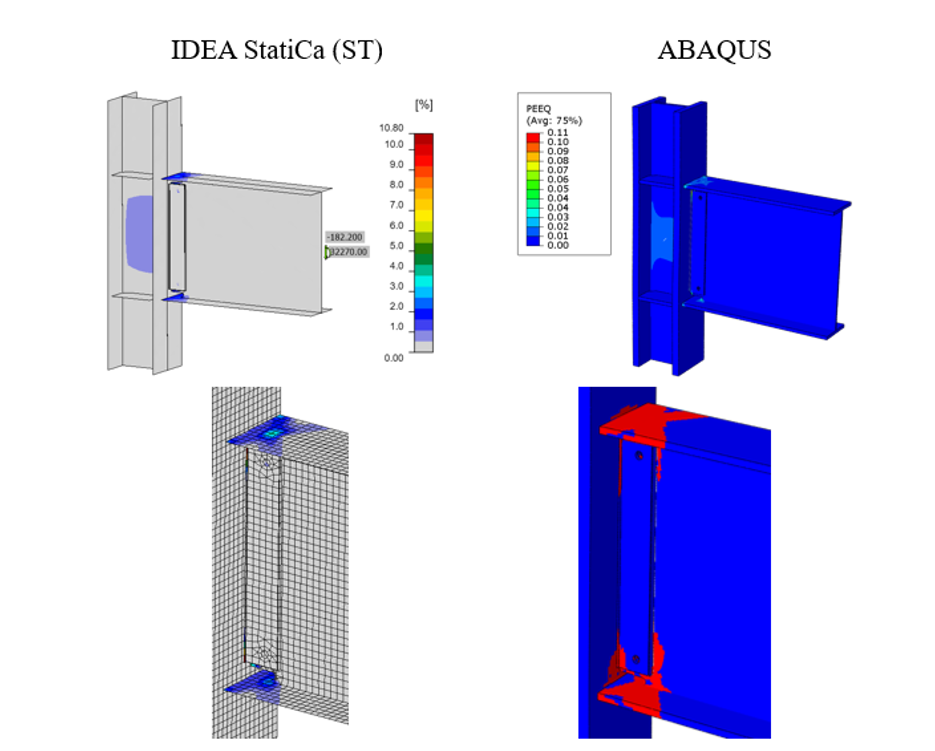
Obrázek 3.20: Porovnání vypočteného plastického přetvoření mezi modely IDEA StatiCa a ABAQUS
Maximální vypočtené plastické přetvoření v IDEA StatiCa a ABAQUS bylo 10,8 % a 11 % (v obou případech na přední svarové linii spojující smykový plech se sloupem). Předpovězená oblast plastické deformace v IDEA StatiCa byla také konzistentní s vypočtenou mapou plasticity v ABAQUS (tj. spodní řada na obrázku 3.20). Obrázek 3.21 znázorňuje porovnání křivky moment–rotace mezi oběma softwary vzhledem k ose sloupu. Poznámka: na obrázku 3.21 byla pro získání celkové rotace v IDEA StatiCa (znázorněna přerušovanou oranžovou čarou) lineární rotace nosníku v ose sloupu vypočtena pomocí SAP2000 a poté přičtena k výchozí křivce plastické rotace reportované IDEA StatiCa (znázorněna plnou oranžovou čarou). Oba modely poskytují srovnatelné odhady počáteční tuhosti. Menší odchylka může být spojena s rozdílem v typech prvků (tj. objemový prvek v ABAQUS oproti skořepinovému prvku v IDEA StatiCa) a použitím vazby „tie" v ABAQUS pro reprezentaci svarů.
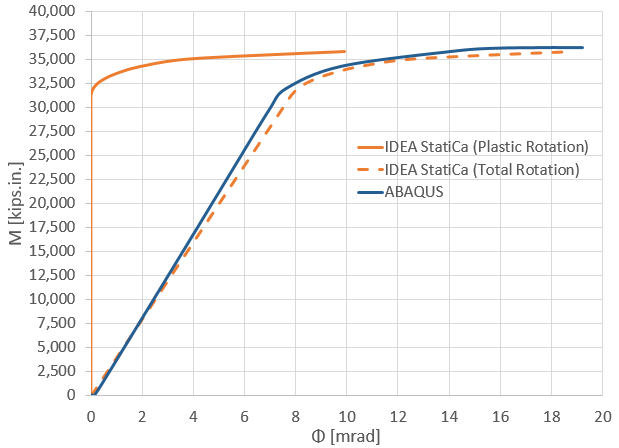
Obrázek 3.21: Porovnání moment–rotace mezi IDEA StatiCa a ABAQUS
3.6 Shrnutí a porovnání výsledků
Experimentální pozorování ukazují, že základní model selhal v důsledku lomu ve svaru mezi stojinou nosníku a přírubou sloupu. Podobně analýza v IDEA StatiCa ukázala, že svar selhal mezi smykovým plechem a přírubou sloupu. Normová posouzení dle AISC také ukázala, že tento svar nesplňuje omezení přípoje stojiny nosníku ke sloupu uvedená v oddílu 8.6 normy AISC 358 (2016) (viz tabulka 3.3). Závislosti moment–plastická rotace naměřené během experimentu a vypočtené pomocí analýzy v IDEA StatiCa pro základní model jsou porovnány na obrázku 3.22. Momentová únosnost vypočtená dle postupu AISC na líci sloupu byla převedena do osy sloupu pomocí rovnice 3.6, protože porovnání moment–rotace bylo provedeno v ose sloupu, a je zobrazena ve stejném grafu spolu s hodnotou vypočtenou pomocí analýzy napětí-přetvoření v IDEA StatiCa (obrázek 3.5).
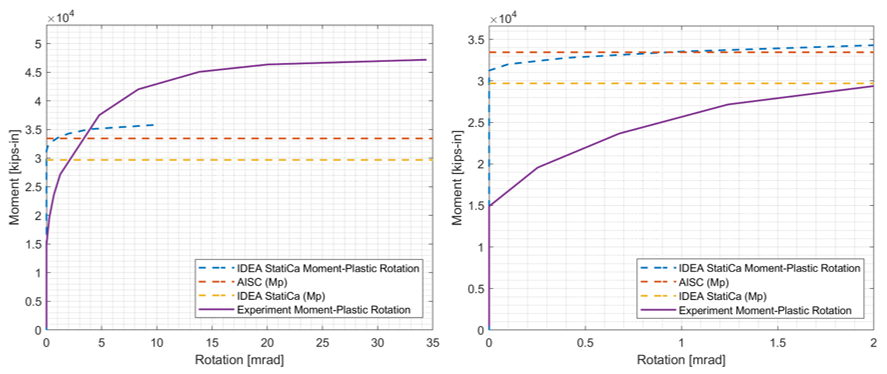
Obrázek 3.22: Porovnání moment–rotace
Pokud jde o variantní vzorky (viz oddíl 3.2), bylo v experimentální studii (Ricles et al., 2000) pozorováno, že vzorky selhaly v důsledku výrazného lokálního boulení a lomu v přírubách nosníku (obrázky 3.6 až 3.10). Podobně analýza v IDEA StatiCa ukázala, že vzorky T5, C1, C2, C3 a C4 dosáhly své únosnosti ve stojině nosníku, která dosáhla limitu 5% plastického přetvoření (obrázky 3.13 až 3.17). Na druhé straně, na základě normových posouzení dle AISC, bylo očekáváno, že k porušení dojde v nosníku, přestože některá posouzení nebyla plně splněna (např. výztuha kontinuity a otvor pro přístup ke svaru v tabulce 3.3). To je způsobeno mírným rozdílem v geometrických požadavcích. Momentové únosnosti všech vzorků vypočtené pomocí IDEA StatiCa (tabulka 3.5) a dle postupu AISC (tabulka 3.4) jsou uvedeny na obrázku 3.23.
Všechny momentové únosnosti vypočtené z IDEA StatiCa (s použitím skutečných nebo naměřených vlastností) jsou přibližně o 8 % větší než hodnoty dle AISC, s výjimkou základního modelu. To je odůvodněné, protože momentová únosnost dle AISC, \(M_{p}\), vychází z návrhového předpokladu, že poloha plastického kloubu je uvažována na líci sloupu v souladu s oddílem 8.7 normy AISC 358 (2016). Na druhé straně FEMA (2000) doporučuje uvažovat polohu plastického kloubu ve vzdálenosti poloviny výšky nosníku od líce sloupu pro momentové přípoje WUF-W. Pokud by byla poloha plastického kloubu uvažována ve určité vzdálenosti od líce sloupu, musel by být zohledněn dodatečný moment způsobený posouvající silou od plastického kloubu k líci sloupu, čímž by byly vypočteny větší momentové únosnosti. Rozdíl mezi momentovými únosnostmi vypočtenými dle návrhového postupu AISC a pomocí IDEA StatiCa lze přičíst konzervativnímu předpokladu AISC 358 pro polohu plastického kloubu momentových přípojů WUF-W.
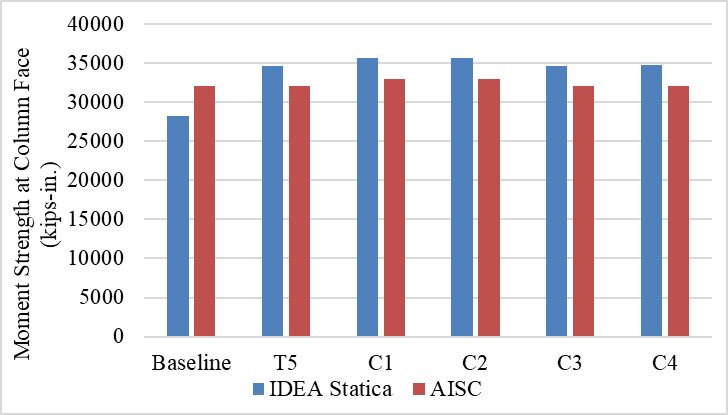
Obrázek 3.23: Momentová únosnost vypočtená pomocí IDEA StatiCa a postupu AISC
Přečtěte si celou studii o předkvalifikovaných přípojích!
Reference
AISC (2016), „Prequalified Connections for Special and Intermediate Steel Moment Frames for Seismic Applications, including Supplement No. 1," American Institute of Steel Construction ANSI/AISC 358-16, Chicago, Illinois.
Ricles, J.M., Mao, C., Lu, L.W. and Fisher, J.W. (2000), „Development and Evaluation of Improved Details for Ductile Welded Unreinforced Flange Connections," Report No. SAC/BD-00-24, SAC Joint Venture, Sacramento, CA.
FEMA (2000), Recommended Seismic Design Criteria for New Steel Moment-Frame Buildings, FEMA 350, Federal Emergency Management Agency, Washington, DC.