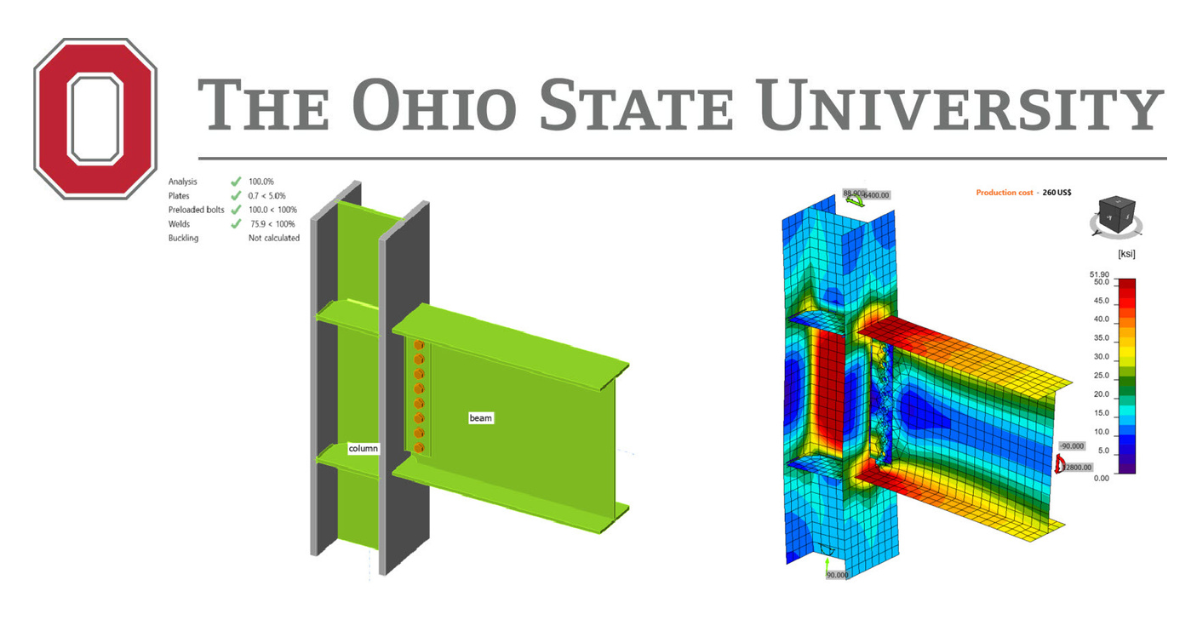
Svařovaný nepřivyztužený pásnicový-šroubovaný stojinový (WUF-B) předkvalifikovaný přípoj - AISC
Tento ověřovací příklad byl připraven v rámci společného projektu Ohio State University a IDEA StatiCa. Autoři jsou uvedeni níže:
- Baris Kasapoglu, doktorand
- Ali Nassiri, Ph.D.
- Halil Sezen, Ph.D.

4.1. Úvod
Na rozdíl od ostatních momentových přípojů zahrnutých v této studii je svařovaný nepřivyztužený pásnicový-šroubovaný stojinový (WUF-B) momentový přípoj povolen pouze pro systém běžného momentového rámu (OMF). V této studii bylo zkoumáno pět testovaných a tři navržené přípoje WUF-B. Pomocí IDEA StatiCa a postupem návrhu dle AISC byly vypočteny ohybové únosnosti osmi přípojů a výsledky byly porovnány. Jeden z testovaných vzorků byl vybrán jako základní model pro další zkoumání v programu Abaqus. Křivka moment-rotace byla vypočtena pro základní model pomocí IDEA StatiCa i Abaqus a vypočtené křivky byly porovnány s naměřenou křivkou uvedenou ve zkušební zprávě. Dále byl podrobně zkoumán vliv různých typů šroubů.
4.2 Experimentální studie
Sedm identických párů momentových přípojů WUF-B bylo posouzeno v souladu s testovacím protokolem SAC Phase 2 (SAC, 1997) autory Lee et al. (1999) na Lehigh University v rámci programu SAC Phase II. Pro tuto studii bylo vybráno pět testovaných vzorků, přičemž jeden z nich byl zvolen jako základní model. Vlastnosti vzorků jsou uvedeny v tabulce 4.1. Základní model se skládá z nosníku W24x68 a sloupu W14x120, šesti šroubů A325 s kritickým skluzem (SC) o průměru 7/8 in., smykového plechu tloušťky 3/8 in. a výztužného plechu tloušťky 5/8 in. Varianta 1, varianta 2 a varianta 3 mají shodný nosník W30x99, smykovou zarážku tloušťky 1/2 in., výztužný plech tloušťky 3/4 in. a osm šroubů A325 s kritickým skluzem (SC) o průměru 1 in., přičemž rozměry sloupů jsou W14x145, W14x176 a W14x257. Varianta 4 má nosník W36x150 a sloup W14x257, deset šroubů A325 o průměru 1 in. s únosností v otlačení se závity vyloučenými ze smykových rovin, smykový plech tloušťky 5/8 in. a výztužný plech tloušťky 1 in.
Tabulka 4.1: Vlastnosti vzorků WUF-B (Lee et al., 1999)
| Číslo vzorku (ID zkoušky) | Rozměr nosníku | Rozměr sloupu | Smyková zarážka | Šrouby | Tloušťka výztužného plechu |
| Základní model (3.1) | W24x68 | W14x120 | 18"x5"x3/8" | 6×7/8-in. A325 SC | 5/8 in. |
| Varianta 1 (4.1) | W30x99 | W14x145 | 24"x5"x1/2" | 8×1-in. A325 SC | 3/4 in. |
| Varianta 2 (5.1) | W30x99 | W14x176 | 24"x5"x1/2" | 8×1-in. A325 SC | 3/4 in. |
| Varianta 3 (6.1) | W30x99 | W14x257 | 24"x5"x1/2" | 8×1-in. A325 SC | 3/4 in. |
| Varianta 4 (7.1) | W36x150 | W14x257 | 30"x5"x5/8" | 10-1-in. A325 X | 1 in. |
Vzdálenost mezi podporami sloupu je 144 in. a vzdálenost od líce sloupu k aktuátoru je 134,9 in. Zkušební uspořádání a konfigurace pěti přípojů jsou uvedeny na obrázcích 4.1 až 4.3.
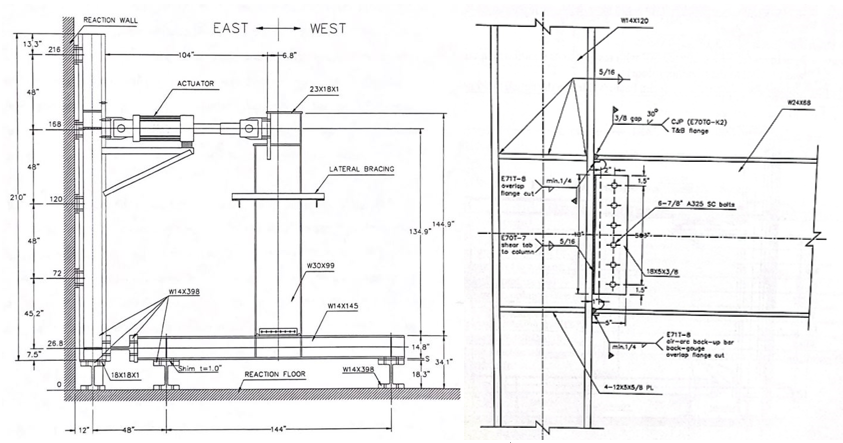
Obrázek 4.1: Vlevo) Zkušební uspořádání; Vpravo) konfigurace základního modelu (Lee et al., 1999)
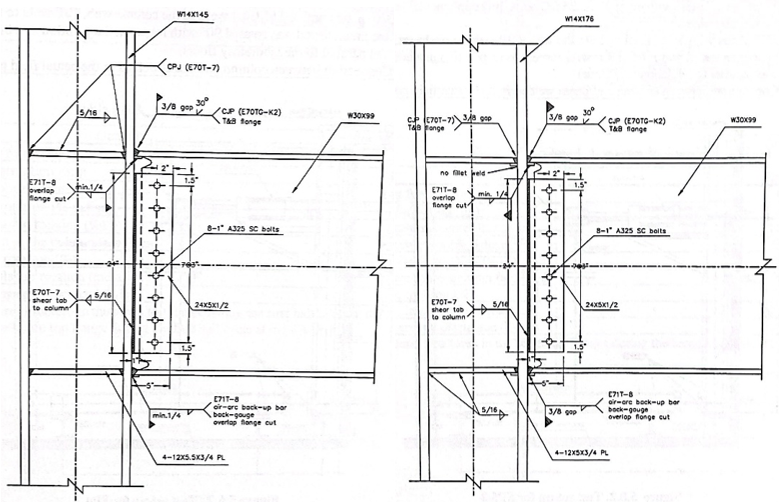
Obrázek 4.2: Vlevo) Konfigurace varianty 1; Vpravo) konfigurace varianty 2 (Lee et al., 1999)
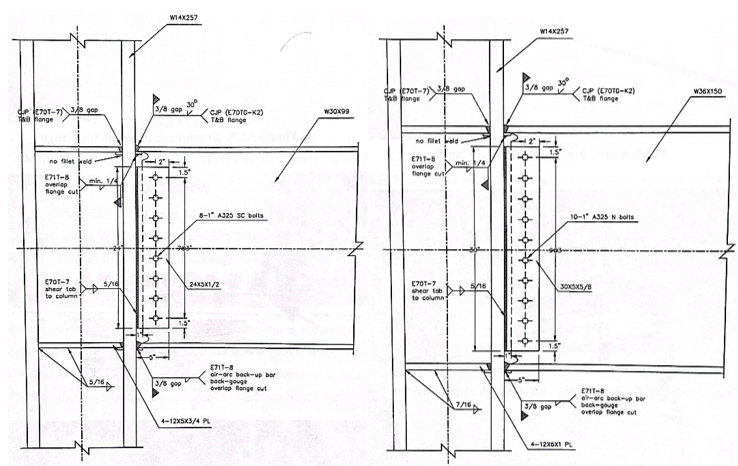
Obrázek 4.3: Vlevo) Konfigurace varianty 3; Vpravo) konfigurace varianty 4 (Lee et al., 1999)
Materiálové vlastnosti z tahových zkoušek vzorků pro pásnici nosníku, pásnici sloupu, smykový plech a výztužný plech jsou uvedeny v tabulce 4.2.
Tabulka 4.2: Naměřené materiálové vlastnosti vybraných vzorků WUF-B (Lee et al., 1999)
| Číslo vzorku (ID zkoušky) | Prvek | Mez kluzu (ksi) | Mez pevnosti (ksi) |
| Základní model (3.1) | Nosník | 45,4 | 67,4 |
| Sloup | 46,0 | 67,6 | |
| Smykový plech | 46,6 | 70,4 | |
| Výztužný plech | 51,6 | 73,4 | |
| Varianta 1 (4.1) | Nosník | 51,2 | 69,8 |
| Sloup | 47,7 | 69,0 | |
| Smykový plech | 41,6 | 64,3 | |
| Výztužný plech | 43,5 | 64,0 | |
| Varianta 2 (5.1) | Nosník | 51,2 | 69,8 |
| Sloup | 51,9 | 73,6 | |
| Smykový plech | 41,6 | 64,3 | |
| Výztužný plech | 43,5 | 64,0 | |
| Varianta 3 (6.1) | Nosník | 49,8 | 68,9 |
| Sloup | 48,8 | 72,9 | |
| Smykový plech | 41,6 | 64,3 | |
| Výztužný plech | 43,5 | 64,0 | |
| Varianta 4 (7.1) | Nosník | 41,8 | 63,6 |
| Sloup | 48,3 | 70,6 | |
| Smykový plech | 51,6 | 73,4 | |
| Výztužný plech | 44,7 | 68,5 |
Podle experimentálních zkoušek začala styčníková zóna základního modelu klouznout při cyklech driftu 0,75 %. Plastifikace pásnic nosníku začala při cyklech driftu 1 % a při druhém cyklu driftu 3 % bylo pozorováno odtržení pásnice nosníku (viz obrázek 4.4). Podobně bylo první smykové plastifikování pozorováno ve styčníkové zóně varianty 1 při cyklech driftu 0,5. Plastifikování styčníkové zóny se rozšiřovalo během cyklů driftu 1,5. Při cyklech driftu 3 % vznikl v této zóně plastický kloub a bylo pozorováno porušení v k-zóně sloupu (viz obrázek 4.5). U varianty 2 bylo uvedeno, že styčníková zóna začala plastifikovat při cyklech driftu 1 % a v dalších cyklech se plastifikování rozšiřovalo. Při cyklech driftu 2 % plastifikovaly pásnice nosníku. Při cyklech driftu 3 % vznikly v pásnicích nosníku malé trhliny a při prvním cyklu driftu 4 % bylo pozorováno porušení horní pásnice nosníku (viz obrázek 4.6).
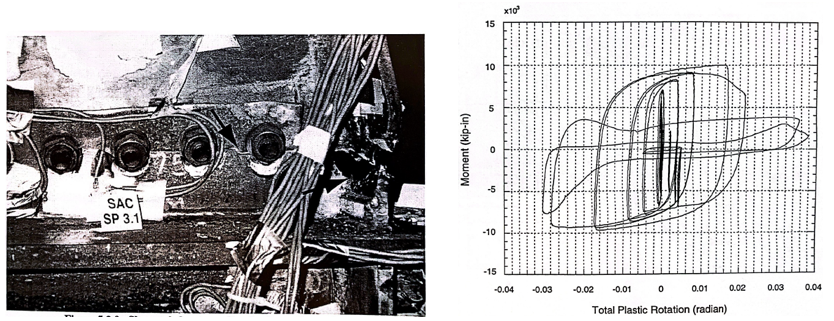
Obrázek 4.4: Vlevo) Základní model po zkoušce; Vpravo) závislost momentu na celkové plastické rotaci (Lee et al., 1999)
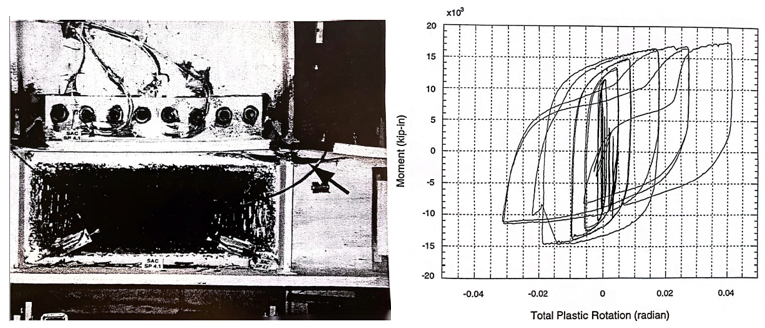
Obrázek 4.5: Vlevo) Varianta 1 po zkoušce; Vpravo) závislost momentu na celkové plastické rotaci (Lee et al., 1999)
Obrázek 4.6: Vlevo) Varianta 2 po zkoušce; Vpravo) závislost momentu na celkové plastické rotaci (Lee et al., 1999)
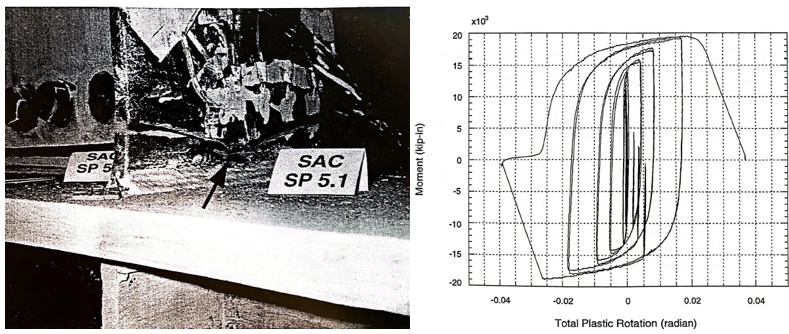
Na rozdíl od prvních tří zkušebních vzorků se při zkoušce varianty 3 první plastifikování projevilo v pásnicích nosníku při cyklech driftu 1 % a malé trhliny v této oblasti byly pozorovány při cyklech driftu 1,5. Styčníková zóna začala plastifikovat při cyklech driftu 2 % a při cyklech driftu 2 % bylo pozorováno houževnaté trhání horní pásnice nosníku (viz obrázek 4.7).
Obrázek 4.7: Vlevo) Varianta 3 po zkoušce; Vpravo) závislost momentu na celkové plastické rotaci (Lee et al., 1999)
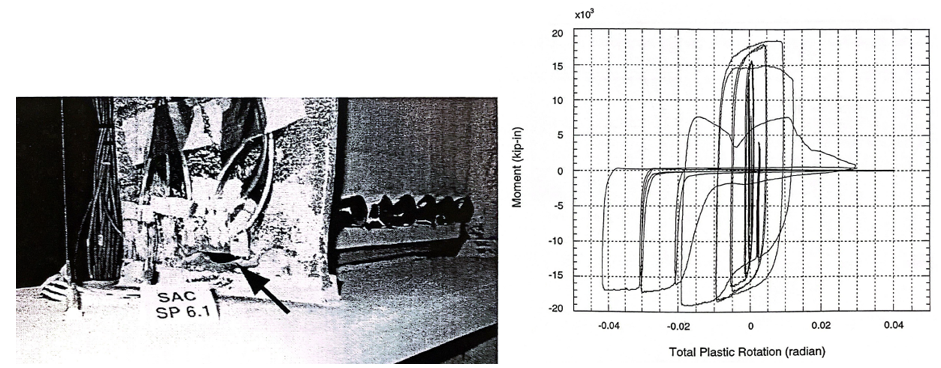
U varianty 4 bylo ve zkušební zprávě uvedeno, že první plastifikování nastalo ve styčníkové zóně při cyklech driftu 0,75. Pásnice nosníku plastifikovaly při cyklech driftu 1 % a malé trhliny byly pozorovány v blízkosti otvoru pro přístup ke svaru pásnic nosníku při cyklech driftu 2 %. Porušení pásnic nosníku bylo pozorováno při cyklech driftu 3 % (viz obrázek 4.8).
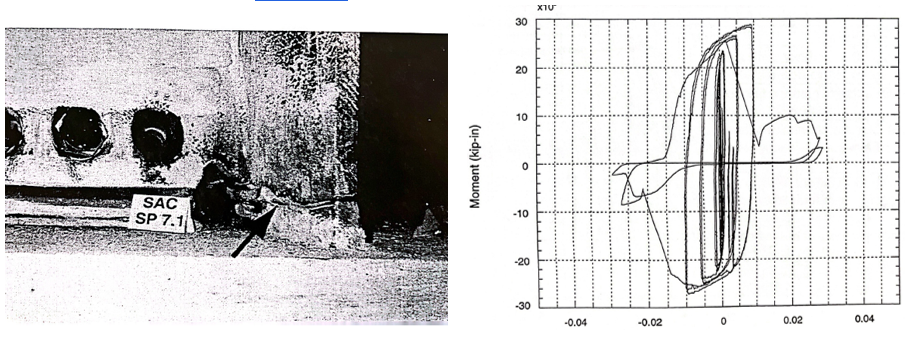
Obrázek 4.8: Vlevo) Varianta 4 po zkoušce; Vpravo) závislost momentu na celkové plastické rotaci (Lee et al., 1999)
4.3 Výpočty podle normy
Normová posouzení byla provedena a byly stanoveny způsoby porušení pro momentové přípoje WUF-W v souladu s požadavky AISC 341 (2016) a AISC 360 (2016). Podle oddílu D.2 normy AISC 341 lze šroubované přípoje s minimálním součinitelem skluzu 0,30 navrhovat jako předepnuté přípoje s únosností v otlačení. Protože předběžná analýza testovaných vzorků provedená pomocí IDEA StatiCa ukázala, že rozhodujícím mezním stavem je únosnost šroubů ve spoji s kritickým skluzem pro základní model, variantu 2 a variantu 3, byly z těchto testovaných přípojů vyvinuty tři další varianty změnou typu šroubů ze šroubů s kritickým skluzem (SC) na šrouby s únosností v otlačení se závity vyloučenými ze smykové roviny. Tři nově vyvinuté vzorky byly pojmenovány přidáním „.X" k původním názvům uvedeným v tabulce 4.2 (např. základní model.X z základního modelu), zatímco názvy tří testovaných vzorků byly aktualizovány přidáním „.SC" k jejich původním názvům (např. základní model.SC z základního modelu, viz tabulka 4.3 pro aktualizované názvy).
Pro momentové přípoje WUF-B byly z AISC 341 (2016) a AISC 360 (2016) identifikovány následující normové posudky.
- Otvor pro přístup ke svaru (AWS (2016) D1.8/D1.8M)
- Posouzení ohybové únosnosti sloupu (AISC 360 (2016), Eq. F2-1)
- Posouzení smykové únosnosti styčníkové zóny (AISC 341 (2016), J10-11)
- Posouzení požadavků na výztužné plechy (AISC 341 (2016), Sec. E3.6f)
- Posouzení smykového plastifikování nosníku (AISC 360 (2016), Eq. J4-3)
- Posouzení únosnosti svaru mezi smykovou zarážkou a sloupem (AISC 360 (2016), Eq. J4-2)
- Posouzení smykové únosnosti šroubů (AISC 360 (2016), Eq. J3-6a)
- Posouzení přípoje pásnice nosníku k pásnici sloupu (AISC 341 (2016), Sec E1.6)
- Otvor pro přístup ke svaru (AWS (2016) D1.8/D1.8M)
Protože únosnost šroubů testovaných vzorků nebyla měřena a ve zprávě není uvedena, bylo předpokládáno, že šrouby A325 s kritickým skluzem mají povrchy třídy A se součinitelem skluzu 0,3, a pro jmenovitou tahovou pevnost (\(f_{nt} = 90\) \(ksi\)) a smykovou pevnost (\(f_{nv} = 68\) \(ksi\)) šroubů A325 s únosností v otlačení byly použity jmenovité hodnoty uvedené v tabulce J3 AISC. Přehled normových posudků je uveden v tabulce 4.3.
Tabulka 4.3: Normové posudky pro momentové přípoje WUF-W
| Normové posudky AISC | Základní model.SC | Varianta 1 | Varianta 2.SC | Varianta 3.SC | Varianta 4 | Základní model.X | Varianta 2.X | Varianta 3.X |
| Ohybová únosnost nosníku | OK | OK | OK | OK | OK | OK | OK | OK |
| Ohybová únosnost sloupu | OK | OK | OK | OK | OK | OK | OK | OK |
| Smyková únosnost šroubů | Not OK | Not OK | Not OK | Not OK | OK | OK | OK | OK |
| Smyková únosnost styčníkové zóny | Not OK | Not OK | OK | OK | OK | Not OK | OK | OK |
| Smyková únosnost nosníku | OK | OK | OK | OK | OK | OK | OK | OK |
| Únosnost svaru mezi smykovou zarážkou a sloupem | OK | OK | OK | OK | OK | OK | OK | OK |
| Přípoj pásnice nosníku k pásnici sloupu | OK | OK | OK | OK | OK | OK | OK | OK |
| Požadavky na výztužné plechy | Not OK | Not OK | Not OK | Not OK | Not OK | Not OK | Not OK | Not OK |
| Požadavky na otvor pro přístup ke svaru | Not OK | Not OK | Not OK | Not OK | Not OK | Not OK | Not OK | Not OK |
Způsob porušení vzorků lze předpovědět výpočtem únosnosti následujících mezních stavů a určením rozhodujícího z nich porovnáním s požadovanou únosností vypočtenou ze statické analýzy reprezentující podmínky zkušebního uspořádání:
- Plastická ohybová únosnost sloupu
- Plastická ohybová únosnost nosníku
- Ohybová únosnost odpovídající kapacitě nepružné smykové únosnosti styčníkové zóny
Plastická momentová únosnost nosníku a sloupu v místě plastického kloubu (\(M_{by@ph}\) a (\(M_{cy@ph}\)) se vypočítá takto:
\(M_{b@ph}\) = \(F_{yb}Z_{bx}\) (4.1)
\(M_{b@ph}\) = \(F_{yc}Z_{cx}\) (4.2)
kde \(F_{yb}\) je mez kluzu nosníku, \(Z_{bx}\) je plastický průřezový modul nosníku, \(F_{yc}\) je mez kluzu sloupu a \(Z_{cx}\) je plastický průřezový modul sloupu. Nepružná smyková únosnost styčníkové zóny, \(R_{npz}\), se vypočítá za předpokladu, že požadovaná osová síla ve sloupu je menší nebo rovna 75 % jeho osové meze kluzu v souladu s oddílem J10 normy AISC 360 (2016) takto:
\(R_{npz} = (1.0)(0.6)F_{yc}d_{c}t_{cw}(1+\frac{{3b_{cf}t_{cf}}^2}{d_{c}d_{b}t_{cw}})\) (4.3)
kde \(d_{c}\) je výška sloupu, \(t_{cw}\) je tloušťka stojiny sloupu, \(b_{cf}\) je šířka pásnice sloupu, \(t_{cf}\) je tloušťka pásnice sloupu, \(d_{b}\) je výška nosníku.
Ohybová únosnost styčníkové zóny v ose sloupu, \(M_{npz}\), lze vypočítat uvažováním smykové síly v patře sloupu působící v opačném směru, jak je znázorněno na obrázku 4.9, takto:
\(M_{npz} = (R_{npz} + V_{c})(d_{b} - t_{bf})\) (4.4)
kde \(V_{c}\) je smyková síla ve sloupu, \(d_{b}\) je výška nosníku, \(t_{bf}\) je tloušťka pásnice nosníku. Ohybová únosnost styčníkové zóny v líci sloupu, \(M_{npz@foc}\), lze vypočítat odečtením přídavného momentu od svislého zatížení od líce sloupu k ose sloupu takto:
\(M_{npz@foc} = M_{npz} - V_{grav}\frac{d_{c}}{2}\)
kde \(V_{grav}\) je svislá síla v místě plastického kloubu nosníku.
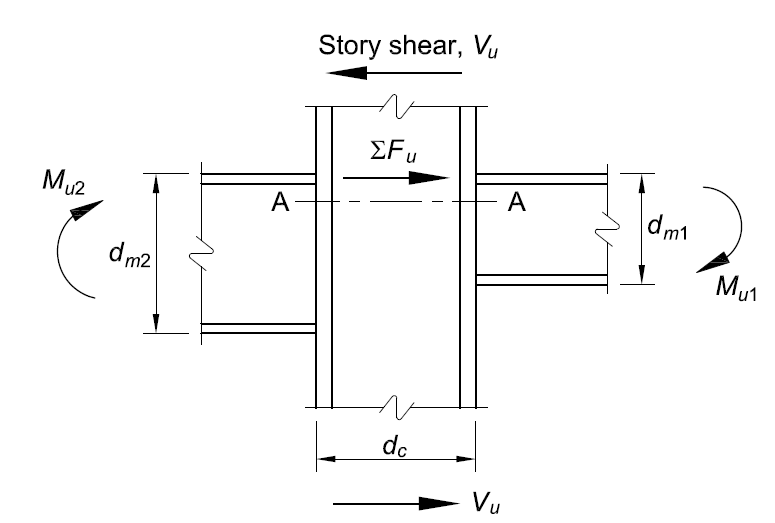
Obrázek 4.9: Síly ve styčníkové zóně (AISC 360, 2016)
Pro výpočet odezvy vzorků byl vytvořen model v SAP2000 reprezentující zkušební uspořádání. Předpokládá se, že podpory sloupu jsou kloubové přípoje. Pro základní model jsou vytvořený model v SAP2000 a vypočtený diagram momentů odpovídající svislému zatížení 10 kips na konci nosníku znázorněny na obrázku 4.10.
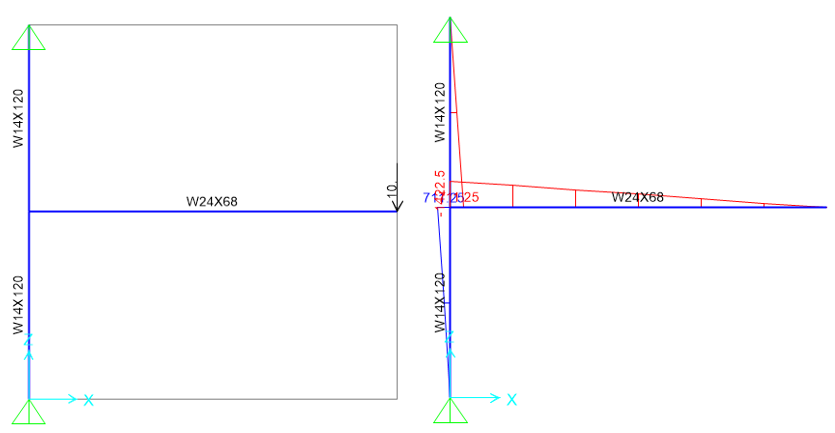
Obrázek 4.10: Vlevo) Model SAP2000; Vpravo) Diagram momentů
Momentové odezvy nosníku a sloupu v jejich osách (\(M_{bu@cc}\) a \(M_{cu@cc}\)) byly získány z modelu SAP2000 a odpovídající hodnoty momentů v lících prvků (tj. \(M_{bu@foc}\) a \(M_{cu@foc}\)) byly vypočteny takto:
\(M_{bu@foc} = (M_{bu@cc} - V_{ub})\frac{d_{b}}{2}\) (4.5)
\(M_{cu@foc} = (M_{cu@cc} - V_{uc})\frac{d_{c}}{2}\) (4.6)
kde \(V_{ub}\) je vypočtená smyková síla v nosníku a \(V_{uc}\) je vypočtená smyková síla ve sloupu. Předpokládá se, že plastický kloub v nosníku vzniká v líci sloupu a plastický kloub ve sloupu vzniká v líci nosníku. Vypočtené ohybové únosnosti styčníkové zóny a nosníku v líci sloupu (tj. \(M_{npz@foc}\) a \(M_{b@ph}\)) a ohybová únosnost sloupu v líci nosníku (\(M_{c@ph}\)) jsou uvedeny v tabulce 4.4. Dále byla pro každý přípoj provedena analýza v SAP2000 tak, aby nosník dosáhl své plastické momentové únosnosti vlivem přiložené smykové síly na konci nosníku reprezentující aktuátor. Vypočtené momentové odezvy sloupu a nosníku v lících prvků (tj. \(M_{cu@foc}\), \(M_{bu@foc}\)) jsou rovněž uvedeny v tabulce 4.4. Tyto hodnoty byly vzájemně porovnány a byl stanoven rozhodující mezní stav.
Tabulka 4.4: Přehled výpočtů únosností
| Číslo vzorku | \(M_{b@ph}\) [kip-in] | \(M_{c@ph}\) [kip-in] | \(M_{npz@foc}\) [kip-in] | \(M_{bu@foc}\) [kip-in] | \(M_{cu@foc}\) [kip-in] | Rozhodující mezní stav [kip-in] |
| Základní model.SC | 8 036 | 9 752 | 7 410 | 8 036 | 3 537 | 7 410 |
| Varianta 1 | 15 974 | 12 402 | 11 831 | 15 974 | 6 687 | 11 831 |
| Varianta 2.SC | 15 974 | 16 608 | 16 676 | 15 974 | 6 697 | 15 974 |
| Varianta 3.SC | 15 538 | 23 766 | 25 934 | 15 538 | 6 541 | 15 538 |
| Varianta 4 | 24 286 | 23 522 | 30 938 | 24 286 | 9 670 | 24 286 |
| Základní model.X | 8 036 | 9 752 | 7 410 | 8 036 | 3 537 | 7 410 |
| Varianta 2.X | 15 974 | 16 608 | 16 676 | 15 974 | 6 697 | 15 974 |
| Varianta 3.X | 15 538 | 23 766 | 25 934 | 15 538 | 6 541 | 15 538 |
Způsoby porušení základního modelu.SC, varianty 1 a základního modelu.X jsou dány únosností styčníkové zóny, zatímco plastická ohybová únosnost nosníku je rozhodujícím mezním stavem pro zbývající vzorky.
4.4 Analýza v IDEA StatiCa
Osm momentových přípojů WUF-B popsaných v předchozí části bylo modelováno v IDEA StatiCa za účelem simulace chování experimentů. Naměřené materiálové vlastnosti z tahových zkoušek vzorků uvedené v Lee et al. (1999) byly použity v softwaru IDEA StatiCa a součinitele únosnosti byly nastaveny na hodnotu 1,0. Pomocí typu analýzy napětí-přetvoření v IDEA StatiCa (tj. EPS) byly stanoveny momentové únosnosti a způsoby porušení přípojů. Pro základní model byl výpočet závislosti moment-rotace proveden pomocí typu analýzy tuhosti přípoje (tj. ST) v softwaru IDEA StatiCa.
4.4.1 Analýza základního modelu.SC
Model IDEA StatiCa byl vytvořen pro základní model.SC s použitím naměřených materiálových vlastností (tabulka 4.2). Součinitele nadpevnosti \(R_{y}\) a \(F_{t}\) a všechny součinitele únosnosti LRFD byly nastaveny na hodnotu 1,0. Pro získání zatížení v ose sloupu byl v SAP2000 vytvořen rámový model nosník-sloup s délkami sloupu a nosníku odpovídajícími zkušebnímu uspořádání (viz obrázek 4.10). Na obou koncích sloupu byly přiřazeny kloubové přípoje a ve vzdálenosti 134,9 in. od líce sloupu byla přiložena smyková síla 10 kips. Vypočtené uzlové síly byly přiloženy k modelu IDEA StatiCa v poloze nosníku rovné nule (osa sloupu) zapnutím možnosti „zatížení v rovnováze". Pro výpočet únosnosti bylo zatížení postupně zvyšováno, dokud nebylo dosaženo některé z následujících podmínek:
- 5% plastické přetvoření v plechách (nosník, sloup, smyková zarážka, výztužný plech)
- 100% únosnosti šroubů
- 100% únosnosti svarů
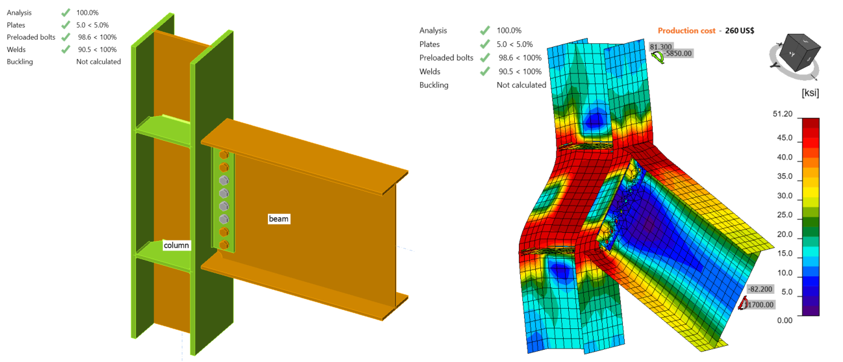
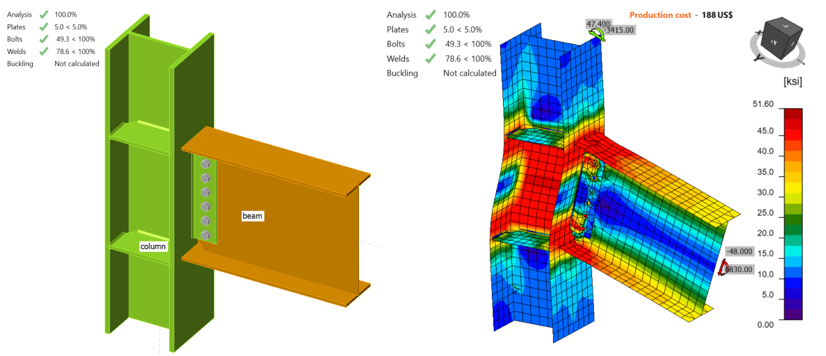
Když smyková síla a odpovídající moment dosáhly hodnot 47,60 kips a 6 770 kips-in., bylo dosaženo únosnosti šroubů a vypočtené průměrné plastické přetvoření v pásnicích nosníku je 3,2 % (obrázek 4.11). Pomocí analýzy „ST" byla vypočtena závislost moment-rotace, která je znázorněna na obrázku 4.12. Je třeba poznamenat, že v analýze „ST" je sloup na obou koncích vetknut, což může vést k rozdílům mezi ohybovou únosností získanou analýzou „EPS" se zatížením v rovnováze.
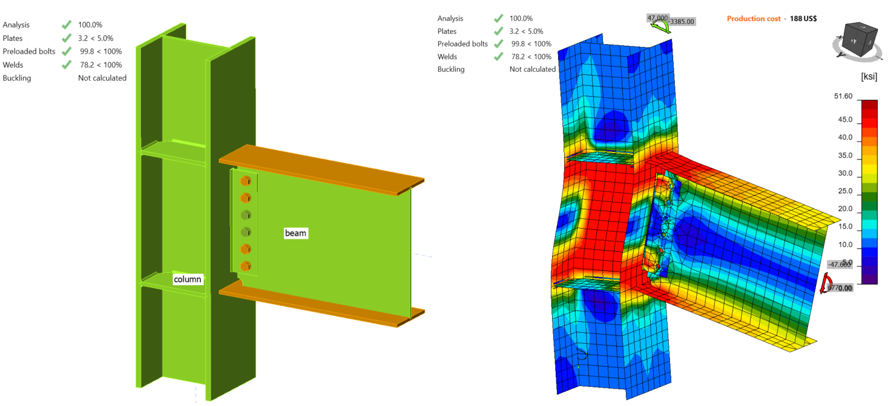
Obrázek 4.11: Model IDEA StatiCa pro základní model.SC při momentu 6 770 kips-in.
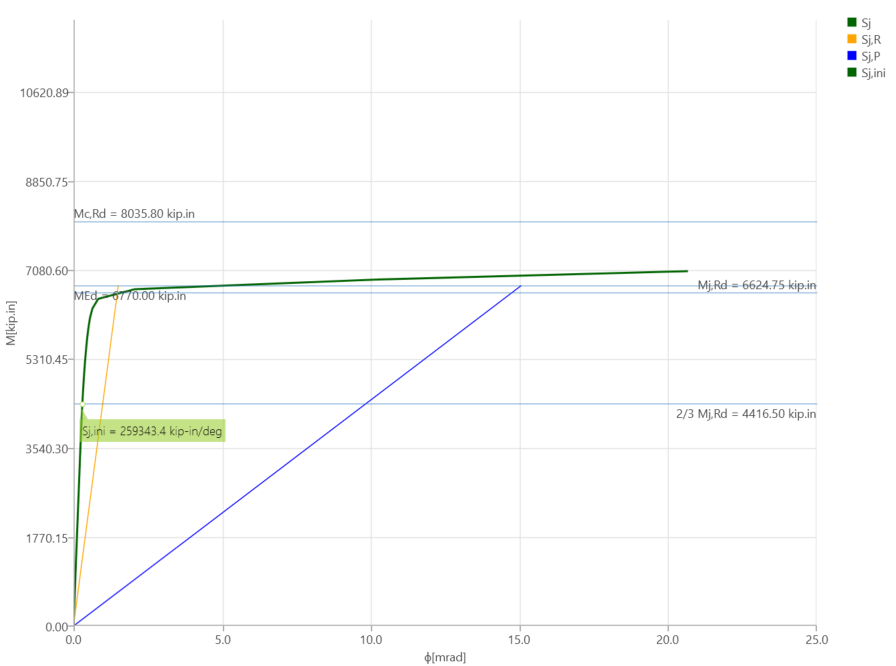
Obrázek 4.12: Závislost moment-rotace pro základní model.SC
4.4.2 Analýza varianty 1
Podle stejného postupu popsaného pro základní model.SC byl vytvořen model IDEA StatiCa pro variantu 1 se šrouby s kritickým skluzem. Z postupného zatěžování bylo zjištěno, že když smyková síla a odpovídající moment dosáhly hodnot 82,20 kips a 11 700 kips-in., stojina nosníku dosáhla limitu 5% plastického přetvoření, přičemž v pásnicích nosníku a stojině sloupu bylo dosaženo plastického přetvoření 4,6 % a 4,0 % (obrázek 4.13).
Obrázek 4.13: Model IDEA StatiCa pro variantu 1 při momentu 11 700 kips-in.
4.4.3 Analýza varianty 2.SC
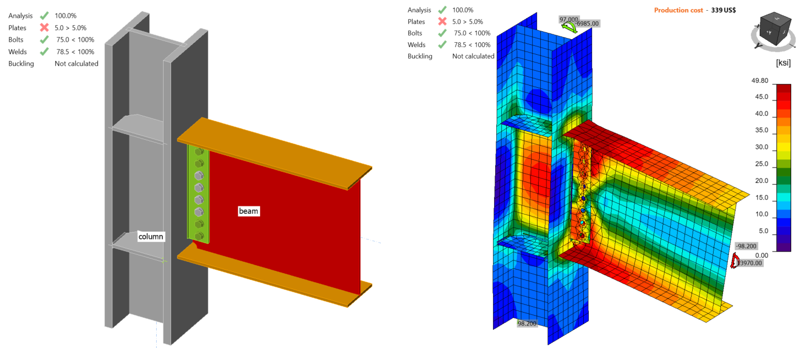
Podle stejného postupu popsaného v předchozích dvou částech byla provedena analýza v IDEA StatiCa pro variantu 2.SC. Bylo zjištěno, že únosnosti šroubů bylo dosaženo při smykové síle a odpovídajícím momentu 90,0 kips a 12 800 kips-in. (obrázek 4.14).
Obrázek 4.14: Model IDEA StatiCa pro variantu 2 při momentu 12 800 kips-in.
4.4.4 Analýza varianty 3.SC
Podle stejného postupu byla ohybová únosnost varianty 3.SC získána pomocí IDEA StatiCa. Když smyková síla a odpovídající moment dosáhly hodnot 87,90 kips a 12 500 kip-in., bylo dosaženo únosnosti šroubů s kritickým skluzem (obrázek 4.15).
Obrázek 4.15: Model IDEA StatiCa pro variantu 3 při momentu 12 500 kips-in.
4.4.5 Analýza varianty 4
Analýza v IDEA StatiCa byla provedena pro variantu 4 podle stejného postupu. Analýza v IDEA StatiCa ukázala, že limitu 5% plastického přetvoření bylo dosaženo ve stojině nosníku a 3,8% plastické přetvoření bylo vypočteno v horní pásnici nosníku při dosažení smykové síly 156,60 kips a odpovídajícího momentu 22 270 kips-in. (obrázek 4.16).
Obrázek 4.16: Model IDEA StatiCa pro variantu 4 při momentu 22 270 kips-in.
4.4.6 Analýza základního modelu.X
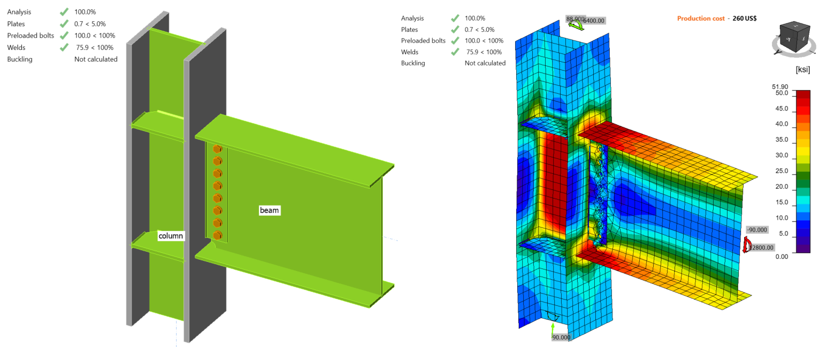
Model IDEA StatiCa pro základní model.X byl vytvořen ze základního modelu.SC změnou typu šroubů ze šroubů s kritickým skluzem na šrouby s únosností v otlačení. Byl dodržen stejný postup a byla vypočtena ohybová únosnost vzorku. Bylo zjištěno, že 5% plastické přetvoření bylo vypočteno v horní pásnici nosníku při dosažení smykové síly 48,00 kips a odpovídajícího momentu 6 830 kip-in. (viz obrázek 4.17). To je o XX % více než u základního modelu.SC.
Obrázek 4.17: Model IDEA StatiCa pro základní model.X při momentu 6 830 kips-in.
4.4.7 Analýza varianty 2.X
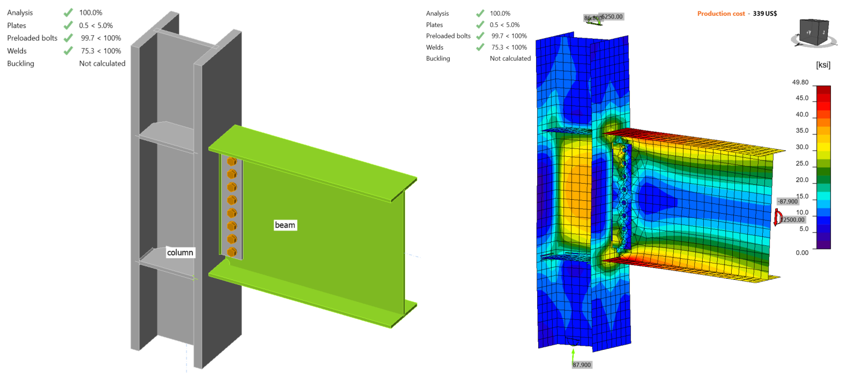
Model IDEA StatiCa pro variantu 2.X byl vytvořen z varianty 2.SC změnou typu šroubů. Bylo zjištěno, že 5% plastické přetvoření bylo dosaženo v horní stojině nosníku při přiložení smykové síly 97,00 kips a odpovídajícího momentu 13 800 kip-in. (viz obrázek 4.18). Dále bylo v horní pásnici nosníku vypočteno plastické přetvoření 4,8 %. To je o XX % více než u modelu 2.SC.
Obrázek 4.18: Model IDEA StatiCa pro variantu 2.X při momentu 13 800 kips-in.
4.4.8 Analýza varianty 3.X
Model IDEA StatiCa pro variantu 3.X byl vytvořen z varianty 3.SC podle stejných kroků popsaných v předchozích dvou částech. Bylo zjištěno, že limitu 5% plastického přetvoření bylo dosaženo ve stojině nosníku, přičemž v horní pásnici nosníku bylo vypočteno plastické přetvoření 4,9 %, když smyková síla a odpovídající moment dosáhly hodnot 98,20 kips a 13 970 kip-in. (viz obrázek 4.19). To je o XX % více než u modelu 3.SC.
Obrázek 4.19: Model IDEA StatiCa pro variantu 3.X při momentu 13 970 kips-in.
Osm momentových přípojů WUF-W bylo analyzováno pomocí IDEA StatiCa a jejich momentové únosnosti v ose sloupu byly vypočteny. Momentové únosnosti v líci sloupu byly vypočteny pomocí rovnice 4.7 a jsou uvedeny v tabulce 4.5.
\(M_{y@foc} = M_{y@cc} - V\frac{d_{c}}{2}\) (4.7)
kde \(M_{y@foc}\) je momentová únosnost v líci sloupu, \(M_{y@cc}\) je momentová únosnost v ose sloupu, \(V\) je smyková síla a \(d_{c}\) je výška sloupu.
Tabulka 4.5: Momentové únosnosti vypočtené pomocí IDEA StatiCa
| Číslo vzorku | \(M_{y@cc}\) (kips-in.) | \(M_{y@foc}\) (kips-in.) |
| Základní model.SC | 6 770 | 6 425 |
| Varianta 1 | 11 700 | 11 091 |
| Varianta 2.SC | 12 800 | 12 116 |
| Varianta 3.SC | 12 500 | 11 779 |
| Varianta 4 | 22 270 | 20 986 |
| Základní model.X | 6 830 | 6 482 |
| Varianta 2.X | 13 800 | 13 063 |
| Varianta 3.X | 13 970 | 13 165 |
4.5. Analýza v ABAQUS
V této části byl základní model vyvinutý v části 4.4.1 znovu vytvořen pomocí softwaru ABAQUS (verze 2022) pro analýzu metodou konečných prvků a výsledky byly porovnány s IDEA StatiCa. CAD model pro analýzu metodou konečných prvků byl vygenerován pomocí platformy prohlížeče IDEA StatiCa. Šest šroubů a 28 svarových linií spojujících celou sestavu bylo následně přidáno ručně pomocí CAD rozhraní v ABAQUS. Svislé zatížení 47,6 kips a odpovídající moment 6 770 kips-in. (kolem osy Y) byly přiloženy k definovanému referenčnímu bodu (tj. RF1) v ose sloupu, jak je znázorněno na obrázku 4.20. Analytická délka sloupu v IDEA StatiCa je 175,95 in. Proto, aby byla v ABAQUS napodobena stejná délka sloupu, byly zavedeny dva další referenční body (tj. RF2 a RF3) ve vzdálenosti 87,975 in. od středu sloupu podél osy Z v obou směrech (viz obrázek 4.20). Tyto dva referenční body byly zafixovány ve všech směrech a byly propojeny s horní a dolní plochou sloupu pomocí modulu pro tvorbu konektorů v ABAQUS. Pro napodobení přenosu smykové síly třením v šroubech v IDEA StatiCa bylo v ABAQUS aplikováno předpínací zatížení podél osy každého dříku šroubu. V ABAQUS byla po standardní analýze citlivosti sítě zvolena velikost prvku v rozsahu 0,1–0,4 in. a v modelu bylo vygenerováno celkem 310 451 prvků. Jako typ prvku byl zvolen 3D napěťový, 8-uzlový lineární hexahedrální prvek se sníženou integrací (tj. C3D8R).
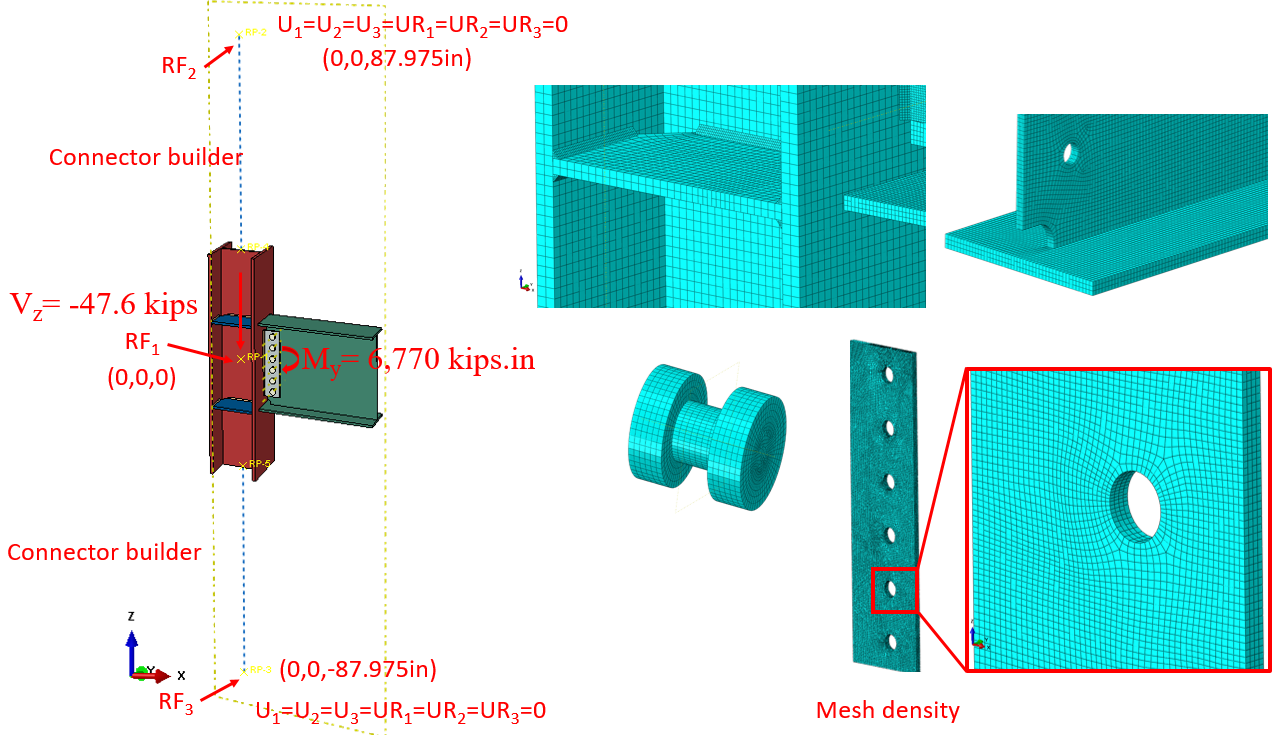
Obrázek 4.20: Nastavení modelu a hustota sítě v ABAQUS
Mezi svarovými liniemi a připojenými částmi bylo aplikováno vazební omezení (tie constraint). Chování materiálu bylo modelováno pomocí bilineární plasticity v ABAQUS. Ostatní parametry, včetně hustoty, modulu pružnosti a Poissonova součinitele, byly převzaty z knihovny materiálů IDEA StatiCa. Numerická simulace byla provedena na čtyřech procesorech (Intel Xenon ® CPU E5-2698 v4 @ 2,20 GHz) a trvala přibližně 270 minut. Obrázek 4.21 porovnává předpovězené napětí von Mises mezi IDEA StatiCa a ABAQUS.
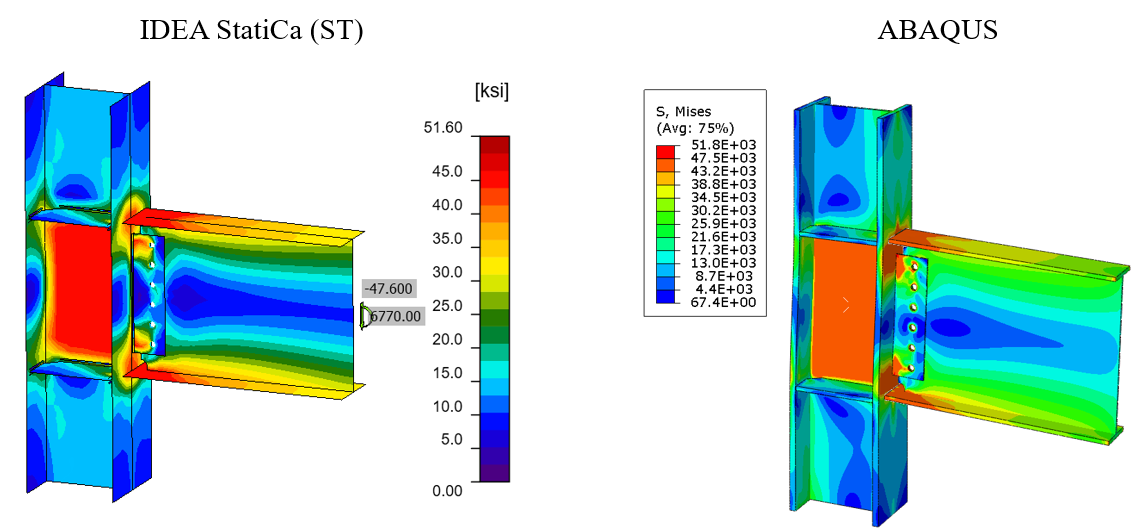
Obrázek 4.21: Porovnání vypočteného napětí von Mises mezi modely IDEA StatiCa a ABAQUS
Maximální předpovězené napětí v IDEA StatiCa bylo 46,2 ksi ve stojině sloupu (poznámka: legenda IDEA StatiCa zobrazuje návrhové hodnoty), zatímco model ABAQUS vykazuje maximální napětí 46,8 ksi ve stejném místě. Maximální napětí 51,8 ksi v legendě ABAQUS náleží přední svarové linii spojující smykovou zarážku se sloupem. Mírně odlišné rozložení napětí je pravděpodobně způsobeno zohledněním délky sloupu v ABAQUS a způsobem aplikace okrajových podmínek, použitím jemnější sítě v analýze metodou konečných prvků a zjednodušeným CAD modelem v IDEA StatiCa. Je třeba poznamenat, že autoři provedli standardní analýzu citlivosti sítě pro model IDEA StatiCa a byly pozorovány určité nesrovnalosti ve výsledcích.
Maximální vypočtené plastické přetvoření v IDEA StatiCa a ABAQUS bylo 2,3 % a 2,9 % (obě hodnoty na horní pásnici nosníku). Dále oblast plastické deformace předpovězená IDEA StatiCa odpovídala mapě plastifikování vypočtené v ABAQUS (tj. spodní řada na obrázku 4.22). Výsledky ABAQUS navíc ukazují, že šrouby také vykazovaly plastické deformace.
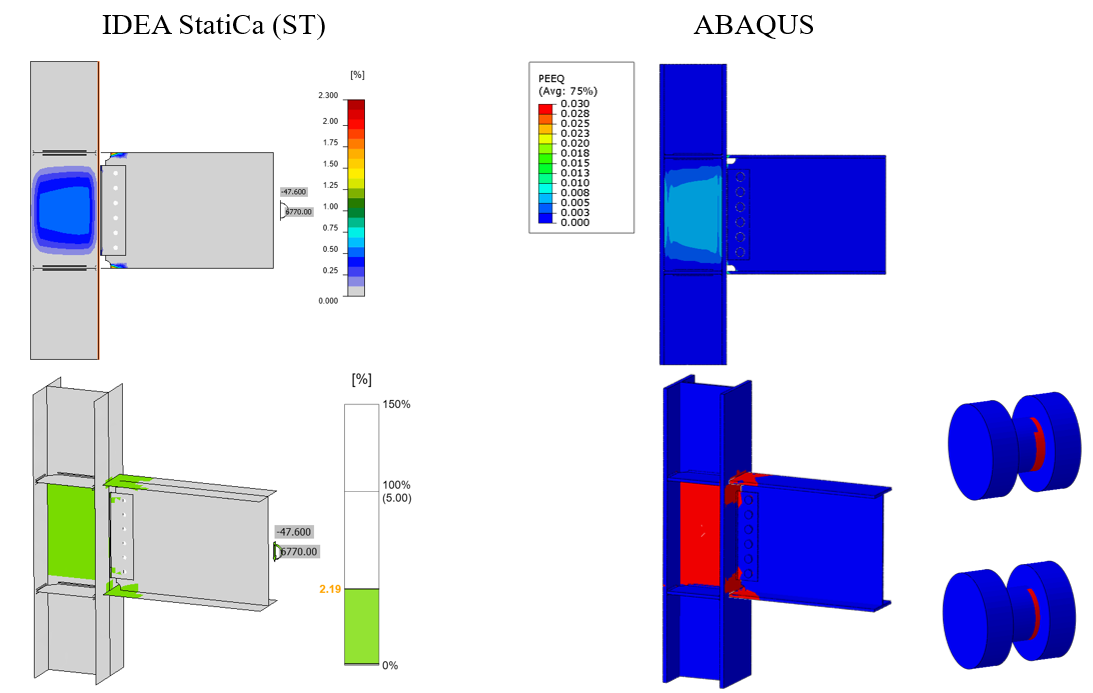
Obrázek 4.22: Horní řada) Porovnání vypočteného plastického přetvoření mezi modely IDEA StatiCa a ABAQUS; spodní řada) Porovnání mapy plastifikování mezi IDEA StatiCa a ABAQUS
Obrázek 4.23 znázorňuje porovnání křivky moment-rotace mezi oběma softwary vzhledem k ose sloupu. Je třeba poznamenat, že na obrázku 4.23 byla pro získání celkové rotace pomocí IDEA StatiCa (znázorněna přerušovanou oranžovou čarou) vypočtena lineární rotace nosníku v ose sloupu pomocí SAP2000 a poté přičtena k výchozí křivce plastické rotace reportované IDEA StatiCa (znázorněna plnou oranžovou čarou). Oba modely poskytují srovnatelné odhady počáteční tuhosti. Menší nesoulad může být spojen s rozdílem v typech prvků (tj. objemový prvek v ABAQUS oproti skořepinového prvku v IDEA StatiCa) a použitím vazebního omezení v ABAQUS pro reprezentaci svarů.
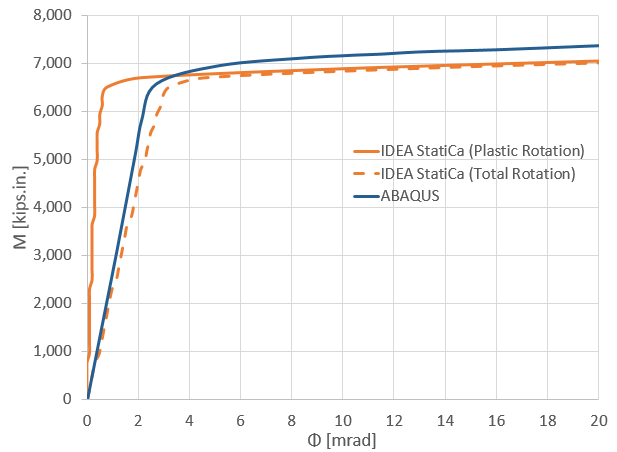
Obrázek 4.23: Porovnání závislosti moment-rotace mezi IDEA StatiCa a ABAQUS
4.6 Shrnutí a porovnání výsledků
Osm momentových přípojů WUF-B bylo zkoumáno pomocí IDEA StatiCa a postupem návrhu dle AISC. Dále byly výsledky ze základního modelu IDEA StatiCa (tj. SC) porovnány s výsledky z ekvivalentního modelu ABAQUS.
Při zkoušce základního modelu.SC došlo k porušení vzorku odtržením pásnice nosníku, zatímco rozhodující mezní stav vypočtený postupem AISC je únosnost styčníkové zóny, která je o 8 % nižší než únosnost nosníku. Analýza IDEA StatiCa pro základní model.SC vypočítala způsob porušení jako únosnost šroubů při skluzu. Na druhou stranu model IDEA StatiCa základního modelu.X vykazoval porušení v důsledku pásnice nosníku, protože typ šroubů byl změněn z šroubů s kritickým skluzem na šrouby s únosností v otlačení, jak norma AISC 341 pro momentové přípoje umožňuje. Dále byla vypočtená závislost moment-plastická rotace pomocí IDEA StatiCa porovnána s křivkou uvedenou ve zkušební zprávě, jak je znázorněno na obrázku 4.24.
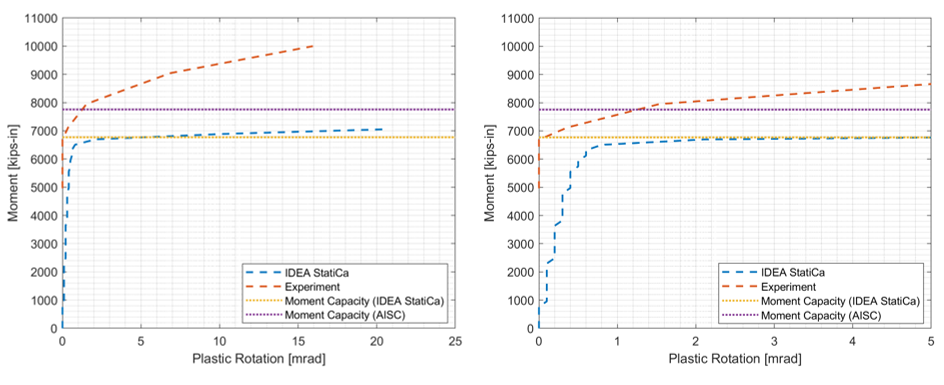
Obrázek 4.24: Porovnání závislosti moment-rotace pro základní model.SC s přiblíženým pohledem vpravo
U varianty 1 je ve zkušební zprávě uvedeno, že plastický kloub vznikl ve styčníkové zóně. Stejný způsob porušení byl vypočten postupem AISC. Na druhou stranu analýza IDEA StatiCa ukázala, že vzorek dosáhl své únosnosti v důsledku stojiny nosníku s 5% plastickým přetvořením, přičemž ve styčníkové zóně bylo vypočteno 4% plastické přetvoření.
U varianty 2.SC bylo jako způsob porušení vzorku hlášeno porušení pásnice nosníku. Stejný způsob porušení byl vypočten postupem AISC. Model IDEA StatiCa pro variantu 2.SC ukázal, že způsobem porušení je únosnost šroubů při skluzu, zatímco analýza IDEA StatiCa provedená pro variantu 2.X vypočítala stejný způsob porušení jako zkouška a postup AISC.
U varianty 3.SC bylo při experimentu hlášeno houževnaté trhání. Stejný způsob porušení byl vypočten postupem AISC. Model IDEA StatiCa pro variantu 3.SC ukázal, že bylo dosaženo únosnosti šroubů při skluzu, zatímco model vyvinutý pro variantu 3.X ukázal, že vzorek dosáhl své únosnosti v důsledku ohybové únosnosti nosníku, jak bylo pozorováno postupem AISC a při experimentu.
U varianty 4 vypočítaly zkušební pozorování, postup AISC i analýza IDEA StatiCa stejné způsoby porušení. Ohybová momentová únosnost podle IDEA StatiCa byla vypočtena jako 20 656 kips-in., zatímco postupem AISC byla vypočtena jako 24 286 kips-in. Vypočtené ohybové momentové únosnosti osmi vzorků pomocí IDEA StatiCa a postupem AISC jsou uvedeny na obrázku 4.25.
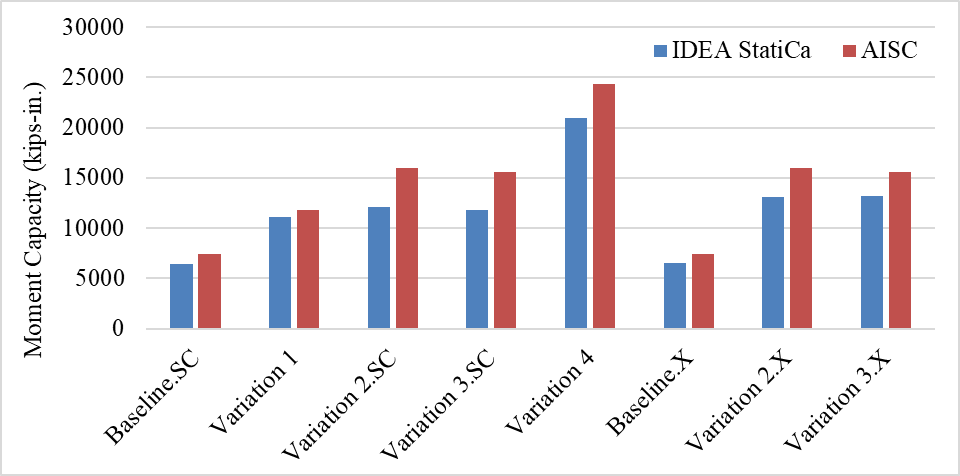
Obrázek 4.25: Momentové únosnosti vypočtené pomocí IDEA StatiCa a postupem AISC
Prosím doplňte komentáře na konci – např. IDEA StatiCa vykazuje konzistentně bezpečné výsledky ve srovnání s experimentálními výsledky a postupy AISC. Přestože jsou navrženy šrouby s kritickým skluzem, lze je v IDEA StatiCa posoudit jako šrouby s únosností v otlačení s využitím jejich únosnosti v otlačení po skluzu.
Přečtěte si celou studii o předkvalifikovaných přípojích!
Literatura
Lee, K. H., Stojadinovic, B., Goel, S. C., Margarian, A. G., Choi, J., Wongkaew, A., Reyher, B. P., and Lee, D. Y. (2002). Parametric Tests on Unreinforced Connections, Volume I-Final Report. SAC/BD-00/01.
AISC 360 (2016), "Specification for Structural Steel Buildings," American Institute of Steel Construction ANSI/AISC 360-16, Chicago, Illinois.
AISC 341 (2016), "Seismic Provisions for Structural Steel Buildings," American Institute of Steel Construction ANSI/AISC 341-16, Chicago, Illinois.
AWS D1.8/D1.8M (2016) Structural Welding Code—Seismic Supplement AWS B4.0:2007 Standard Methods for Mechanical Testing of Welds