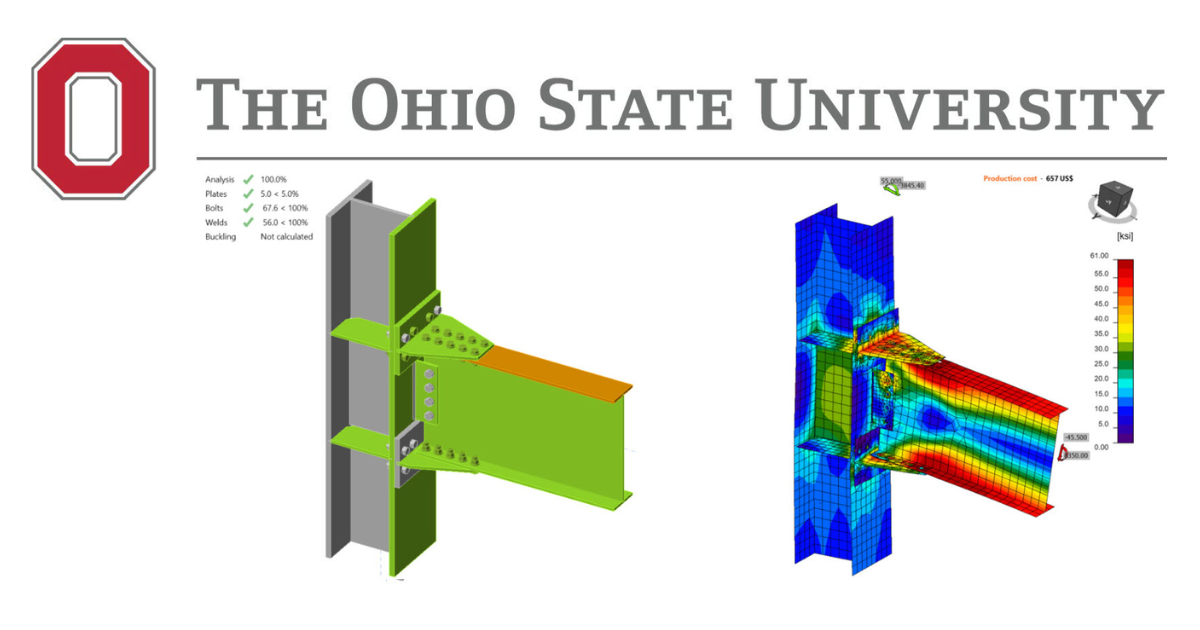
Přípoj s dvojitým T-profilem pro ohybový moment – předkvalifikovaný přípoj – AISC
Tento ověřovací příklad byl připraven v rámci společného projektu Ohio State University a IDEA StatiCa. Autoři jsou uvedeni níže:
- Baris Kasapoglu, doktorand
- Ali Nassiri, Ph.D.
- Halil Sezen, Ph.D.

5.1. Úvod
Posledním typem ocelového přípoje studovaným v tomto výzkumu je momentový přípoj s dvojitým T-profilem (viz obrázek 5.1). Přípoj s dvojitým T-profilem je předkvalifikovaný přípoj určený pro použití v seismických oblastech jako součást systémů IMF a SMF, pokud jsou splněny požadavky uvedené v AISC 358. V rámci této studie byl z literatury vybrán experimentální výzkum provedený pro přípoj s dvojitým T-profilem a jeho varianty, přičemž jejich ohybové únosnosti byly posouzeny podle návrhového postupu AISC i pomocí IDEA StatiCa. Základní model byl rovněž analyzován v softwaru ABAQUS a výsledky byly porovnány.
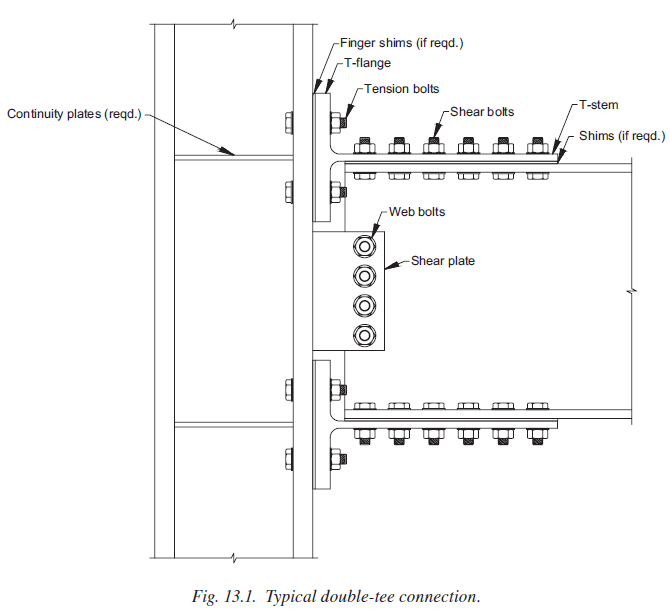
Obrázek 5.1: Typický momentový přípoj s dvojitým T-profilem (AISC 358)
V následujících kapitolách je popsán experimentální test, shrnuty normové posouzení AISC provedené pro dané vzorky a diskutovány výsledky numerické analýzy získané z IDEA StatiCa a ABAQUS. Na závěr jsou porovnány výsledky ze tří zdrojů (tj. zkoušky, návrhové postupy AISC a numerické analýzy).
5.2 Experimentální studie
Šest přípojů s dvojitým T-profilem v plném měřítku a 48 jednotlivých T-profilů bylo testováno na Georgia Institute of Technology Leonem (1999) v rámci projektu SAC Task 7.03. Hlavním cílem této studie bylo lépe porozumět chování šroubovaných přípojů při cyklickém zatížení a ověřit, zda lze výsledky zkoušek součástí v malém měřítku extrapolovat na přípoje v plném měřítku. V rámci této studie jsou shrnuty pouze podrobnosti a výsledky šesti zkoušek v plném měřítku. Pro další podrobnosti o experimentech jsou čtenáři odkázáni na Swanson (1999) a Smallidge (1999) a také na zkušební zprávu Leona (1999).
Všechny vzorky se skládají ze sloupu W14×145, přičemž nosník se liší od W21×44 do W24×55. Všechny spojovací prvky byly vysokopevnostní šrouby A490 řízené tahem s průměrem 7/8 palce nebo 1 palec. T-profily byly vyříznuty ze tří různých profilů s širokými přírubami (W16×45, W16×100 a W21×93). Pro všechny vzorky byl použit smykový plech tloušťky 3/8 palce s délkou 9 nebo 12 palců v závislosti na počtu šroubů. Ze šesti vzorků byl jeden vybrán jako základní model (ID zkoušky: FS-06) a zbývající byly studovány jako variantní modely (viz tabulka 5.1).
Tabulka 5.1: Vlastnosti vzorků s dvojitým T-profilem (Leon, 1999)
| Číslo vzorku (ID zkoušky) | Nosník | Sloup | T-profil | Šrouby |
| Základní model (FS-06) | W24×55 | W14×145 | W16×100 | 1 palec A490 |
| Varianta 1 (FS-03) | W21×44 | W14×145 | W16×45 | 7/8 palce A490 |
| Varianta 2 (FS-04) | W21×44 | W14×145 | W16×45 | 1 palec A490 |
| Varianta 3 (FS-05) | W24×55 | W14×145 | W16×100 | 7/8 palce A490 |
| Varianta 4 (FS-07) | W24×55 | W14×145 | W21×93 | 7/8 palce A490 |
| Varianta 5 (FS-08) | W24×55 | W14×145 | W21×93 | 1 palec A490 |
Zkušební sestava se skládá ze sloupu délky 152 palců (od kloubového uložení nahoře po kloubové uložení dole) a nosníku připojeného k přírubě sloupu ve výšce 82 palců nad dolní podporou sloupu. Délka nosníku od líce sloupu k aktuátoru byla 176 palců a boční ztužení bylo zajištěno ve vzdálenosti 5 stop od přípoje. Zkušební sestava je znázorněna na obrázku 5.2.
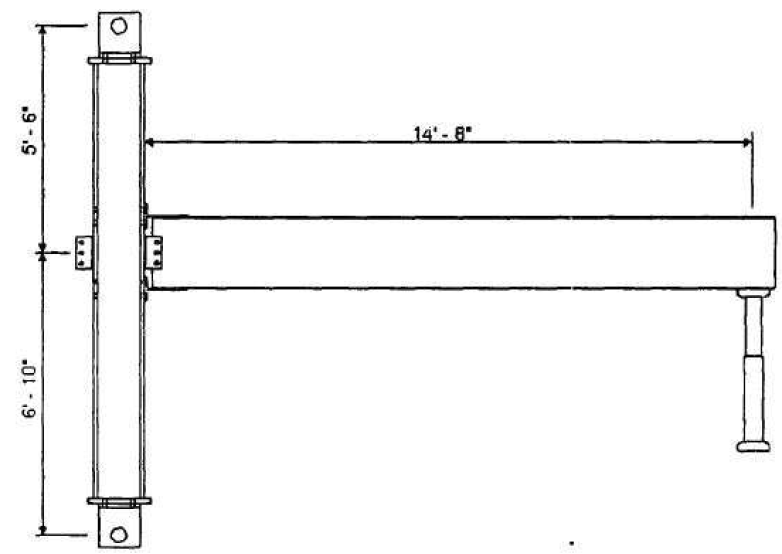
Obrázek 5.2: Zkušební sestava (Leon, 1999)
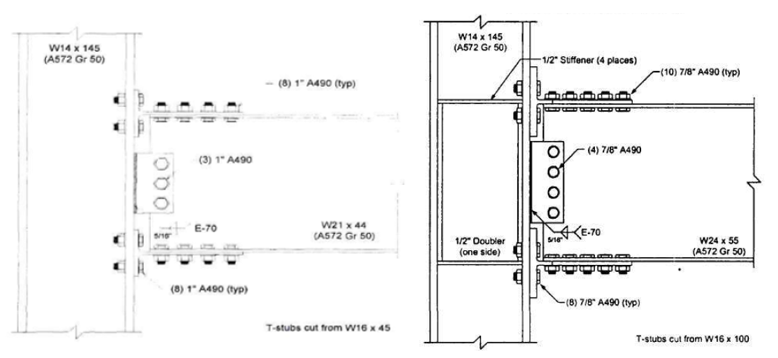
Základní model se skládá ze sloupu W14×145, nosníku W24×55 a dvou T-profilů vyříznutých z W16×100. V přírubách T-profilů je použito osm šroubů A490 průměru 1 palec namáhaných smykem a osm šroubů A490 průměru 1 palec namáhaných tahem. Čtyři šrouby A490 průměru 1 palec jsou použity k připevnění smykového plechu k stojině nosníku, přičemž smykový plech je přivařen k přírubě sloupu dvojitým koutovým svarem 5/16 palce. Dále jsou použity čtyři výztužné plechy tloušťky ½ palce a jednostranný zdvojovací plech tloušťky ½ palce, jak je znázorněno na obrázku 5.3.
Varianta 1 se skládá ze sloupu W14×145, nosníku W21×44 a dvou T-profilů vyříznutých z W16×45, které jsou použity k připevnění přírub nosníku a přírub sloupu pomocí osmi šroubů A490 průměru 7/8 palce namáhaných smykem a osmi šroubů A490 průměru 7/8 palce namáhaných tahem. Tři šrouby A490 průměru 7/8 palce jsou použity mezi smykovým plechem a stojinou nosníku a dvojitý koutový svar 5/16 palce je použit mezi lícem sloupu a smykovým plechem, jak je znázorněno na obrázku 5.3.
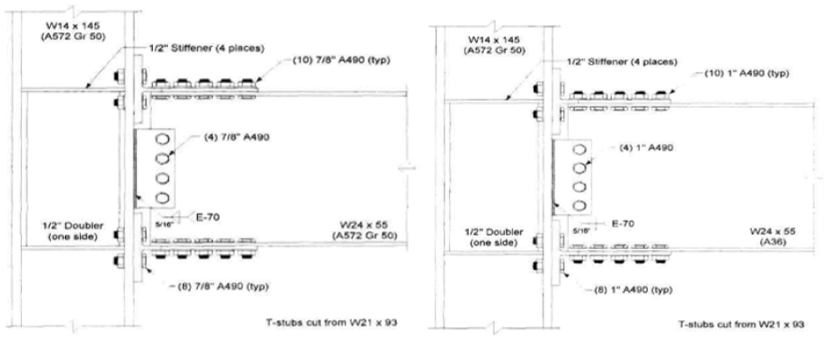
Varianta 2 se od varianty 1 liší použitím šroubů A490 průměru 1 palec. Všechny ostatní detaily jsou totožné s variantou 1. Konfigurace varianty 2 je znázorněna na obrázku 5.4. Varianta 3 se skládá ze sloupu W14×145, nosníku W24×55 a T-profilů vyříznutých z W16×100. V obou T-profilech je použito deset šroubů A490 průměru 7/8 palce namáhaných smykem a osm šroubů A490 průměru 7/8 palce namáhaných tahem. Čtyři šrouby A490 průměru 7/8 palce jsou použity k připevnění smykového plechu a stojiny nosníku, přičemž dvojitý koutový svar 5/16 palce je použit mezi přírubou sloupu a smykovým plechem. Čtyři výztužné plechy tloušťky ½ palce a jednostranný zdvojovací plech tloušťky ½ palce jsou použity k vyztužení styčníkového panelu sloupu. Rozdíly mezi základním modelem a variantou 3 spočívají v průměru šroubů a počtu smykových šroubů použitých k připevnění přírub T-profilů a přírub nosníku (viz obrázek 5.4).
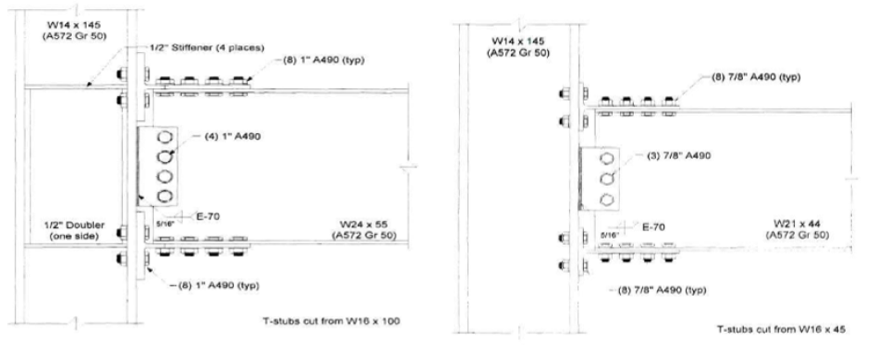
Obrázek 5.3: Vlevo) Konfigurace základního modelu; vpravo) konfigurace varianty 1 (Leon, 1999)
Obrázek 5.4: Vlevo) Konfigurace varianty 2; vpravo) konfigurace varianty 3 (Leon, 1999)
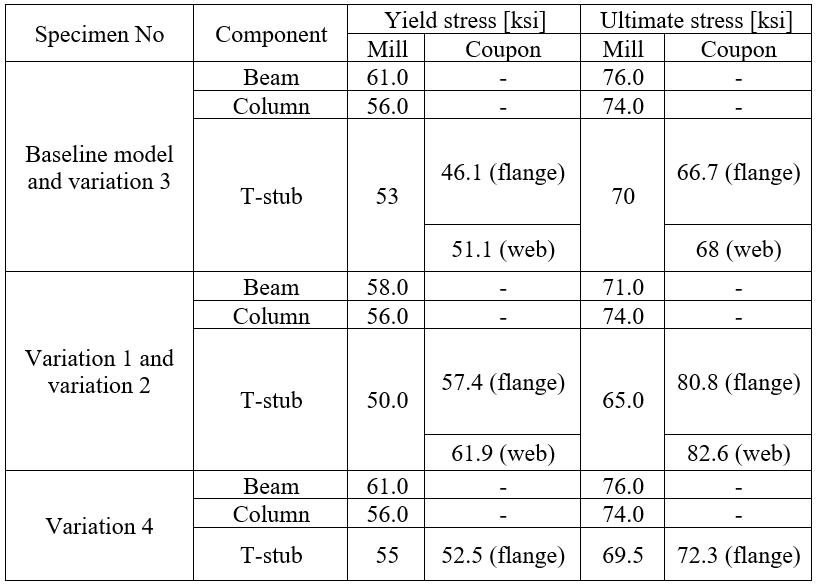
Varianta 4 se skládá z nosníku W24×55, T-profilů vyříznutých z W21×93 a čtyřšroubového smykového plechu. Deset smykových šroubů je použito k připevnění přírub T-profilů k přírubám nosníku a osm tahových šroubů na každém T-profilu k připevnění k líci sloupu. Styčníkový panel sloupu je vyztužen čtyřmi výztužnými plechy tloušťky ½ palce a jednostranným zdvojovacím plechem tloušťky ½ palce. Pro všechny spojovací prvky jsou použity šrouby A490 průměru 7/8 palce. Varianta 5 se od varianty 4 liší použitím větších šroubů průměru 1 palec. Všechny ostatní geometrické vlastnosti jsou totožné, jak je znázorněno na obrázku 5.5. Průměrné materiálové vlastnosti z tahových zkoušek vzorků a hutních atestů pro nosník, sloup a T-profily jsou uvedeny v tabulce 5.2.
Obrázek 5.5: Vlevo) Konfigurace varianty 4; vpravo) konfigurace varianty 5 (Leon, 1999)
Tabulka 5.2: Naměřené materiálové vlastnosti testovaných vzorků s dvojitým T-profilem (Leon, 1999)
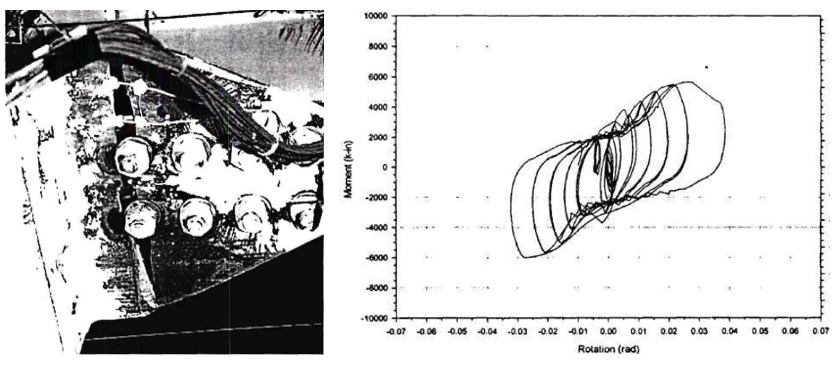
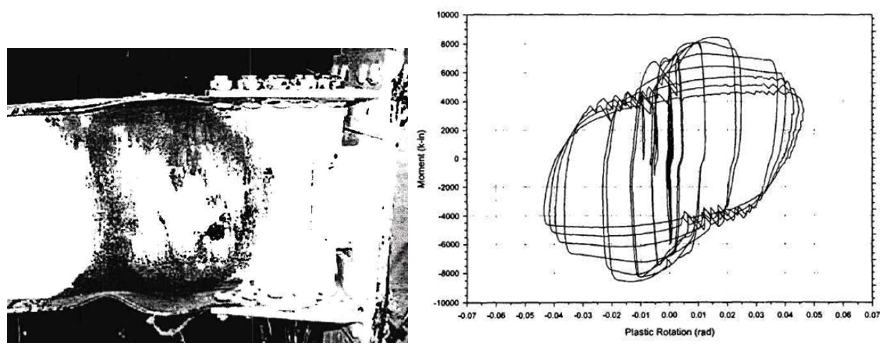
Ze zkoušky základního modelu bylo jako způsob porušení identifikováno lokální boulení nosníku. Zkouška byla ukončena po rozsáhlém lokálním boulení stojiny a přírub nosníku, kdy vrcholový moment v přípoji dosáhl přibližně 9 003 kips-in. V tomto okamžiku byla odpovídající síla v T-profilu 381,1 kips. Fotografie po zkoušce a naměřený vztah moment–plastická rotace jsou uvedeny na obrázku 5.6.
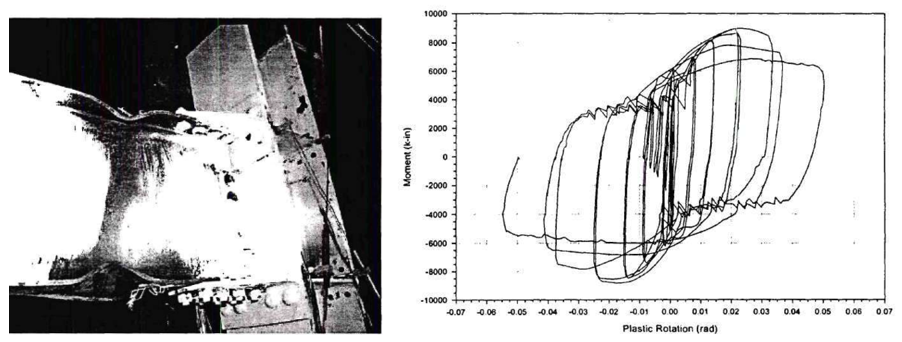
Obrázek 5.6: Vlevo) Základní model po zkoušce; vpravo) vztah moment–celková plastická rotace (Leon, 1999)
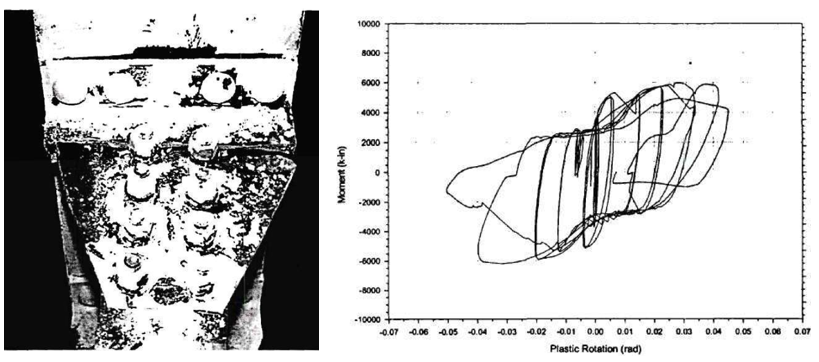
Ve variantě 1 bylo maximální zatížení aktuátoru a maximální moment v přípoji uvedeno jako 32,8 kips a 6 011 kips-in. Počáteční plastifikace T-profilu byla pozorována, když síla v T-profilu a moment v přípoji dosahovaly přibližně 185 kips a 3 800 kips-in. První plastifikace nosníku byla zaznamenána při momentu v přípoji přibližně 5 000 kips-in. Při dalších cyklech došlo k porušení vzorku lomem T-profilu podél první řady smykových šroubů. Fotografie po zkoušce a naměřený vztah moment–plastická rotace jsou uvedeny na obrázku 5.7.
Ve variantě 2 byla první plastifikace T-profilu a příruby nosníku zaznamenána, když síla v T-profilu a moment v přípoji dosahovaly přibližně 245 kips a 5 000 kips-in. Při dalším zatěžování bylo pozorováno boulení příruby a vzorek byl porušen lomem v čistém průřezu. Uváděný maximální moment v přípoji byl přibližně 6 183 kips-in. Fotografie po zkoušce a naměřený vztah moment–plastická rotace jsou uvedeny na obrázku 5.8.
Obrázek 5.7: Vlevo) Varianta 1 po zkoušce; vpravo) vztah moment–celková plastická rotace (Lee et al., 1999)
Obrázek 5.8: Vlevo) Varianta 2 po zkoušce; vpravo) vztah moment–celková plastická rotace (Leon, 1999)
Pokud jde o zkoušku varianty 3, jako způsob porušení bylo uvedeno lokální boulení nosníku. Zkouška byla zastavena poté, co bylo na přírubách nosníku pozorováno rozsáhlé lokální boulení. Maximální moment v přípoji byl přibližně 9 739 kips-in. Fotografie po zkoušce a naměřený vztah moment–plastická rotace jsou uvedeny na obrázku 5.9.
Ze zkoušky varianty 4 bylo zjištěno, že vzorek vykazoval lokální boulení příruby. Při svislém přemístění konce nosníku přibližně 12,8 palce došlo k lomu příruby nosníku podél řady šroubů nejvzdálenější od příruby sloupu. Vrcholový moment v přípoji byl přibližně 9 580 kips-in. s odpovídající silou v T-profilu 405,5 kips. Fotografie po zkoušce a naměřený vztah moment–plastická rotace jsou uvedeny na obrázku 5.10.
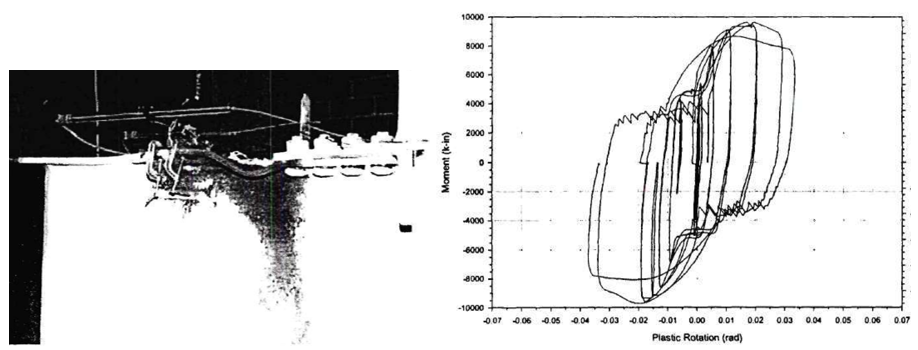
Obrázek 5.9: Vlevo) Varianta 3 po zkoušce; vpravo) vztah moment–celková plastická rotace (Leon, 1999)
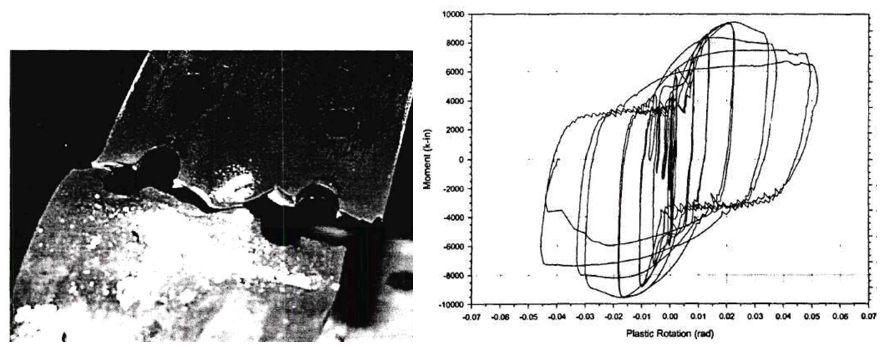
Obrázek 5.10: Vlevo) Varianta 4 po zkoušce; vpravo) vztah moment–celková plastická rotace (Leon, 1999)
Pozorování ze zkoušky varianty 5 byla podobná pozorováním ze základního modelu a varianty 3. Vzorek vykazoval během zkoušky rozsáhlé lokální boulení nosníku. Zkouška byla ukončena, když maximální moment v přípoji dosáhl přibližně 8 586 kips-in. V tomto okamžiku byla odpovídající síla v T-profilu 363,4 kips. Fotografie po zkoušce a naměřený vztah moment–plastická rotace jsou uvedeny na obrázku 5.11.
Obrázek 5.11: Vlevo) Varianta 5 po zkoušce; vpravo) vztah moment–celková plastická rotace (Leon, 1999)
5.3 Normové posouzení
Limity předkvalifikace a návrhový postup pro momentové přípoje s dvojitým T-profilem jsou uvedeny v kapitole 13 AISC 358 (2016). Pro testované vzorky byla identifikována a provedena následující normová posouzení:
- Únosnost stojiny T-profilu (AISC 358, Eq. 13.6-45)
- Průměr smykového šroubu (AISC 358, Eq. 13.6-4)
- Průměr tahového šroubu (AISC 358, Eq. 13.6-16)
- Průměr tahového šroubu (AISC 358, Eq. 13.6-16)
- Rotační tuhost přípoje (AISC 358, Eq. 13.6-28)
- Únosnost T-profilu (AISC 358, Eq. 13.6-46)
- Únosnost v otlačení/vytržení příruby nosníku (AISC 360, Eq. J3-6)
- Únosnost v otlačení/vytržení stojiny T-profilu (AISC 360, Eq. J3-6)
- Únosnost v blokovém smyku příruby nosníku (AISC 360-16, Eq. J4-5)
- Únosnost v blokovém smyku stojiny T-profilu (AISC 360-16, Eq. J4-5)
- Únosnost sloupu při ohybovém kluzu (AISC 358, Eq. 13.6-61)
- Požadavky na výztužné plechy (AISC 341, Sec. E3.6f.1(a))
- Vztahy sloup–nosník (AISC 341, Eq. E3-1)
- Únosnost styčníkového panelu (AISC 360, Eq. J10-11)
- Ohybová únosnost nosníku (AISC 360, Eq. F1-1)
- Posouzení únosnosti šroubů smykového plechu (AISC 360, Eq. J3-6a)
- Posouzení únosnosti svaru smykového plechu (AISC 360, Eq. J4-2)
- Posouzení smykového kluzu, lomu a blokového smyku smykového plechu (AISC 360, Eq. J3-J4)
Bylo předpokládáno, že smykový plech, zdvojovací plech a výztužné plechy mají totožné naměřené materiálové vlastnosti jako T-profil. Pro šrouby A490 byly použity hodnoty jmenovité tahové pevnosti (fnt = 90 ksi) a smykové pevnosti (fnv = 68 ksi) uvedené v tabulce AISC J3. Pro každý vzorek bylo vytvořeno pět modelů na základě materiálových zkušebních protokolů z hutních atestů. Pro variantu 1 a variantu 2 byly vytvořeny dva dodatečné modely s využitím materiálových vlastností naměřených na zkušebních vzorcích T-profilu. Pro vybrané vzorky byla provedena normová posouzení a jejich přehled je uveden v tabulce 5.3.
Tabulka 5.3: Normová posouzení momentových přípojů s dvojitým T-profilem
| Normové posouzení AISC | Základní model | Var-1 | Var-1 | Var-2 | Var-2 | Var-3 | Var-4 | Var-5 |
| Hutní atest | Hutní atest | Zkušební vzorek | Hutní atest | Zkušební vzorek | Hutní atest | Hutní atest | Hutní atest | |
| Únosnost stojiny T-profilu | Nevyhovuje | Nevyhovuje | Nevyhovuje | Nevyhovuje | Nevyhovuje | Vyhovuje | Vyhovuje | Vyhovuje |
| Průměr smykového šroubu | Vyhovuje | Nevyhovuje | Vyhovuje | Nevyhovuje | Vyhovuje | Vyhovuje | Vyhovuje | Vyhovuje |
| Průměr tahového šroubu | Vyhovuje | Vyhovuje | Vyhovuje | Vyhovuje | Vyhovuje | Vyhovuje | Vyhovuje | Vyhovuje |
| Minimální tloušťka příruby T-profilu | Vyhovuje | Vyhovuje | Vyhovuje | Vyhovuje | Vyhovuje | Vyhovuje | Vyhovuje | Vyhovuje |
| Rotační tuhost přípoje | Vyhovuje | Vyhovuje | Vyhovuje | Vyhovuje | Vyhovuje | Vyhovuje | Vyhovuje | Vyhovuje |
| Únosnost T-profilu | Vyhovuje | Vyhovuje | Vyhovuje | Vyhovuje | Vyhovuje | Vyhovuje | Vyhovuje | Vyhovuje |
| Únosnost v otlačení/vytržení příruby nosníku | Vyhovuje | Nevyhovuje | Nevyhovuje | Vyhovuje | Vyhovuje | Vyhovuje | Vyhovuje | Vyhovuje |
| Únosnost v otlačení/vytržení stojiny T-profilu | Vyhovuje | Nevyhovuje | Nevyhovuje | Nevyhovuje | Nevyhovuje | Vyhovuje | Vyhovuje | Vyhovuje |
| Únosnost v blokovém smyku příruby nosníku | Nevyhovuje | Nevyhovuje | Nevyhovuje | Nevyhovuje | Nevyhovuje | Nevyhovuje | Vyhovuje | Vyhovuje |
| Únosnost v blokovém smyku stojiny T-profilu | Nevyhovuje | Nevyhovuje | Nevyhovuje | Nevyhovuje | Nevyhovuje | Vyhovuje | Vyhovuje | Vyhovuje |
| Únosnost sloupu při ohybovém kluzu | Vyhovuje | Vyhovuje | Vyhovuje | Vyhovuje | Vyhovuje | Vyhovuje | Vyhovuje | Vyhovuje |
| Požadavky na výztužné plechy | Nevyhovuje | Nevyhovuje | Nevyhovuje | Nevyhovuje | Nevyhovuje | Nevyhovuje | Nevyhovuje | Nevyhovuje |
| Vztahy sloup–nosník | Vyhovuje | Vyhovuje | Vyhovuje | Vyhovuje | Vyhovuje | Vyhovuje | Vyhovuje | Vyhovuje |
| Únosnost styčníkového panelu | Vyhovuje | Vyhovuje | Vyhovuje | Vyhovuje | Vyhovuje | Vyhovuje | Vyhovuje | Vyhovuje |
| Ohybová únosnost nosníku | Vyhovuje | Vyhovuje | Vyhovuje | Vyhovuje | Vyhovuje | Vyhovuje | Vyhovuje | Vyhovuje |
| Únosnost šroubů smykového plechu | Vyhovuje | Vyhovuje | Vyhovuje | Vyhovuje | Vyhovuje | Vyhovuje | Vyhovuje | Vyhovuje |
| Únosnost svaru smykového plechu | Vyhovuje | Vyhovuje | Vyhovuje | Vyhovuje | Vyhovuje | Vyhovuje | Vyhovuje | Vyhovuje |
| Smykový kluz, smykový lom, bloková smyková únosnost smykového plechu | Nevyhovuje | Vyhovuje | Vyhovuje | Vyhovuje | Vyhovuje | Nevyhovuje | Nevyhovuje | Nevyhovuje |
Způsob porušení momentového přípoje s dvojitým T-profilem lze odhadnout, jsou-li známy rozhodující mezní stavy z následujících posouzení:
- Únosnost hrubého průřezu stojiny při kluzu
- Únosnost čistého průřezu stojiny při lomu
- Únosnost stojiny při ohybovém boulení
- Únosnost smykového šroubu
- Únosnost v otlačení/vytržení nosníku
- Únosnost v otlačení/vytržení stojiny T-profilu
- Únosnost v blokovém smyku nosníku
- Únosnost v blokovém smyku stojiny T-profilu
- Plastická momentová únosnost nosníku
Pro každý mezní stav byly vypočteny momentové únosnosti na líci sloupu pro jednotlivé vzorky (viz přílohy I a J) a výsledky jsou uvedeny v tabulce 5.4. Rozhodující momentová únosnost (tj. nejnižší únosnost) je identifikována a zvýrazněna tučným písmem.
Tabulka 5.4: Momentová únosnost vzorků
| Momentová únosnost | Základní model [kips-in.] | Var-1 [kips-in.] | Var-1 [kips-in.] | Var-2 [kips-in.] | Var-2 [kips-in.] | Var-3 [kips-in.] | Var-4 [kips-in.] | Var-5 [kips-in.] |
| Hutní atest | Hutní atest | Zkušební vzorek | Hutní atest | Zkušební vzorek | Hutní atest | Hutní atest | Hutní atest | |
| Kluz hrubého průřezu stojiny | 10 412 | 4 570 | 5 246 | 5 041 | 5 787 | 11 623 | 11 956 | 11 956 |
| Lom čistého průřezu stojiny | 11 400 | 4 996 | 6 211 | 5 432 | 6 753 | 13 369 | 13 157 | 12 793 |
| Ohybové boulení stojiny | 10 412 | 4 570 | 5 246 | 5 041 | 5 787 | 11 623 | 11 956 | 11 956 |
| Smykový šroub | 12 758 | 7 928 | 9 856 | 9 061 | 11 264 | 12 189 | 12 187 | 15 944 |
| Otlačení/vytržení nosníku | 14 619 | 9 524 | 9 524 | 10 590 | 10 590 | 16 906 | 16 903 | 17 482 |
| Otlačení/vytržení stojiny T-profilu | 16 681 | 7 222 | 8 667 | 7 956 | 9 608 | 19 299 | 19 012 | 20 945 |
| Blokový smyk nosníku | 9 213 | 6 266 | 6 266 | 6 673 | 6 673 | 10 460 | 10 922 | 10 878 |
| Blokový smyk stojiny T-profilu | 9 829 | 4 398 | 5 467 | 4 684 | 5 823 | 11 160 | 11 471 | 12 281 |
| Plastický moment nosníku | 8 749 | 8 071 | 8 108 | 8 108 | 8 162 | 8 802 | 8 802 | 7 880 |
Na základě výpočtů podle AISC byl plastický moment nosníku odhadnutým způsobem porušení pro základní model, variantu 3, variantu 4 a variantu 5. U varianty 1 a varianty 2 byl blokový smyk stojiny T-profilu rozhodujícím mezním stavem při použití materiálových vlastností ze zkušebních vzorků pro T-profily. Při použití materiálových vlastností z hutních atestů pro všechny prvky se způsob porušení změnil na kluz hrubého průřezu stojiny.
5.4 Analýza v IDEA StatiCa
Pro vyhodnocení momentových únosností vzorků byly vytvořeny modely v IDEA StatiCa. Jelikož cílem bylo simulovat experimentální zkoušky, byl pro podmínky zkušební sestavy vytvořen model v SAP2000 a byly vypočteny síly v ose sloupu. Byly použity naměřené materiálové vlastnosti a součinitele únosnosti byly nastaveny na hodnotu 1,0. Pomocí typu analýzy napětí-přetvoření v IDEA StatiCa (tj. EPS) byly vypočteny momentové únosnosti a odhadnuty způsoby porušení vzorků. Pro základní model byl vztah moment–rotace vypočten pomocí analýzy tuhosti přípoje (tj. ST) v softwaru IDEA StatiCa. Dále byla použita analýza kapacitního návrhu (tj. CD) k ověření dostatečné deformační kapacity přípoje.
5.4.1 Analýza základního modelu
Za účelem posouzení vlivu šroubů řízených tahem na únosnost a rotační tuhost přípoje byly pro základní model vytvořeny dva různé modely v IDEA StatiCa s použitím dvou různých typů šroubů: 1) šrouby přenášející síly otlačením a 2) třecí šrouby. Do softwaru byly zadány materiálové vlastnosti z hutních atestů (viz tabulka 5.2) a součinitele nadpevnosti Ry a Rt a všechny součinitele únosnosti LRFD byly nastaveny na hodnotu 1,0. V SAP2000 byl vytvořen rámový model nosník–sloup s délkami sloupu a nosníku odpovídajícími zkušební sestavě a byly získány síly v ose sloupu. Pomocí možnosti „Zatížení v rovnováze" byla provedena analýza napětí-přetvoření (EPS) pro výpočet únosnosti základního modelu. Zatížení bylo postupně zvyšováno, dokud nebylo dosaženo některé z následujících podmínek:
- 5 % plastického přetvoření v plechách (nosník, sloup, smykový plech, výztužný plech)
- 100 % únosnosti šroubů
- 100 % únosnosti svarů
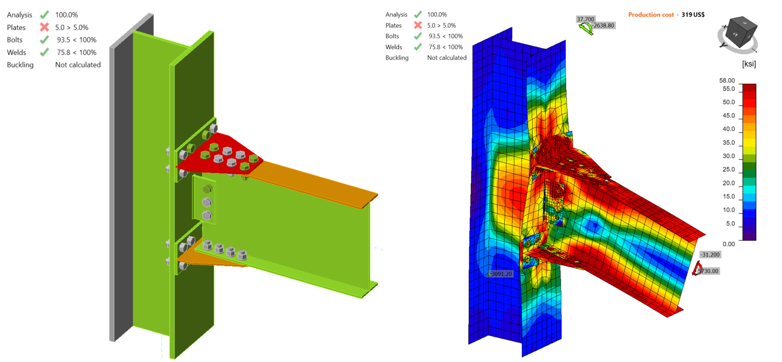
Z analýzy v IDEA StatiCa modelu vytvořeného s třecími šrouby bylo zjištěno, že únosnost šroubů byla dosažena při aplikované smykové síle a momentu 26,70 kips a 4 900 kips-in. (obrázek 5.12). Druhý model byl vytvořen přepnutím možnosti „přenos smykové síly" z „tření" na „otlačení – interakce tah/smyk" pro T-profily a smykový plech. Dále byla vypnuta možnost „deformace v otvoru šroubu při provozním zatížení je návrhové hledisko" (v nastavení normy). Na přípoj bylo aplikováno přírůstkové zatížení (proporcionálně se všemi zatíženími v rovnováze) a bylo zjištěno, že 5% mezní plastické přetvoření bylo dosaženo na přírubě nosníku při hodnotách smykové síly a odpovídajícího momentu 46,00 kips a 8 430 kips-in. (obrázek 5.13). Typ analýzy byl přepnut na analýzu tuhosti (tj. „ST") a vztah moment–rotace byl vypočten pro každý model, jak je znázorněno na obrázku 5.14.
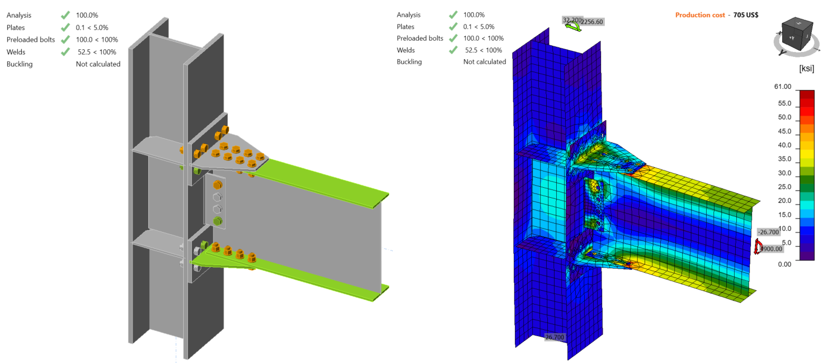
Obrázek 5.12: Model základního modelu v IDEA StatiCa (s třecími šrouby) při momentu 4 900 kips-in.
Obrázek 5.13: Model základního modelu v IDEA StatiCa (se šrouby přenášejícími síly otlačením) při momentu 8 430 kips-in.
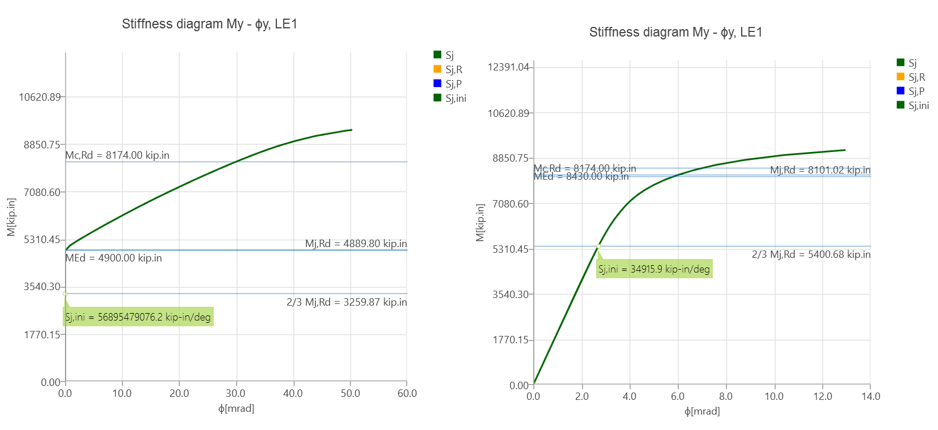
Obrázek 5.14: Vlevo) Vztah moment–rotace pro základní model s třecími šrouby; vpravo) vztah moment–rotace pro základní model se šrouby přenášejícími síly otlačením
Typ analýzy byl přepnut na kapacitní návrh (tj. „CD") za účelem ověření, zda má přípoj dostatečnou tažnost při dosažení plastické momentové únosnosti nosníku. Pro provedení této analýzy je nutné vypočítat plastický moment nosníku, polohu plastického kloubu a smykovou sílu v místě plastického kloubu. Podle rovnice 2.4-1 v AISC 341 (2016) se pravděpodobný maximální moment nosníku v místě plastického kloubu \(M_{p}\) vypočítá jako:
\(M_{p} = C_{pr}F_{y}R_{y}Z_{x}\) (5.1)
kde \(Z_{x}\) je plastický průřezový modul nosníku, \(F_{y}\) je mez kluzu nosníku, \(R_{y}\) je poměr očekávané meze kluzu k předepsané minimální mezi kluzu a \(C_{pr}\) je součinitel zohledňující vrcholovou únosnost přípoje, který je dán rovnicí 2.4-2 v AISC 341 (2016) jako:
\(C_{pr} = (F_{y} + F_{u})/(2F_{y}\) (5.2)
\(F_{u}\) je mez pevnosti nosníku. Předpokládá se, že \(R_{y}\) je rovno 1,0 při použití naměřených materiálových vlastností. S použitím materiálových vlastností z hutních atestů a plastického průřezového modulu nosníku (134 in.3) uvedeného v tabulce 1.1 v AISC Manual (2017) byly \(C_{pr}\) a \(M_{p}\) vypočteny s použitím níže uvedených vlastností jako 1,12 a 9 154,88 kips-in. Vzdálenost polohy plastického kloubu od osy sloupu a smyková síla v místě plastického kloubu byly vypočteny jako 19,9 palce a 103 kips (viz příloha I) s předpokladem, že vzdálenost mezi osami sloupů je 30 stop. Vypočtená zatížení byla aplikována v místě nosníku odpovídajícím 19,9 palce nastavením zatížení jako procenta prvků tak, aby odpovídala vypočteným hodnotám plastického momentu a smykové síly, jak je znázorněno na obrázku 5.15. Přípoj nevyhovuje, stojiny T-profilů jsou příliš slabé (v horní stojině T-profilu bylo dosaženo 22,1 % plastického přetvoření).
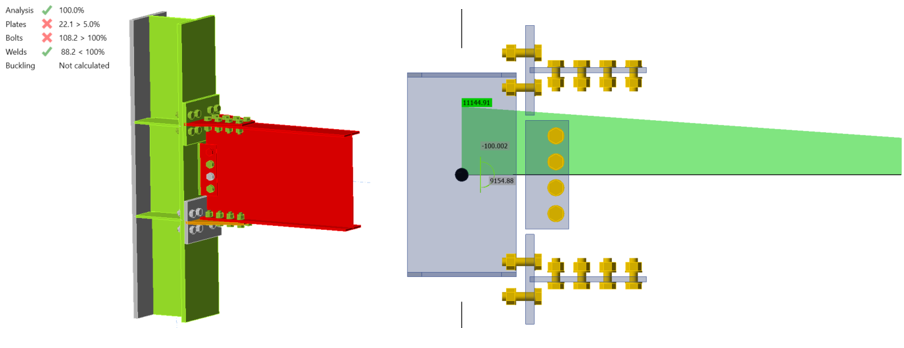
Obrázek 5.15: Analýza kapacitního návrhu základního modelu
5.4.2 Analýza varianty 1
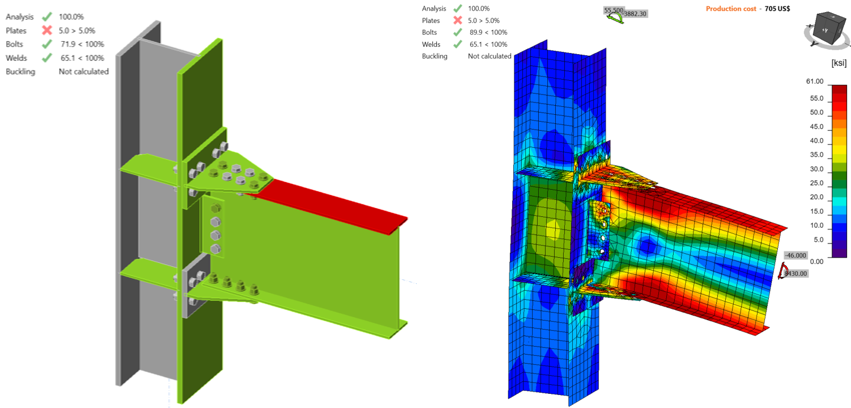
Pro variantu 1 byly vytvořeny dva modely v IDEA StatiCa s různými naměřenými materiálovými vlastnostmi T-profilu. Pro první model byly použity materiálové vlastnosti z hutních atestů pro všechny prvky vzorků, zatímco druhý model byl vytvořen s použitím materiálových vlastností příruby T-profilu ze zkušebních vzorků. Podle stejného postupu popsaného v předchozí kapitole bylo aplikováno přírůstkové zatížení. První model dosáhl své únosnosti při 5 % plastického přetvoření v T-profilech, když smyková síla a odpovídající moment dosahovaly hodnot 26,70 kips a 4 900 kips-in. (obrázek 5.16). Materiálové vlastnosti T-profilů byly aktualizovány s použitím vlastností ze zkušebních vzorků a byl dodržen stejný postup přírůstkového zatěžování. Stejný způsob porušení byl pozorován, když smyková síla a odpovídající moment dosáhly hodnot 30,00 kips a 5 500 kips-in. (obrázek 5.17).
Obrázek 5.16: Model varianty 1 v IDEA StatiCa (hutní atest) při momentu 4 900 kips-in.
Obrázek 5.17: Model varianty 1 v IDEA StatiCa (zkušební vzorek) při momentu 5 500 kips-in.
5.4.3 Analýza varianty 2
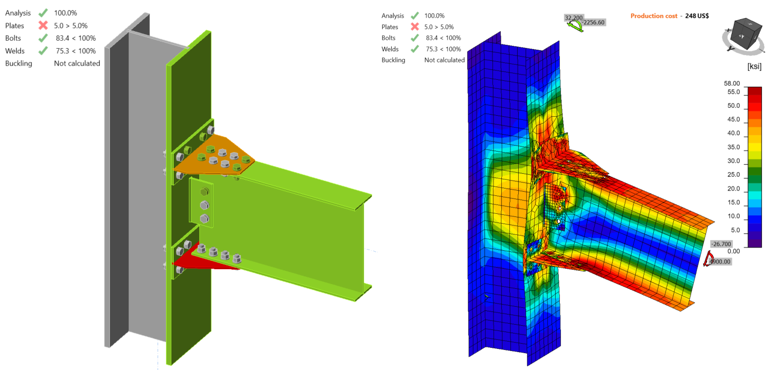
Podle stejného postupu byly pro variantu 2 vytvořeny dva modely v IDEA StatiCa. Z modelu vytvořeného s vlastnostmi z hutních atestů bylo zjištěno, že T-profil dosáhl mezního plastického přetvoření (tj. 5,0 %) při aplikované smykové síle a momentu 26,90 kips a 4 940 kips-in. (obrázek 5.18). Po přepnutí materiálových vlastností T-profilu na vlastnosti ze zkušebních vzorků byla vypočtena vyšší ohybová momentová únosnost 5 730 kips-in. s odpovídající smykovou silou 31,20 kips (obrázek 5.19). Způsob porušení zůstal stejný.
Obrázek 5.18: Model varianty 2 v IDEA StatiCa (hutní atest) při momentu 4 940 kips-in.
Obrázek 5.19: Model varianty 2 v IDEA StatiCa (zkušební vzorek) při momentu 5 730 kips-in.
5.4.4 Analýza varianty 3
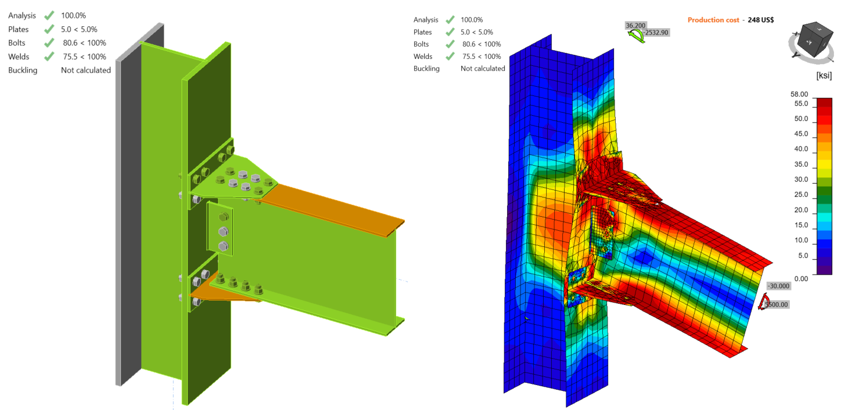
Pro variantu 3 byl model v IDEA StatiCa vytvořen s použitím materiálových vlastností z hutních atestů. Při smykové síle a odpovídajícím momentu 45,50 kips a 8 350 kips-in. bylo dosaženo 5 % plastického přetvoření na přírubě nosníku (obrázek 5.20).
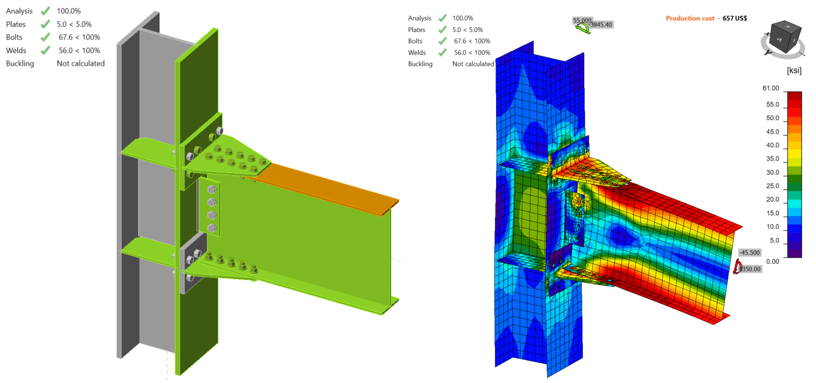
Obrázek 5.20: Model varianty 3 v IDEA StatiCa při momentu 8 350 kips-in.
5.4.5 Analýza varianty 4
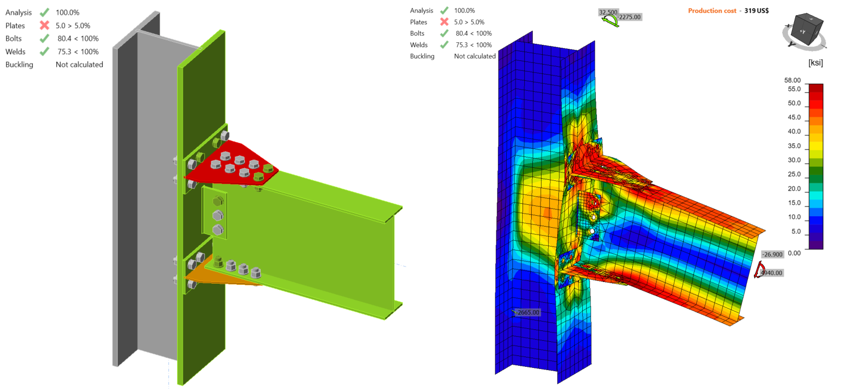
Pro variantu 4 byl model v IDEA StatiCa vytvořen s použitím materiálových vlastností z hutních atestů. Na přírubě nosníku bylo dosaženo 5 % plastického přetvoření při smykové síle a odpovídajícím momentu 45,50 kips a 8 350 kips-in. (obrázek 5.21).
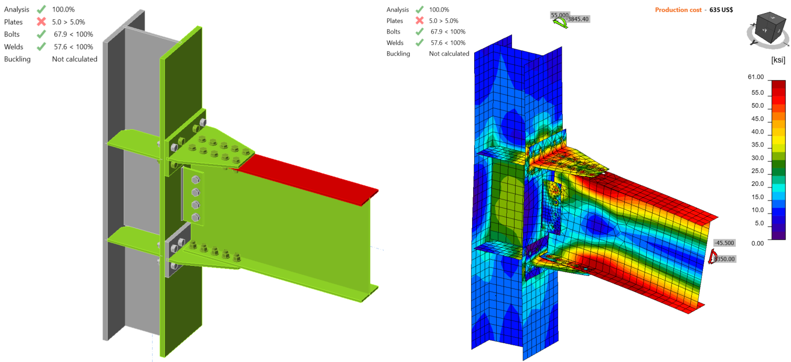
Obrázek 5.21: Model varianty 4 v IDEA StatiCa při momentu 8 350 kips-in.
5.4.6 Analýza varianty 5
Podle stejného postupu byla pro variantu 5 provedena analýza v IDEA StatiCa. Pro všechny prvky přípoje byly použity materiálové vlastnosti z hutních atestů. Na přírubě nosníku bylo dosaženo 5 % plastického přetvoření při smykové síle a odpovídající hodnotě 48,40 kips a 7 950 kips-in. (obrázek 5.22).
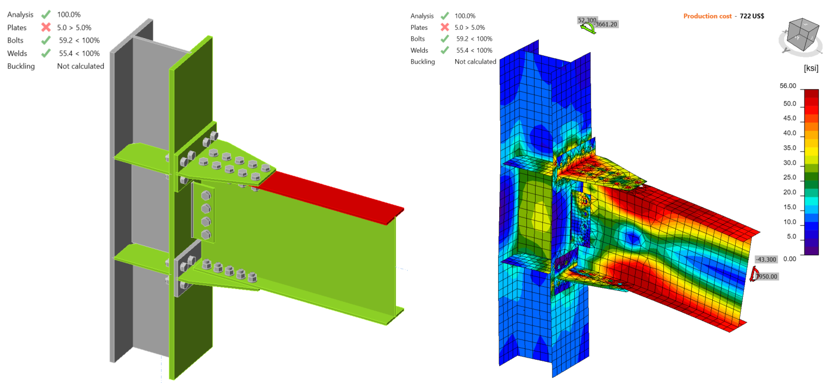
Obrázek 5.22: Model varianty 5 v IDEA StatiCa při momentu 7 950 kips-in.
Momentové únosnosti momentových přípojů s dvojitým T-profilem vztažené k ose sloupu \(M_{y@cc}\) byly získány analýzou v IDEA StatiCa. Momentové únosnosti na líci sloupu \(M_{y@foc}\) byly vypočteny pomocí rovnice 5.3 a jsou uvedeny v tabulce 5.5.
\(M_{y@foc} = M_{y@cc} - V_{g}\frac{d_{c}}{2}\) (5.3)
kde \(V_{g}\) je smyková síla a \(d_{c}\) je výška průřezu sloupu.
Tabulka 5.5: Momentové únosnosti vypočtené v IDEA StatiCa
| Číslo vzorku | \(M_{y@cc}\) [kips-in.] | \(V_{g}\) [kips] | \(M_{y@foc}\) [kips-in.] |
| Základní model (otlačení) | 8 430 | 46,0 | 8 090 |
| Základní model (tření) | 4 900 | 26,7 | 4 702 |
| Varianta 1 (hutní atest) | 4 900 | 26,7 | 4 702 |
| Varianta 1 (zkušební vzorek) | 5 500 | 30,0 | 5 278 |
| Varianta 2 (hutní atest) | 4 940 | 26,9 | 4 741 |
| Varianta 2 (zkušební vzorek) | 5 730 | 31,2 | 5 499 |
| Varianta 3 | 8 350 | 45,5 | 8 013 |
| Varianta 4 | 8 350 | 45,5 | 8 013 |
| Varianta 5 | 7 950 | 43,3 | 7 630 |
5.5. Analýza v ABAQUS
V této kapitole byl základní model vytvořený v části 5.4.1 znovu sestaven v softwaru ABAQUS (verze 2022) pro obecnou analýzu metodou konečných prvků a výsledky byly porovnány s IDEA StatiCa. Výchozí CAD model pro analýzu metodou konečných prvků byl vygenerován pomocí platformy Viewer v IDEA StatiCa. 36 šroubů a dvě svarové linie spojující celou sestavu byly následně přidány ručně pomocí CAD rozhraní v ABAQUS. V této části byly zkoumány dva typy šroubů, jak je popsáno v části 5.4.1. Pro šrouby přenášející síly otlačením bylo svislé zatížení 46 kips a odpovídající moment 8 430 kips-in. (kolem osy Y) aplikováno na definovaný referenční bod (tj. RF1) v ose sloupu, jak je znázorněno na obrázku 5.23. Pro třecí šrouby bylo svislé zatížení 26,7 kips a odpovídající moment 4 900 kips-in. (kolem osy Y) aplikováno na stejný referenční bod (tj. RF1). Analytická délka sloupu v IDEA StatiCa je 190 palců. Za účelem napodobení totožné délky sloupu v ABAQUS byly zavedeny dva další referenční body (tj. RF2 a RF3) ve vzdálenosti 95 palců od středu sloupu podél osy Z v obou směrech (viz obrázek 5.23). Tyto dva referenční body byly pevně uloženy ve všech směrech a byly spojeny s horní a dolní plochou sloupu pomocí modulu pro tvorbu konektorů v ABAQUS. Pro simulaci třecích šroubů v IDEA StatiCa bylo v modelu ABAQUS aplikováno předpínací zatížení podél osy dříku každého šroubu. V ABAQUS byla po standardní analýze citlivosti sítě zvolena velikost prvku v rozsahu 0,1–0,3 palce a v modelu bylo celkem vygenerováno 387 893 prvků. Jako typ prvku byl zvolen 3D napěťový, 8uzlový lineární kvádrový prvek se sníženou integrací (tj. C3D8R). Mezi dvěma svarovými liniemi a připojenými částmi bylo aplikováno vazební omezení (tie constraint). Chování materiálu bylo modelováno pomocí bilineární plasticity v ABAQUS. Ostatní parametry, včetně hustoty, modulu pružnosti a Poissonova poměru, byly převzaty z knihovny materiálů IDEA StatiCa aktualizované podle hutních atestů (viz tabulka 5.2). Numerická simulace byla provedena na 16 procesorech (16vCP & 64 GB RAM) a trvala přibližně 210 minut. Obrázek 5.24 porovnává předpovězené napětí von Mises mezi IDEA StatiCa a ABAQUS pro oba scénáře typů šroubů.
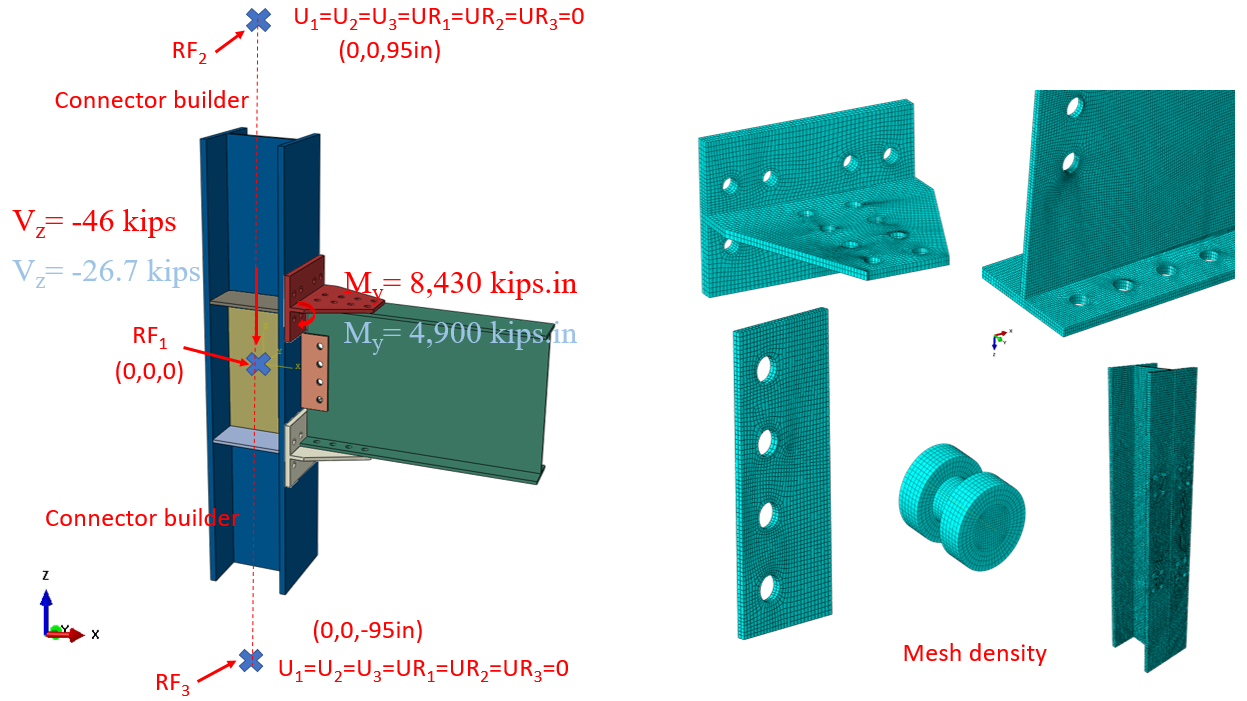
Obrázek 5.23: Nastavení modelu a hustota sítě v ABAQUS
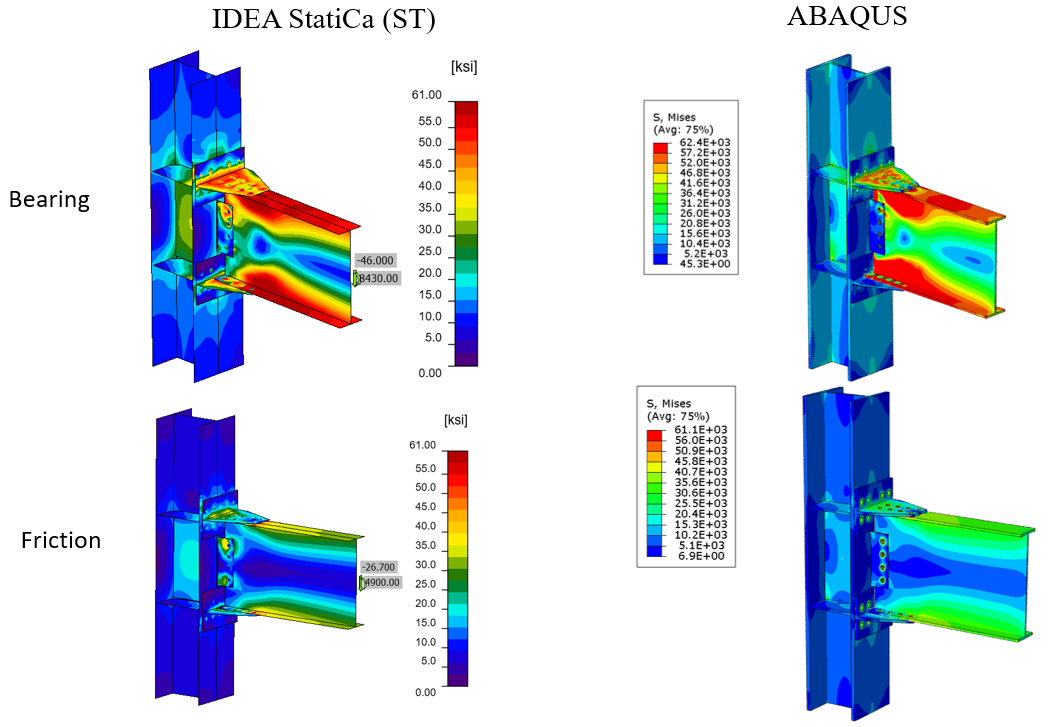
Obrázek 5.24: Porovnání vypočteného napětí von Mises mezi modely IDEA StatiCa a ABAQUS; horní řada) předpoklad šroubů přenášejících síly otlačením, dolní řada) předpoklad třecích šroubů
Maximální předpovězené napětí v IDEA StatiCa pro šrouby přenášející síly otlačením bylo 62,4 ksi na horní přírubě nosníku (legenda IDEA StatiCa zobrazuje návrhová data), přičemž model ABAQUS vykazuje podobné napětí na stejném místě. Maximální předpovězené napětí v IDEA StatiCa pro třecí šrouby bylo 61 ksi na horní přírubě nosníku, zatímco model ABAQUS vykazuje napětí 61,1 ksi na stejném místě. Mírně odlišné rozložení napětí je pravděpodobně způsobeno zohledněním délky sloupu v ABAQUS a způsobem aplikace okrajových podmínek, použitím jemnější sítě v analýze metodou konečných prvků a zjednodušeným CAD modelem v IDEA StatiCa. Autoři rovněž zkoumali potenciální vliv třecího chování šroubů na výsledky v modelu ABAQUS změnou součinitele tření z 0,3 na bezeztrátové tření, výsledky však na tento parametr nebyly citlivé.
Maximální vypočtené plastické přetvoření v IDEA StatiCa a ABAQUS pro šrouby přenášející síly otlačením bylo 6,3 % pro oba modely (tj. na horní přírubě nosníku, jak je znázorněno na obrázku 5.25). Předpovězená oblast plastické deformace v IDEA StatiCa byla rovněž konzistentní s vypočtenou mapou plastifikace v ABAQUS (tj. dolní řada na obrázku 5.25).
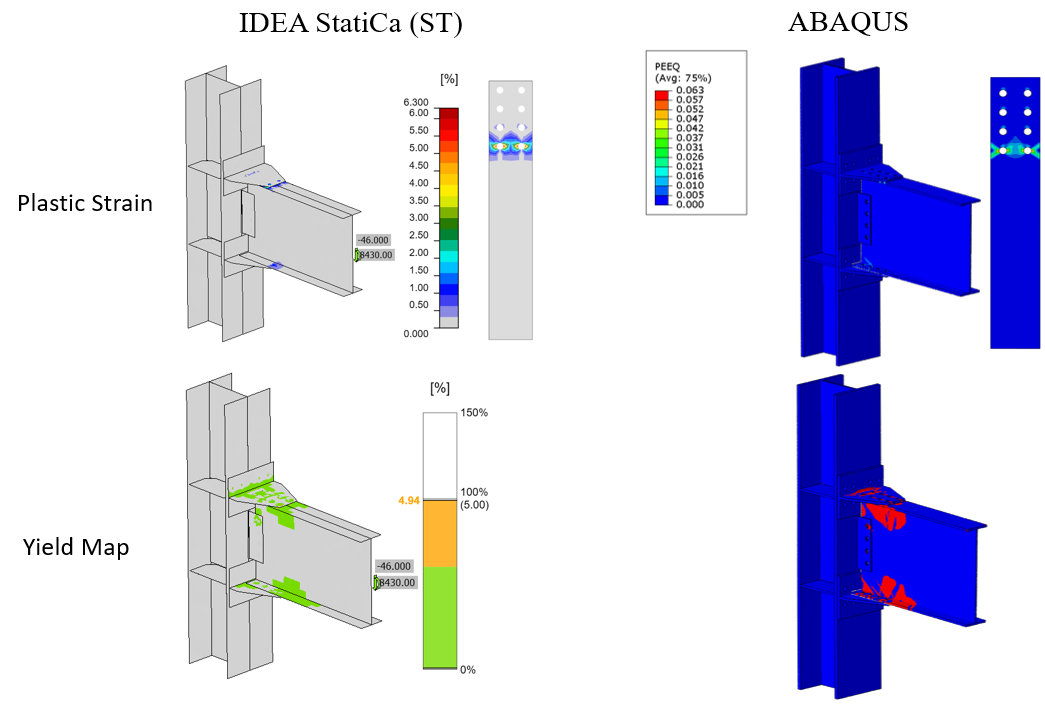
Obrázek 5.25: Šrouby přenášející síly otlačením: Horní řada) Porovnání vypočteného plastického přetvoření mezi modely IDEA StatiCa a ABAQUS; dolní řada) porovnání mapy plastifikace mezi modely IDEA StatiCa a ABAQUS
Maximální vypočtené plastické přetvoření v IDEA StatiCa a ABAQUS pro třecí šrouby bylo 0,1 % a 0,17 % (tj. obě hodnoty na horní přírubě nosníku v okolí předních otvorů pro šrouby, jak je uvedeno na obrázku 5.26). Předpovězená oblast plastické deformace v IDEA StatiCa byla rovněž konzistentní s vypočtenou mapou plastifikace v ABAQUS (tj. dolní řada na obrázku 5.26).
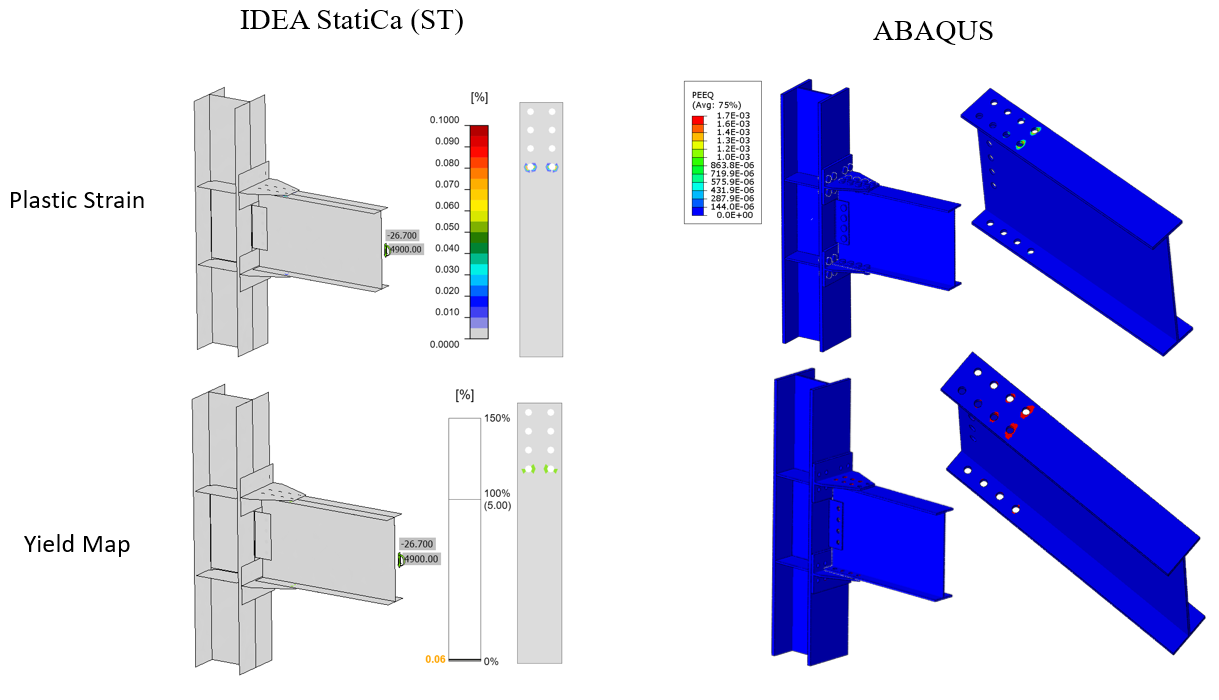
Obrázek 5.26: Třecí šrouby: Horní řada) Porovnání vypočteného plastického přetvoření mezi modely IDEA StatiCa a ABAQUS; dolní řada) porovnání mapy plastifikace mezi modely IDEA StatiCa a ABAQUS
Obrázek 5.27 znázorňuje porovnání křivky moment–rotace mezi oběma softwary vztažené k ose sloupu pro oba typy šroubů zkoumané v této části. V obrázku 5.27 byla pro získání celkové rotace v IDEA StatiCa (znázorněné přerušovanou oranžovou čarou) vypočtena lineární rotace nosníku v ose sloupu pomocí SAP2000 a následně přičtena k výchozí křivce plastické rotace reportované v IDEA StatiCa (znázorněné plnou oranžovou čarou). Oba modely poskytují srovnatelné odhady počáteční tuhosti. Menší nesoulad může být spojen s rozdílem v typech prvků (tj. objemový prvek v ABAQUS oproti skořepinovému prvku v IDEA StatiCa) a použitím vazebního omezení (tie constraint) v ABAQUS pro reprezentaci svarů.
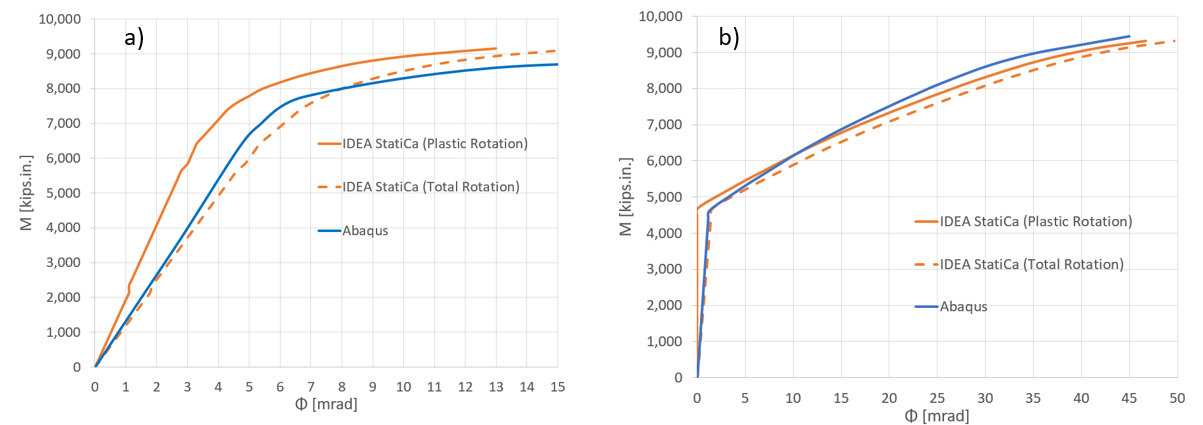
Obrázek 5.27: Porovnání moment–rotace mezi IDEA StatiCa a ABAQUS pro a) šrouby přenášející síly otlačením, b) třecí šrouby
5.6 Shrnutí a porovnání výsledků
Šest momentových přípojů s dvojitým T-profilem z experimentální kampaně bylo studováno pomocí IDEA StatiCa a podle návrhového postupu AISC. Pro základní model byly vytvořeny dva různé modely za účelem zkoumání vlivu použití šroubů přenášejících síly otlačením a třecích šroubů na momentovou únosnost a křivku moment–rotace. Jelikož rozdíl mezi materiálovými vlastnostmi z hutních atestů a ze zkušebních vzorků byl pro variantu 1 a variantu 2 relativně vysoký, byly pro každou z nich vytvořeny dva různé modely v IDEA StatiCa. Pro zbývající vzorky byly použity materiálové vlastnosti z hutních atestů. Dále byly pro základní model porovnány vztahy moment–rotace vypočtené v IDEA StatiCa pro každý typ šroubů s výsledky z ekvivalentních modelů ABAQUS.
Při zkoušce základního modelu bylo jako způsob porušení uvedeno lokální boulení nosníku. Z přírůstkového zatěžování v analýze IDEA StatiCa bylo zjištěno, že model s třecími šrouby selhal z důvodu nedostatečné únosnosti šroubů v prokluzu, zatímco k porušení v modelu se šrouby přenášejícími síly otlačením došlo na přírubě nosníku. Výpočty podle AISC ukazují, že plastická momentová únosnost nosníku byla rozhodujícím mezním stavem. Jelikož AISC 341 umožňuje navrhovat momentové přípoje včetně přípojů s šrouby řízenými tahem na základě jejich únosnosti při otlačení, lze konstatovat, že existuje dobrá shoda ve způsobu porušení základního modelu mezi pozorováními ze zkoušky, analýzou v IDEA StatiCa a návrhovým postupem AISC. Křivky moment–rotace získané z obou modelů IDEA StatiCa a z testovací zprávy jsou porovnány na obrázku 5.28. Je patrné, že vztah moment–rotace vzorku s dvojitým T-profilem s vysokopevnostními šrouby A490 řízenými tahem leží mezi křivkami vypočtenými z modelů IDEA StatiCa vytvořených se šrouby přenášejícími síly otlačením a s třecími šrouby. Analýza kapacitního návrhu provedená pro základní model rovněž ukázala, že T-profil a smykový plech nemají dostatečnou únosnost. Stejně tak oba prvky nesplňovaly normová posouzení AISC.
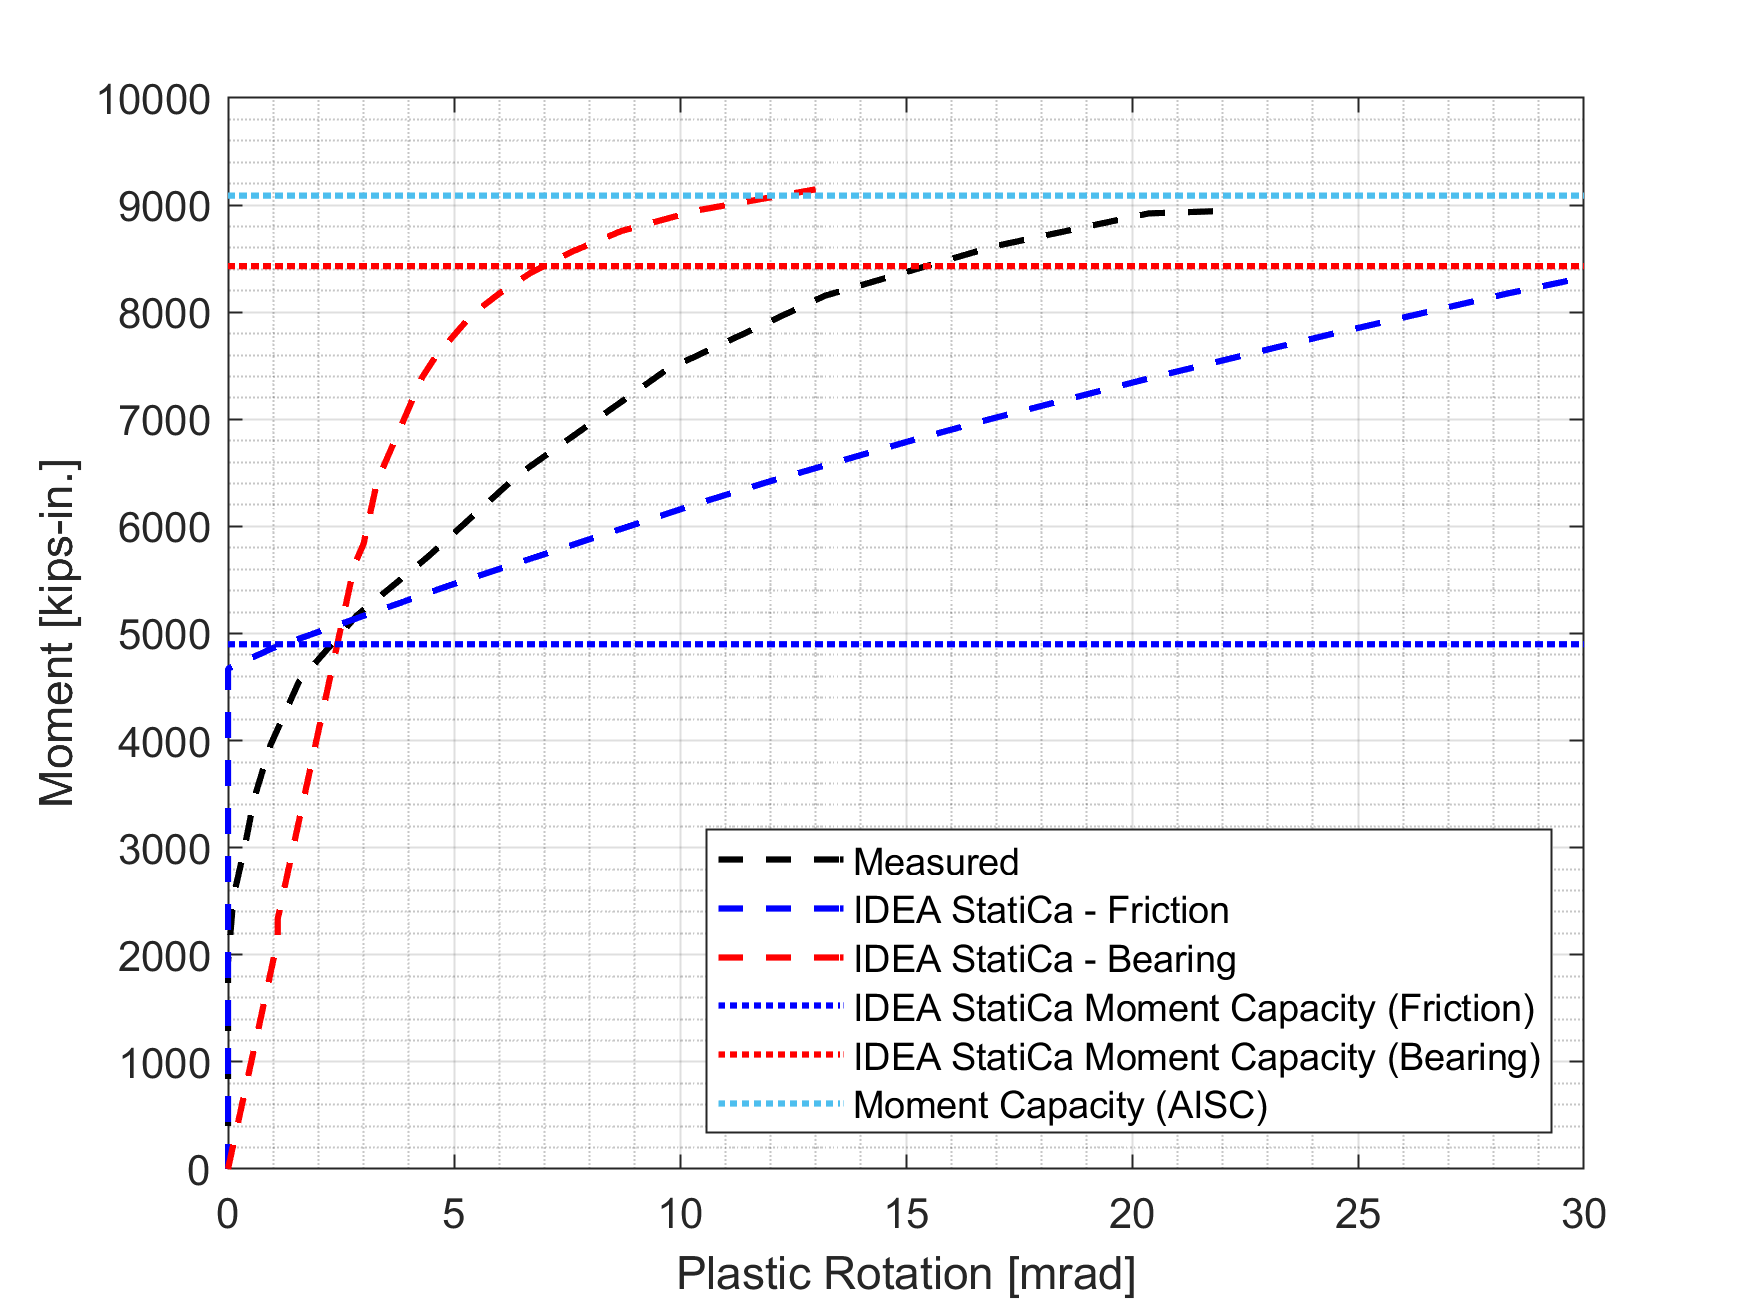
Obrázek 5.28: Porovnání moment–rotace
Varianta 1 selhala během zkoušky lomem čistého průřezu T-profilu. Z výpočtů podle AISC bylo zjištěno, že rozhodujícím mezním stavem byl blokový smyk stojiny při použití materiálových vlastností z hutních atestů, zatímco rozhodujícím mezním stavem se stal kluz hrubého průřezu stojiny při použití materiálových vlastností ze zkušebních vzorků pro T-profily. Obdobně analýza v IDEA StatiCa provedená pro oba případy ukázala, že nedostatečná únosnost T-profilu byla způsobem porušení vzorku.
Experimentální pozorování varianty 2 byla podobná pozorováním varianty 1. Způsob porušení byl uveden jako lom čistého průřezu T-profilu. Podle návrhového postupu AISC byl rozhodující mezní stav identifikován jako bloková smyková únosnost T-profilu při zadání materiálových vlastností z hutních atestů pro všechny prvky. V případě použití materiálových vlastností ze zkušebních vzorků pro T-profil byl jako rozhodující mezní stav vypočten kluz hrubého průřezu stojiny. Z obou analýz v IDEA StatiCa bylo zjištěno, že k porušení došlo v T-profilu při 5,0 % plastického přetvoření.
Pro variantu 3, variantu 4 a variantu 5 byl způsob porušení pozorovaný při zkouškách, podle návrhového postupu AISC a z analýz v IDEA StatiCa shodně porušení nosníku. Jelikož k lokálnímu boulení docházelo při cyklickém zatížení, nebyla z experimentu zachycena žádná jednoznačná hodnota únosnosti. Přestože vzorky splňovaly požadavky na boulení (viz přílohy I a J), příčinu lokálního boulení pozorovaného při experimentech lze přičíst nepřesným naměřeným materiálovým vlastnostem uvedeným v testovací zprávě. Vypočtené momentové únosnosti pomocí IDEA StatiCa a podle návrhového postupu AISC a maximální dosažené hodnoty momentu během experimentů jsou znázorněny na obrázku 5.29.
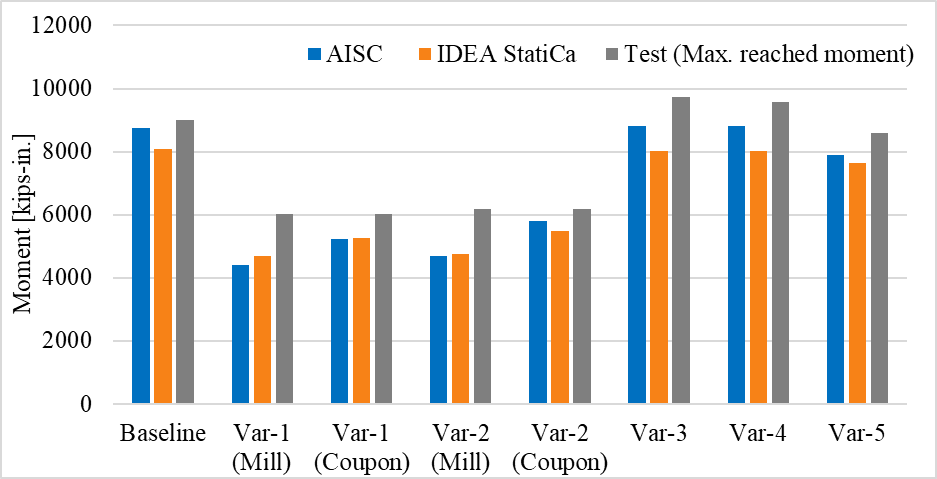
Obrázek 5.29: Momentová únosnost vypočtená pomocí IDEA StatiCa a postupem AISC
Přečtěte si celou studii o předkvalifikovaných přípojích!
Reference
Leon, R. T. (1999). Tests on T-stub connections-SAC phase II-Subtask 7.03. Georgia Institute of Technology.
Smallidge, J. M. (1999). Behavior of bolted beam-to-column T-stub connections under cyclic loading, Ph.D. Thesis, Georgia Institute of Technology, Atlanta, GA.
Swanson, J.A. (1999). Characterization of the Strength, Stiffness, and Ductility Behavior of
T-stub Connections, Ph.D. Thesis, Georgia Institute of Technology, Atlanta, GA.
AISC 358 (2016), „Prequalified Connections for Special and Intermediate Steel Moment Frames for Seismic Applications, including Supplement No. 1," American Institute of Steel Construction ANSI/AISC 358-16, Chicago, Illinois.
AISC 360 (2016), „Specification for Structural Steel Buildings," American Institute of Steel Construction ANSI/AISC 360-16, Chicago, Illinois.
AISC 341 (2016), „Seismic Provisions for Structural Steel Buildings," American Institute of Steel Construction ANSI/AISC 341-16, Chicago, Illinois.
AISC Manual (2017), „Steel Construction Manual," American Institute of Steel Construction, Chicago, Illinois.