Prova unitaria: Semplice prova a flessione su mensole
Introduzione
Questo articolo presenta una prova unitaria per il Metodo del Campo di Tensioni Compatibile 3D (3D-CSFM) applicato a travi a mensola con variazioni di lunghezza, armatura e classi di calcestruzzo. Il 3D-CSFM migliora il consolidato 2D-CSFM, entrambi parte integrante di IDEA StatiCa Detail. Rilasciato in versione beta, il 3D-CSFM aderisce ai principi fondamentali del suo predecessore 2D. La valutazione del modello FEA è attualmente in fase di perfezionamento per garantire che i risultati riflettano accuratamente il comportamento appropriato. Il confronto proviene da una serie di prove unitarie condotte durante il processo di sviluppo e include risultati del 2D-CSFM e norme analitiche dell'Eurocode 2: Progettazione delle strutture in calcestruzzo - Parte 1-1, capitolo 6.1. L'approccio 3D in IDEA StatiCa Detail presenta due classi principali di modelli: l'"elemento parete" e il "blocco solido". Entrambi sono ulteriormente elaborati nell'articolo, utilizzando le impostazioni standard di IDEA StatiCa Detail.
Definizione delle modalità di rottura
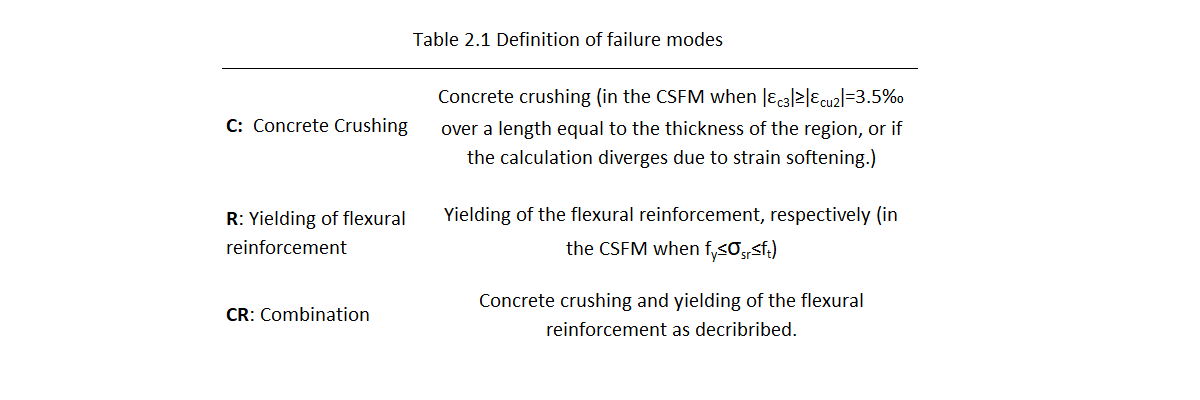
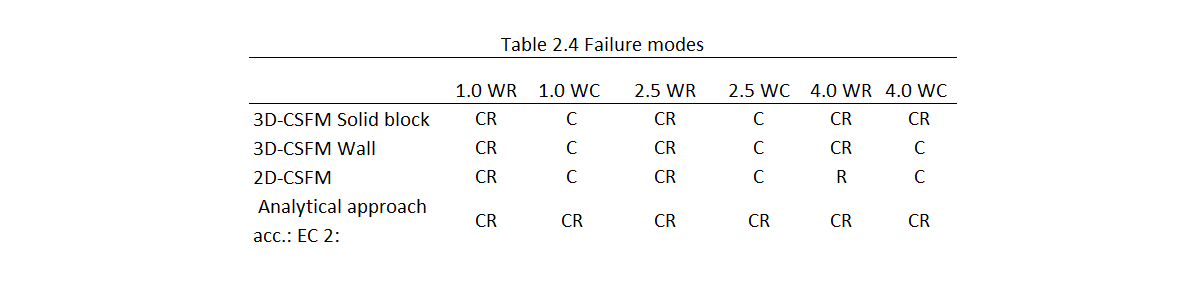
Per valutare le prestazioni del 3D-CSFM in confronto al 2D-CSFM e ai metodi analitici consolidati, classifichiamo le modalità di rottura osservate in tre categorie: schiacciamento del calcestruzzo (C) e snervamento dell'armatura flessionale (R), o una combinazione di queste due (CR). Questa classificazione consente un confronto strutturato dei meccanismi di rottura previsti dai diversi approcci di modellazione. La Tabella 2.1 definisce i tipi di rottura menzionati specificando i valori limite dei materiali. I modelli sono stati progettati specificamente con un'armatura a taglio robusta per escludere la rottura per taglio e concentrarsi esclusivamente sul comportamento a flessione semplice.
Configurazione della prova unitaria
Nelle prove, i carichi sono stati definiti in modo diverso in base al tipo di modello: come carico lineare di 0,3 m all'estremità della trave per il 2D-CSFM e per l'elemento parete 3D-CSFM, come carico superficiale (0,3 x 0,3 m) all'estremità della trave per il blocco solido 3D-CSFM, e come carico concentrato nell'approccio analitico con una posizione corrispondente alla risultante delle forze dei tipi precedenti.
In questi set sono presenti due tipi di configurazione: WC (calcestruzzo debole) WR (armatura debole).
L'armatura flessionale nei modelli era composta da barre di armatura continue con diametro Ø = 20 mm. Il modello WR (armatura debole) utilizzava due barre di armatura, mentre il modello WC (calcestruzzo debole) ne includeva sei. L'armatura a taglio, composta da staffe Ø = 10 mm con interasse di 100 mm, è stata deliberatamente progettata per essere robusta, escludendo così qualsiasi modalità di rottura per taglio. L'armatura a taglio è uniforme per tutti i modelli.
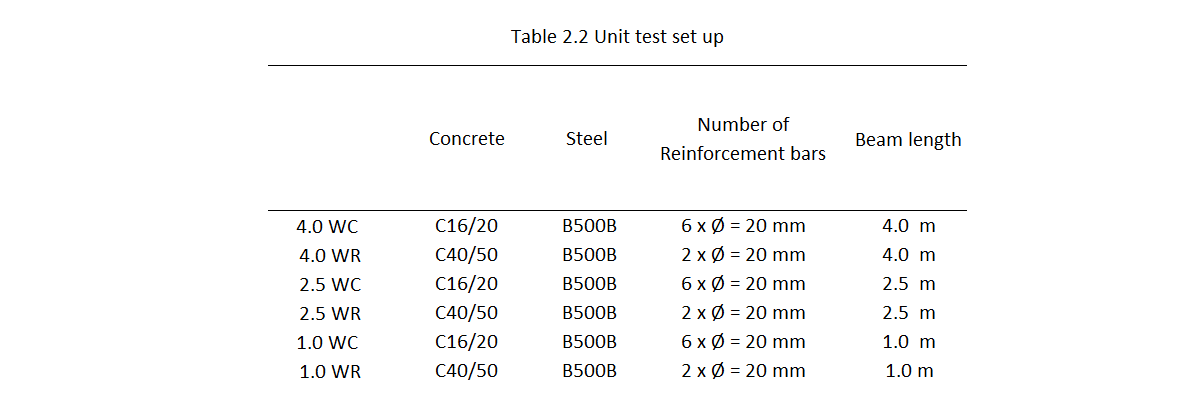
I modelli WC sono in calcestruzzo di classe C16/20 con sei barre di armatura, mentre le configurazioni WR utilizzano calcestruzzo di classe C40/50 con due barre di armatura. Le lunghezze degli esempi di prova variavano, misurando 1,0 m, 2,5 m e 4,0 m.
Considerando tutte le variazioni menzionate, questa prova unitaria ha prodotto sei modelli diversi. Questi modelli sono descritti in dettaglio nella Tabella 2.2.
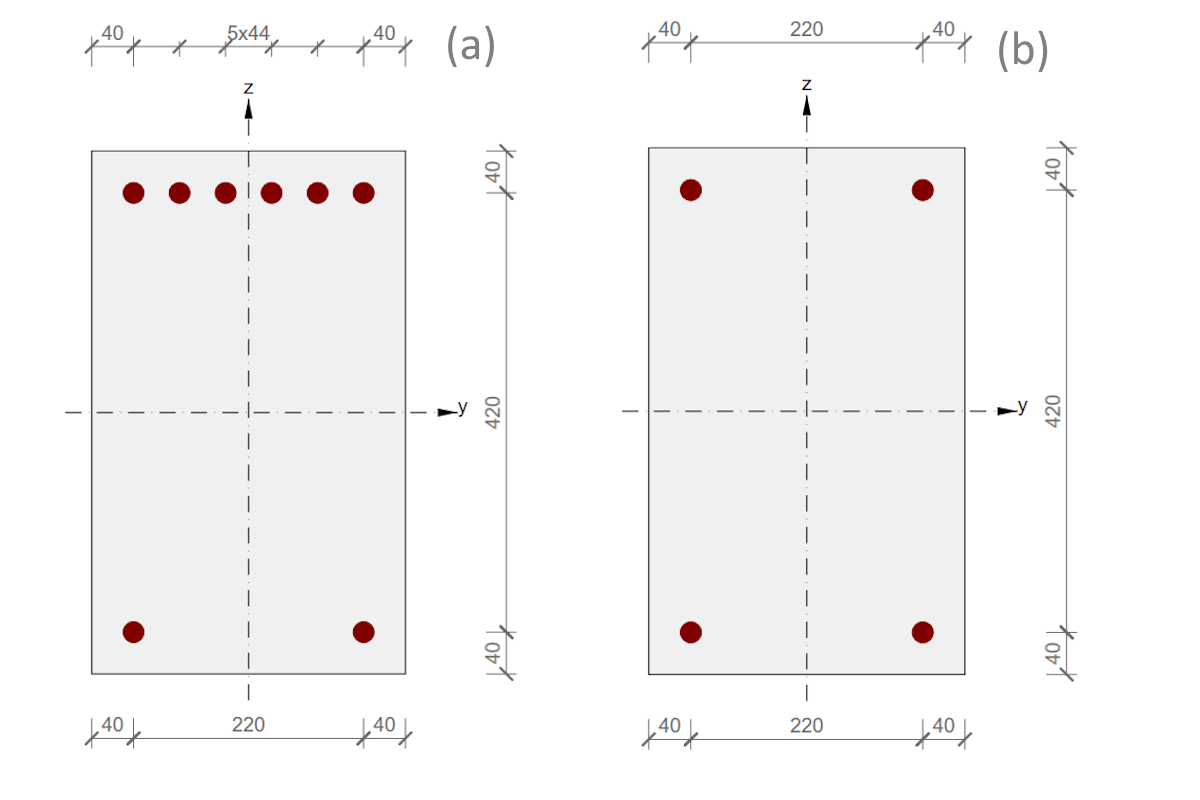
\[ \textsf{\textit{\footnotesize{Fig. 1.1\qquad Cross-section set ups: (a) - WC, (b) - (WR)}}}\]
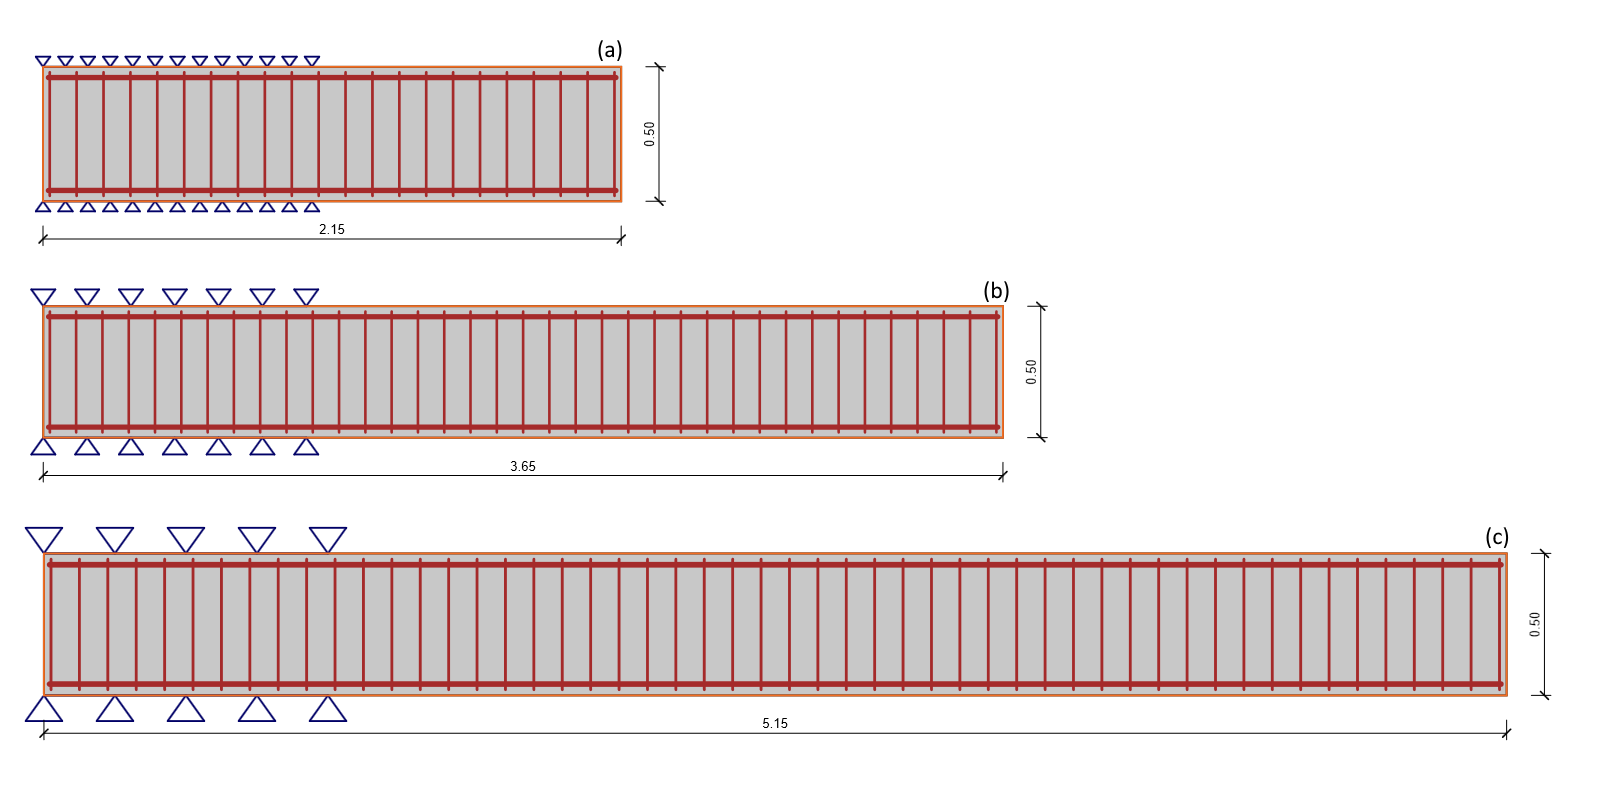
\[ \textsf{\textit{\footnotesize{Fig. 1.2\qquad Length set ups: (a) - 1.0 m, (b) - 2.5 m, (c) - 4.0 m}}}\]
Proprietà dei materiali
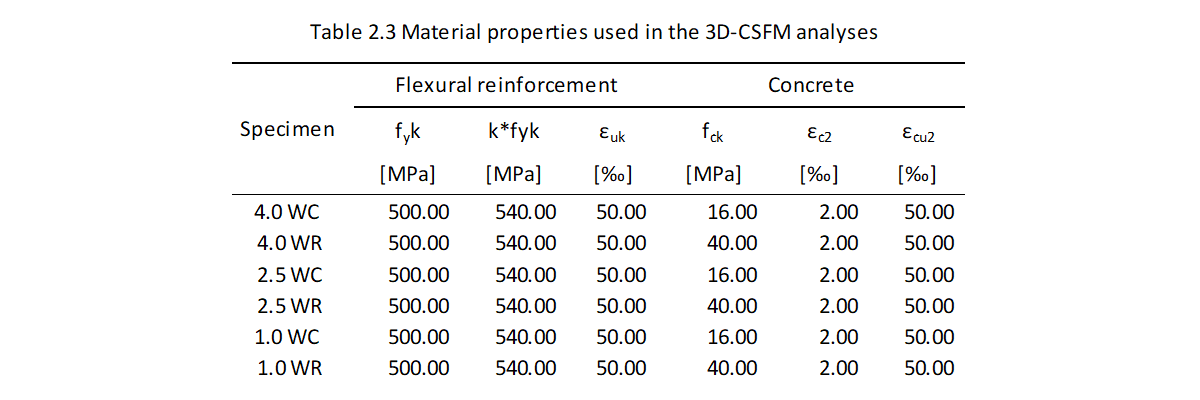
Le proprietà dei materiali del calcestruzzo e dell'armatura flessionale utilizzate nell'analisi CSFM sono riassunte nella Tabella 2.2. La tensione di snervamento (fyk) e la tensione ultima (k*fyk) dell'armatura, nonché la resistenza a compressione (fck), la deformazione plastica (ɛc2) e la deformazione plastica limite (ɛcu2) del calcestruzzo, sono state selezionate per illustrare chiaramente il comportamento dei materiali sotto tensione.
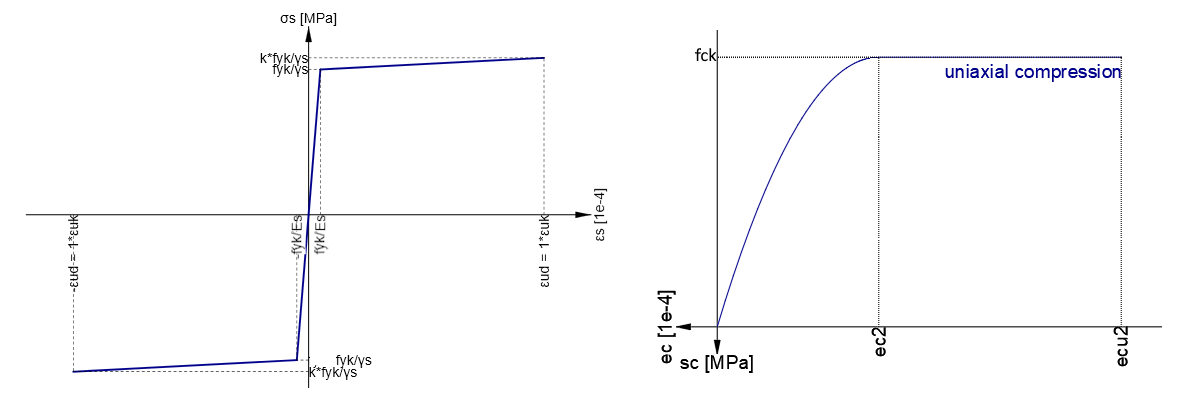
\[ \textsf{\textit{\footnotesize{Fig. 1.3\qquad Stress strain diagrams of materials: (a) Stress-strain diagram of reinforcement B500N, (b) Stress-strain diagram of concrete C16/20 and C40/50 }}}\]
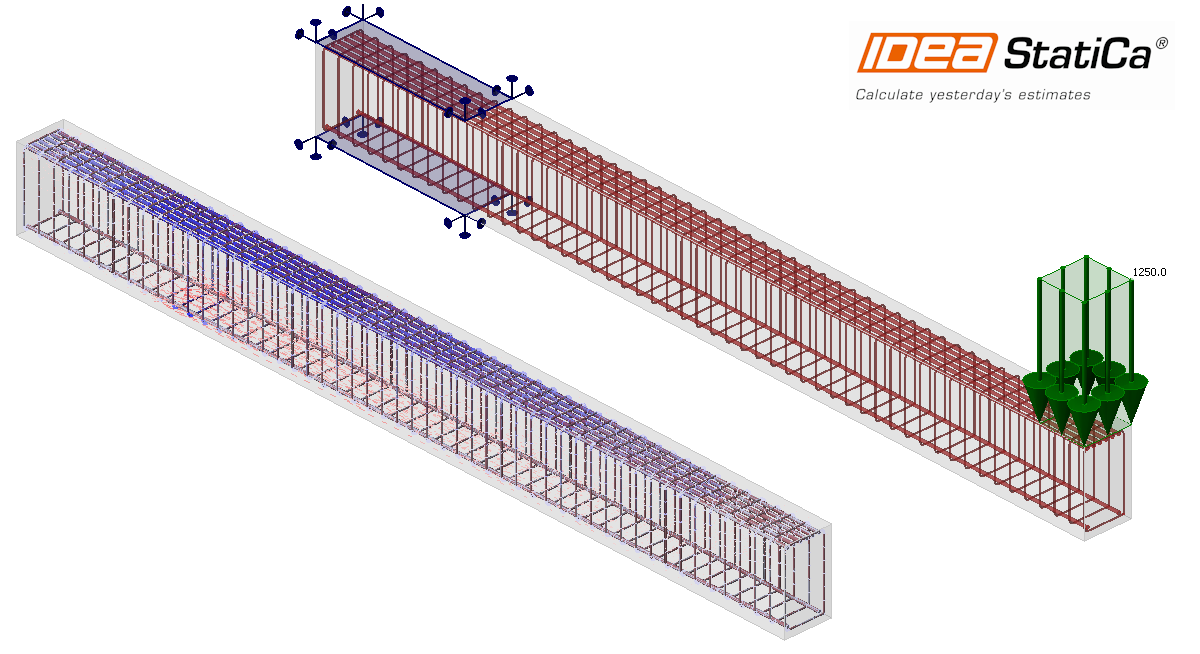
Modellazione con il 3D-CSFM
Nell'applicazione IDEA StatiCa Detail, sono disponibili tipi di modello: il tipo di modello 2D utilizza il metodo CSFM consolidato, mentre il tipo di modello 3D presenta la versione beta di nuova sviluppo del metodo 3D-CSFM. All'interno del tipo di modello 3D, gli utenti possono scegliere tra due classi di modelli: Parete 3D e Blocco Solido.
- Ogni classe di modelli 3D in IDEA StatiCa Detail utilizza un diverso generatore di rete, scelto e ottimizzato specificamente per calcoli rapidi e stabili. La forma e la dimensione degli elementi della rete sono finemente calibrate per migliorare le prestazioni e l'accuratezza dei calcoli del modello.
- Entrambe le classi di modelli 3D in IDEA StatiCa Detail utilizzano elementi tetraedici per la generazione della rete. In particolare, la classe parete 3D presenta elementi di rete con una forma in cui una dimensione è significativamente più piccola delle altre due, rispecchiando efficacemente la forma di una parete. Questa scelta progettuale ottimizza la rete per una rappresentazione e un'analisi accurate di strutture simili a pareti. La classe di modello "Blocco Solido" utilizza elementi di rete di dimensioni generali, progettati per fornire un approccio equilibrato alla generazione della rete adatto a un'ampia varietà di geometrie solide. Questo metodo garantisce un'analisi efficiente ed efficace in diversi scenari.
- Il materiale del modello Parete 3D è progettato come materiale ortotropo. Ciò significa che la tensione di taglio laterale è trasferita dal calcestruzzo, adattandosi ai comportamenti strutturali unici tipici degli elementi parete.
- Per garantire una generazione ottimale della rete per la classe di modello parete 3D, adattata alle strutture a parete, il fattore moltiplicatore della rete è stato regolato a 0,7. Ciò è stato fondamentale per far corrispondere il numero di elementi a quelli della classe di modello blocco solido, configurata per la prova unitaria con le impostazioni predefinite.
Geometria
Nella definizione della geometria del provino testato nell'applicazione IDEA StatiCa Detail (sia in ambiente 2D che 3D), la lunghezza è stata impostata come lunghezza variabile (1,0 m, 2,5 m, 4,0 m) più 1,15 metri aggiuntivi. Su questa lunghezza aggiuntiva di 1,15 metri, i vincoli sono stati definiti sulle superfici superiore e inferiore con rigidezza rigida in tutte le direzioni.
Carichi
Nelle prove, i carichi sono stati definiti in modo diverso in base al tipo di modello. Nel tipo di modello 2D, il carico è stato applicato come carico lineare di 0,3 m all'estremità della trave. Nell'ambiente 3D sulla classe di modello Parete 3D, il carico è stato applicato come carico lineare di 0,3 m all'estremità della trave. Nell'ambiente 3D per la classe di modello blocco solido, il carico è stato applicato come carico superficiale di 0,3 x 0,3 m all'estremità della trave. Nell'approccio analitico, è stato utilizzato un carico concentrato, posizionato in corrispondenza della risultante delle forze derivata dagli altri tipi di modello.
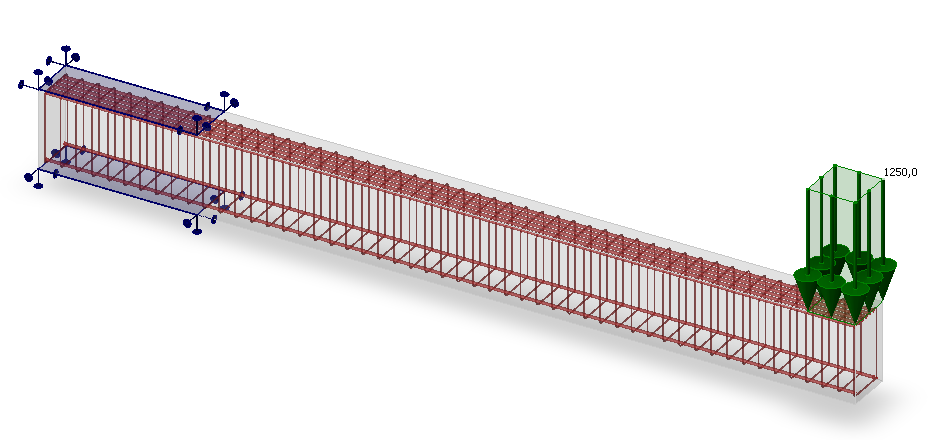
\[ \textsf{\textit{\footnotesize{Fig. 1.4\qquad Surface load on Specimen: 3D Solid Block WC 4.0}}}\]
Carico critico calcolato
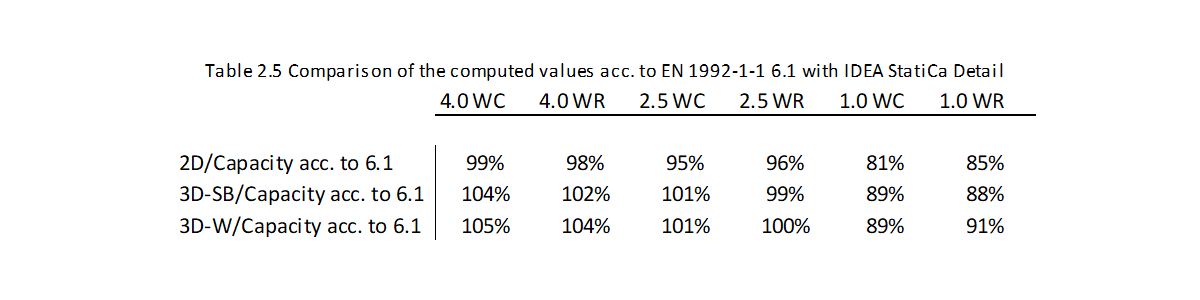
Nella figura di confronto 1.5, che presenta sei varianti di modello distinte per lunghezza e opzioni WC (calcestruzzo debole) e WR (armatura debole), i metodi 3D mostrano generalmente una buona corrispondenza. In particolare, il fattore di rete della classe di modello Parete 3D è stato regolato a 0,7 per uniformare il numero di elementi sull'altezza del modello, rendendolo comparabile al modello generale blocco solido. I risultati 3D sono leggermente superiori alle soluzioni 2D CSFM, come previsto a causa dell'inclusione delle tensioni triassiali e delle semplificazioni nel 2D CSFM. I risultati analitici sono in linea con il 3D e il 2D CSFM nella maggior parte dei casi, ad eccezione di valori più elevati negli scenari brevi WC e WR da 1,0 m, dove le interazioni a taglio (puntone compresso in compressione) hanno un impatto significativo ma vengono trascurate analiticamente, spiegando i valori inferiori dei modelli 3D. Ciò è corroborato dai risultati del 2D CSFM.
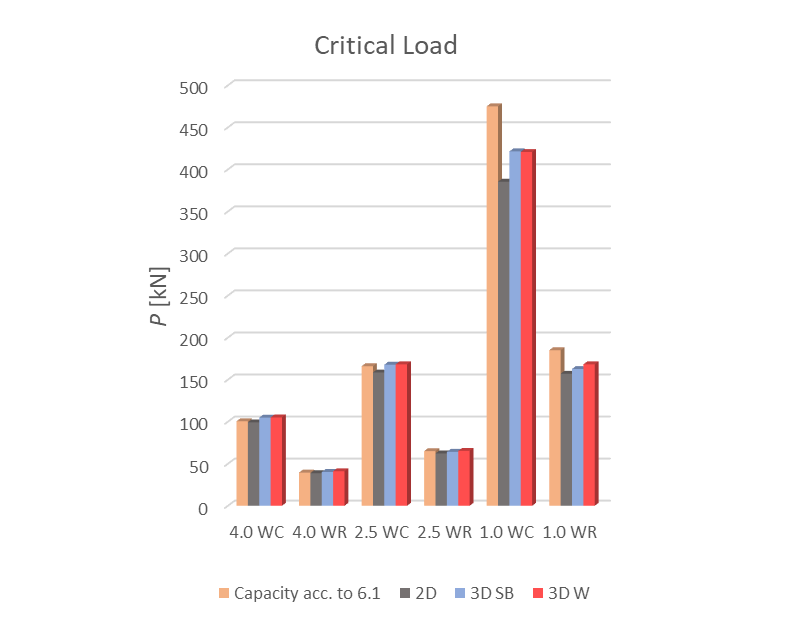
\[ \textsf{\textit{\footnotesize{Fig. 1.5\qquad Calculated Critical Load}}}\]
Risposta carico-deformazione
Il confronto dei diagrammi tra le diverse metodologie rivela schemi di comportamento distinti per ciascuna. Il 2D-CSFM è rappresentato con una linea tratteggiata nera, la classe di modello Parete 3D-CSFM con una linea continua rossa, la classe di modello Blocco Solido 3D-CSFM con una linea tratteggiata blu, e l'approccio standard basato sulla verifica della sezione secondo EN con una linea continua arancione. Lo spostamento e le forze sono stati misurati dall'estremità della mensola.
Nei diagrammi, i risultati analitici sono rappresentati da una linea costante, indicando che si ottiene un unico valore per la resistenza flessionale del provino considerato. Questa rappresentazione sottolinea la natura statica dei risultati analitici in contrasto con l'approccio incrementale per la soluzione non lineare.
Nella Figura 1.6, si è riscontrata una forte correlazione tra i risultati del 3D-CSFM e del 2D-CSFM in tutte le prove, con un buon allineamento nell'intervallo dei dati di misura disponibili. L'approccio analitico, tuttavia, ha mostrato valori di forza più elevati, previsti a causa della mancata considerazione dell'interazione con la resistenza a taglio, particolarmente significativa data la lunghezza di 1,0 m della trave. Ciò evidenzia i limiti del metodo analitico nel cogliere pienamente le forze complessive che agiscono sul provino.
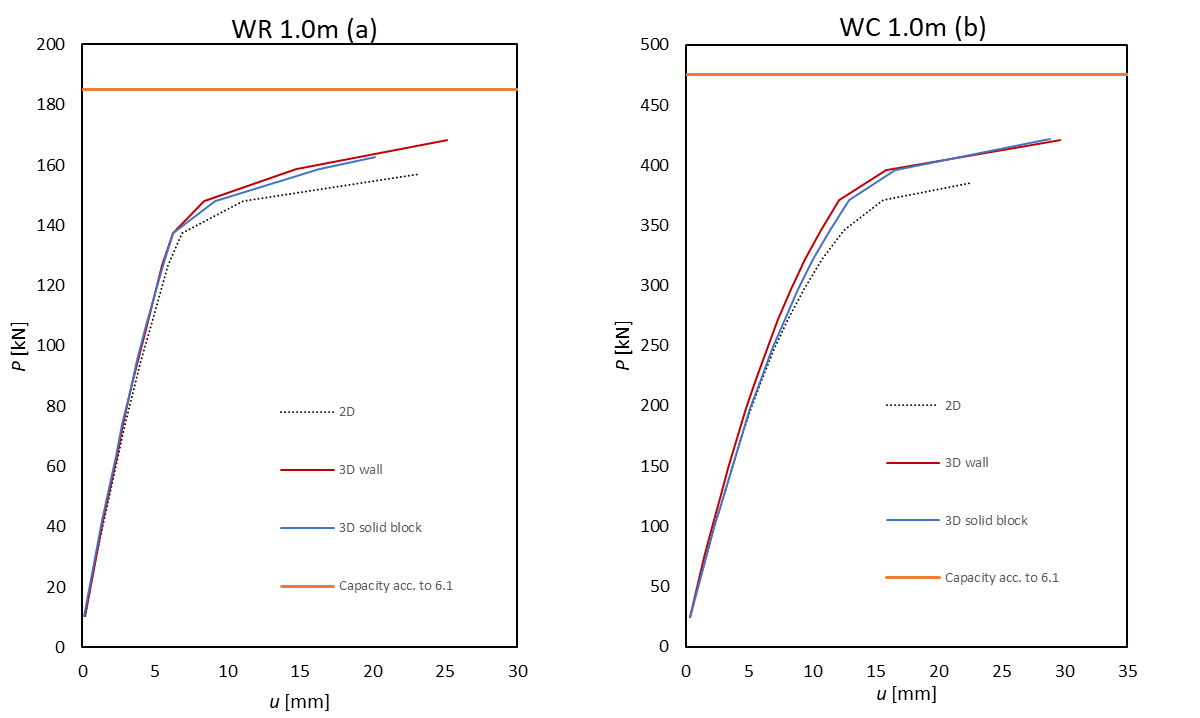
\[ \textsf{\textit{\footnotesize{Fig. 1.6\qquad Calculated Load-Deformation respond: (a) WR 1.0, (b) WC 1.0 }}}\]
Nella Figura 1.7, che illustra le risposte carico-deformazione per modelli con una lunghezza di 2,5 metri, tutti i metodi mostrano un'ottima corrispondenza nei risultati. Entrambi i modelli 3D si allineano strettamente ai risultati analitici calcolati secondo EN. In confronto, il metodo 3D mostra valori leggermente superiori alla soluzione 2D CSFM, tuttavia queste differenze rimangono entro un margine tollerabile.
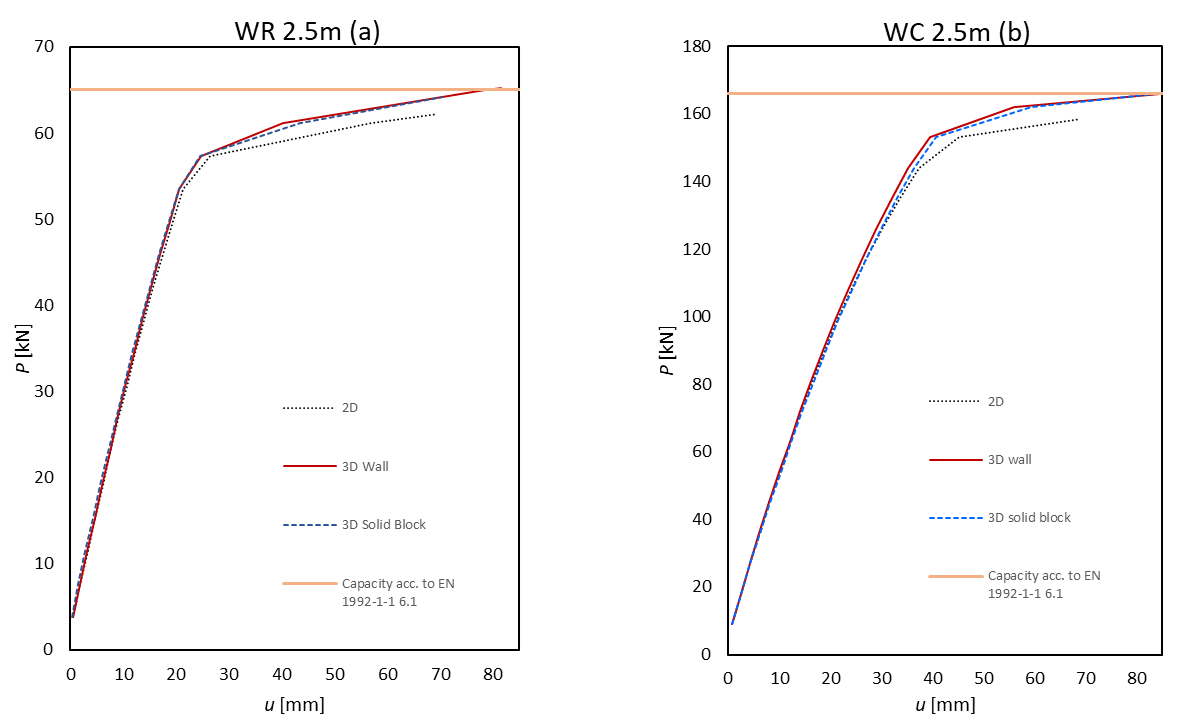
\[ \textsf{\textit{\footnotesize{Fig. 1.7\qquad Calculated Load-Deformation respond: (a) WR 2.5, (b) WC 2.5}}}\]
Nell'ultima Figura 1.8, si osserva una buona correlazione tra i metodi, con i modelli 3D che mostrano valori più elevati rispetto a entrambi i risultati di riferimento. Queste variazioni, tuttavia, rimangono entro limiti accettabili.
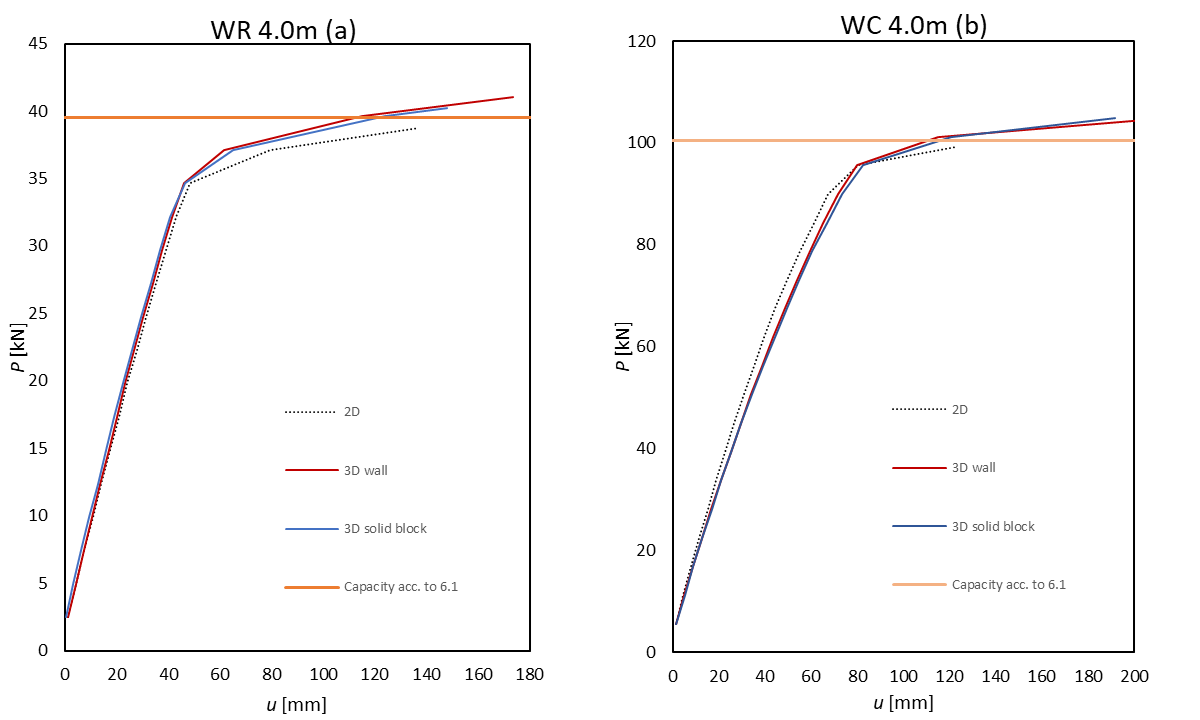
\[ \textsf{\textit{\footnotesize{Fig. 1.8\qquad Calculated Load-Deformation respond: (a) WR 4.0, (b) WC 4.0}}}\]

\[ \textsf{\textit{\footnotesize{Fig. 1.9\qquad Calculated value of reinforcement stress on WR 4.0 different model types: (a) 2D, (b) 3D - Solid Block, (c) 3D - Wall}}}\]
Conclusione
Data la stretta corrispondenza tra i risultati del 3D-CSFM e quelli del 2D-CSFM e dei metodi analitici, è possibile trarre diverse conclusioni:
- Il 3D-CSFM di nuova sviluppo, sebbene ancora in versione beta, sta già dimostrando risultati promettenti.
- Nella risposta carico-deformazione e nelle valutazioni del carico critico, il 3D-CSFM mostra un forte allineamento con l'approccio analitico nei casi in cui gli effetti di taglio sono minimi. Tuttavia, negli scenari in cui le interazioni a taglio influenzano significativamente la resistenza strutturale, si osserva una diminuzione della resistenza. Questo è un risultato atteso e conferma che il solutore funziona correttamente.
- Nell'analisi di una trave a mensola soggetta a flessione semplice, entrambe le classi di modelli 3D — l'Elemento Parete e il Blocco Solido — mostrano un comportamento simile. Questa coerenza sottolinea la robustezza dell'approccio 3D-CSFM nella modellazione di tali scenari strutturali.