La progettazione dei collegamenti può essere difficile da insegnare, data la natura dettagliata dell'argomento e il comportamento fondamentalmente tridimensionale della maggior parte dei collegamenti. Tuttavia, i collegamenti sono di importanza critica, e le lezioni apprese nello studio della progettazione dei collegamenti, inclusi il percorso dei carichi e l'identificazione e valutazione dei modi di rottura, sono di carattere generale e applicabili alla progettazione strutturale in senso ampio. IDEA StatiCa utilizza un rigoroso modello di analisi non lineare e dispone di un'interfaccia di facile utilizzo con una visualizzazione tridimensionale dei risultati (ad es., forma deformata, tensione, deformazione plastica) ed è quindi particolarmente adatta all'esplorazione del comportamento dei collegamenti in acciaio strutturale. Facendo leva su questi punti di forza, è stata sviluppata una serie di esercizi guidati che utilizzano IDEA StatiCa come laboratorio virtuale per aiutare gli studenti ad apprendere i concetti relativi al comportamento e alla progettazione dei collegamenti in acciaio strutturale. Questi moduli di apprendimento erano principalmente destinati a studenti universitari avanzati e a studenti di dottorato, ma sono stati resi adatti anche agli ingegneri professionisti. I moduli di apprendimento sono stati sviluppati presso il Laboratory for Numerical Structural Design dal Professor Assistente Martin Vild dell' Università Tecnica di Brno.
Obiettivo di apprendimento
Dopo aver svolto questo esercizio, il discente dovrebbe essere in grado di descrivere il componente di base dei collegamenti bullonati, il T-stub e i fenomeni associati, come la forza di leva.
Contesto teorico
Il metodo delle componenti secondo EN 1993-1-8 suddivide il collegamento in componenti. Il componente di base dei collegamenti bullonati, ampiamente utilizzato per i giunti di assemblaggio, è il T-stub. La forma del T-stub varia in funzione della sua posizione nel collegamento, ma il calcolo rimane molto simile. Anche un collegamento con piastra d'estremità rastremata così complesso viene suddiviso in otto file di T-stub. Ciascun T-stub viene calcolato singolarmente o come parte di un gruppo di bulloni, e la resistenza ultima a momento è la somma della resistenza a trazione del T-stub moltiplicata per il braccio della leva rispetto al centro di compressione.

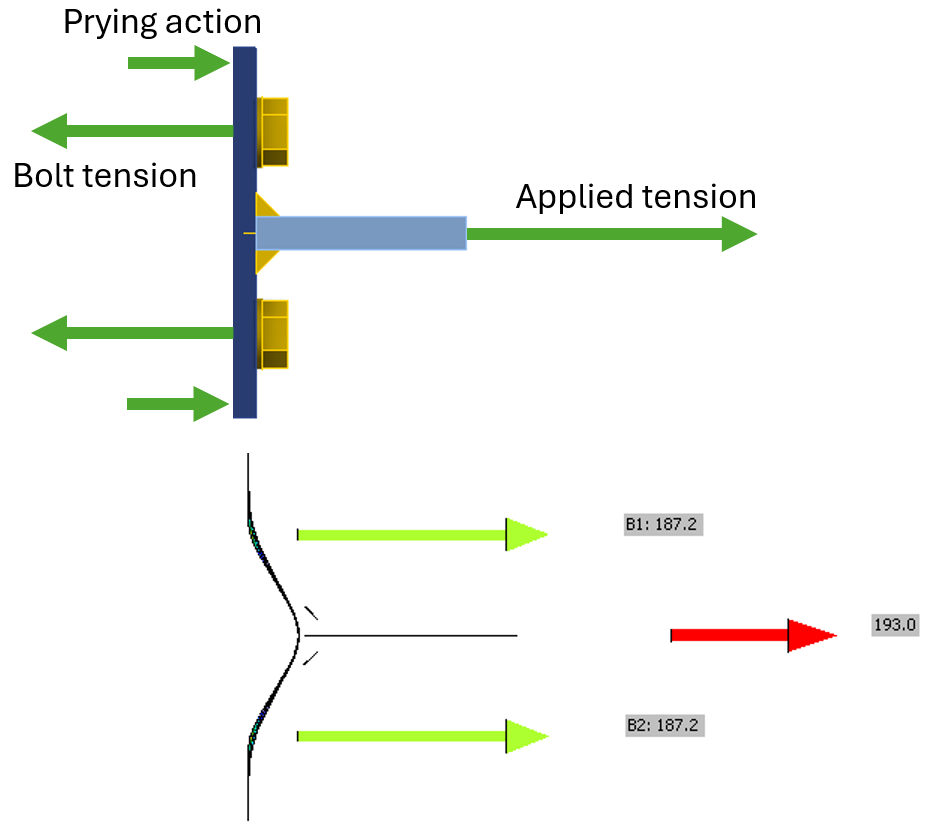
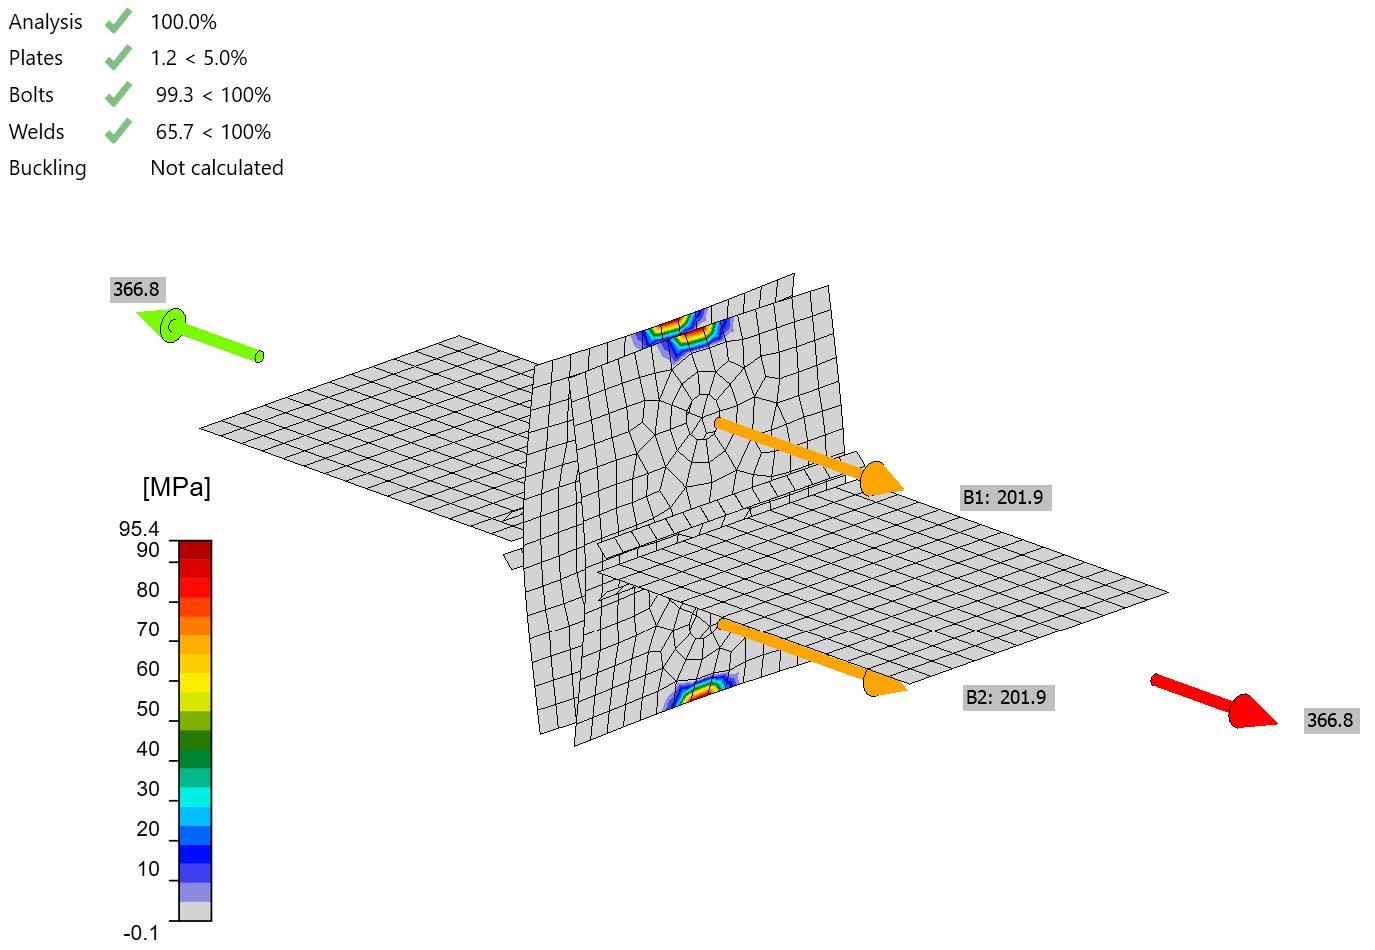
Una caratteristica tipica dei T-stub è la forza di leva. La somma delle trazioni nei bulloni è superiore alla trazione applicata al T-stub. Ciò è causato dall'effetto leva – un'azione di appoggio delle piastre sul supporto, tipicamente un altro T-stub, in questo caso costituito dall'ala e dall'anima del pilastro. Si noti che la somma delle forze di trazione nei bulloni nella figura seguente è \(2 \cdot 187.2 = 374.4\) kN, significativamente superiore ai 193 kN della forza applicata.
L'entità della forza di appoggio dipende dalla rigidezza e dalla resistenza degli elementi collegati e dei bulloni.
- Se la piastra d'estremità è molto sottile, cederà plasticamente sia in prossimità della saldatura che in prossimità della fila di bulloni, e la resistenza della piastra d'estremità sarà determinante anche considerando la trazione aggiuntiva nei bulloni dovuta alla forza di leva. L'Eurocodice descrive questo come modo di rottura 1.
- Se la piastra d'estremità è molto spessa, non si fletterà abbastanza da superare l'allungamento del bullone, e la piastra d'estremità non entrerà in contatto con l'ala del pilastro. In questo caso non vi è forza di leva, la resistenza dei bulloni sarà determinante e un'analisi semplice è sufficiente per stimare la forza nei bulloni. L'Eurocodice descrive questo come Modo 3.
- Per spessori della piastra d'estremità compresi tra questi estremi, la resistenza flessionale delle squadrette e la resistenza a trazione dei bulloni possono essere determinanti simultaneamente.
Nell'Eurocodice 3 (CEN, 2005), questi diversi comportamenti sono denominati "Modo 1: Plasticizzazione completa dell'ala"; "Modo 2: Rottura dei bulloni con plasticizzazione dell'ala"; e "Modo 3: Rottura dei bulloni" e corrispondono rispettivamente a elementi di collegamento sottili, intermedi e spessi.
Le equazioni per la valutazione della forza di leva sono incluse nell'Eurocodice EN 1993-1-8, punto 6.2.4. Queste equazioni possono essere utilizzate per valutare efficacemente la forza di leva, ma impiegano parametri astratti che oscurano il comportamento fisico. Questo esercizio è inteso ad aiutare a sviluppare un'intuizione fisica sulla forza di leva.
Collegamento
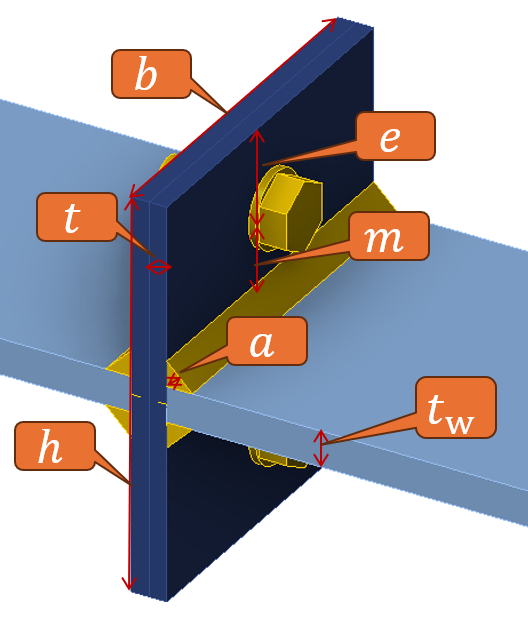
Il collegamento esaminato in questo esercizio è l'esempio di base di due T-stub identici orientati schiena contro schiena. Il caso di base è costituito da due piastre d'estremità (o ali del T-stub) con le dimensioni \(b \cdot h = 200 \cdot 220\) mm e uno spessore di \(t = 20\) mm. Le piastre tese (o anime del T-stub) hanno uno spessore di 20 mm. Tutti gli elementi sono in acciaio di grado S355. Saldature d'angolo doppie con spessore di gola di 10 mm collegano le anime alle ali del T-stub. Le ali del T-stub sono collegate da bulloni M24 8.8 (\(d = 24\) mm, \(f_u = 800\) MPa). I bulloni si trovano al centro del T-stub e la loro distanza dal bordo è \(e = 50\) mm.
Procedura
La procedura per questo esercizio presuppone che il discente abbia una conoscenza operativa di come utilizzare IDEA StatiCa (ad es., come navigare nel software, definire e modificare le operazioni, eseguire le analisi e consultare i risultati). Le indicazioni su come acquisire tale conoscenza sono disponibili sul sito web di IDEA StatiCa (https://www.ideastatica.com/).
Recuperare il file IDEA StatiCa per il collegamento di esempio fornito con questo esercizio. Aprire il file in IDEA StatiCa. Per svolgere l'esercizio, seguire la narrazione, completare i compiti e rispondere alle domande.
Al discente vengono forniti due file di supporto:
- T-stub calculation-Calcpad.zip – un calcolo manuale in open-source Calcpad
- T-stub.py – un codice Python per l'automazione di IDEA StatiCa tramite la sua API
L'esecuzione di questi file non è obbligatoria per completare il modulo di apprendimento, ma accelera il calcolo manuale.
1. Calcolare la resistenza di progetto a trazione di un singolo bullone M24 8.8, il tipo di bullone utilizzato nel collegamento.
2. Calcolare la resistenza di progetto a trazione del collegamento assumendo che la resistenza dei bulloni sia determinante e che non vi sia forza di leva.
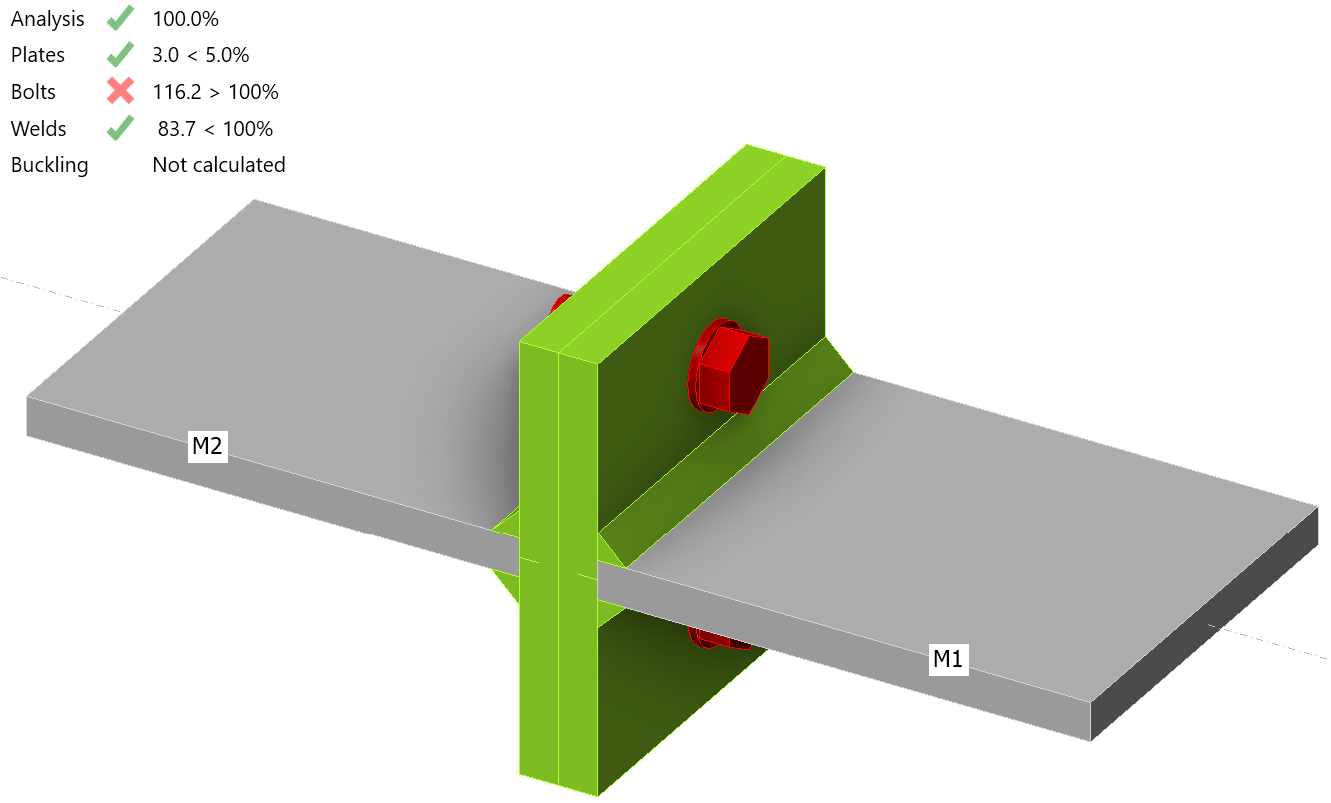
3. Con lo spessore della piastra dell'ala impostato a 20 mm, applicare il carico determinato al passo 2 al collegamento in IDEA StatiCa ed eseguire un'analisi. Il collegamento è in grado di sopportare il carico?
No. L'analisi raggiunge solo il 90,2% a condizione che l'opzione Arresta allo stato limite sia attivata nelle Impostazioni del progetto.

Lo sfruttamento massimo dei bulloni è del 116,2% a condizione che l'opzione Arresta allo stato limite sia disattivata.
4. Se il collegamento non è in grado di sopportare il carico, determinare il carico massimo che il collegamento può sopportare.
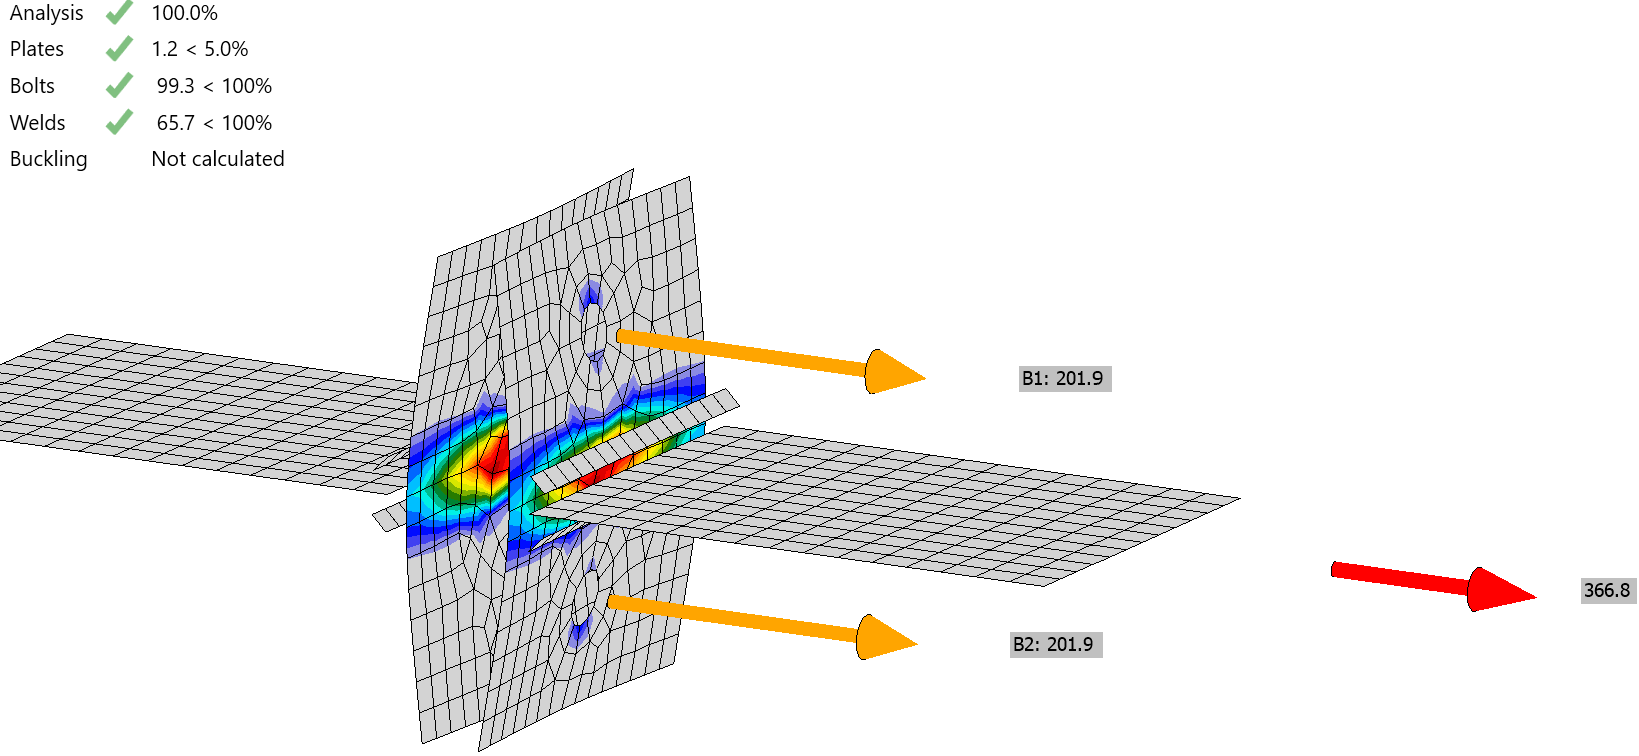
5. Al carico massimo che il collegamento può sopportare, qual è la forza di trazione massima nei bulloni?
Entrambi i bulloni hanno 201,9 kN in trazione, il che significa che sono al loro limite.
6. Quale parte della trazione nel bullone può essere attribuita alla forza applicata?
7. Determinare la forza di appoggio totale tra le piastre di flangia. Confrontare questo valore con la tensione di appoggio (ovvero, la tensione nei contatti).
La forza di appoggio in corrispondenza di ogni bullone è 201,9 kN – 183,4 kN = 18,5 kN e 37 kN in totale.
La tensione si sviluppa su un'area di circa 2 × (10 mm) × (40 mm) = 800 mm\(^2\), risultando in una tensione stimata di 37 kN / 800 mm\(^2\) = 46,25 MPa.
La tensione di appoggio massima (ovvero, la tensione nei contatti) è 95,4 MPa. La tensione di appoggio media oltre la linea dei bulloni risulta essere circa 45 MPa, coerente con la tensione stimata.
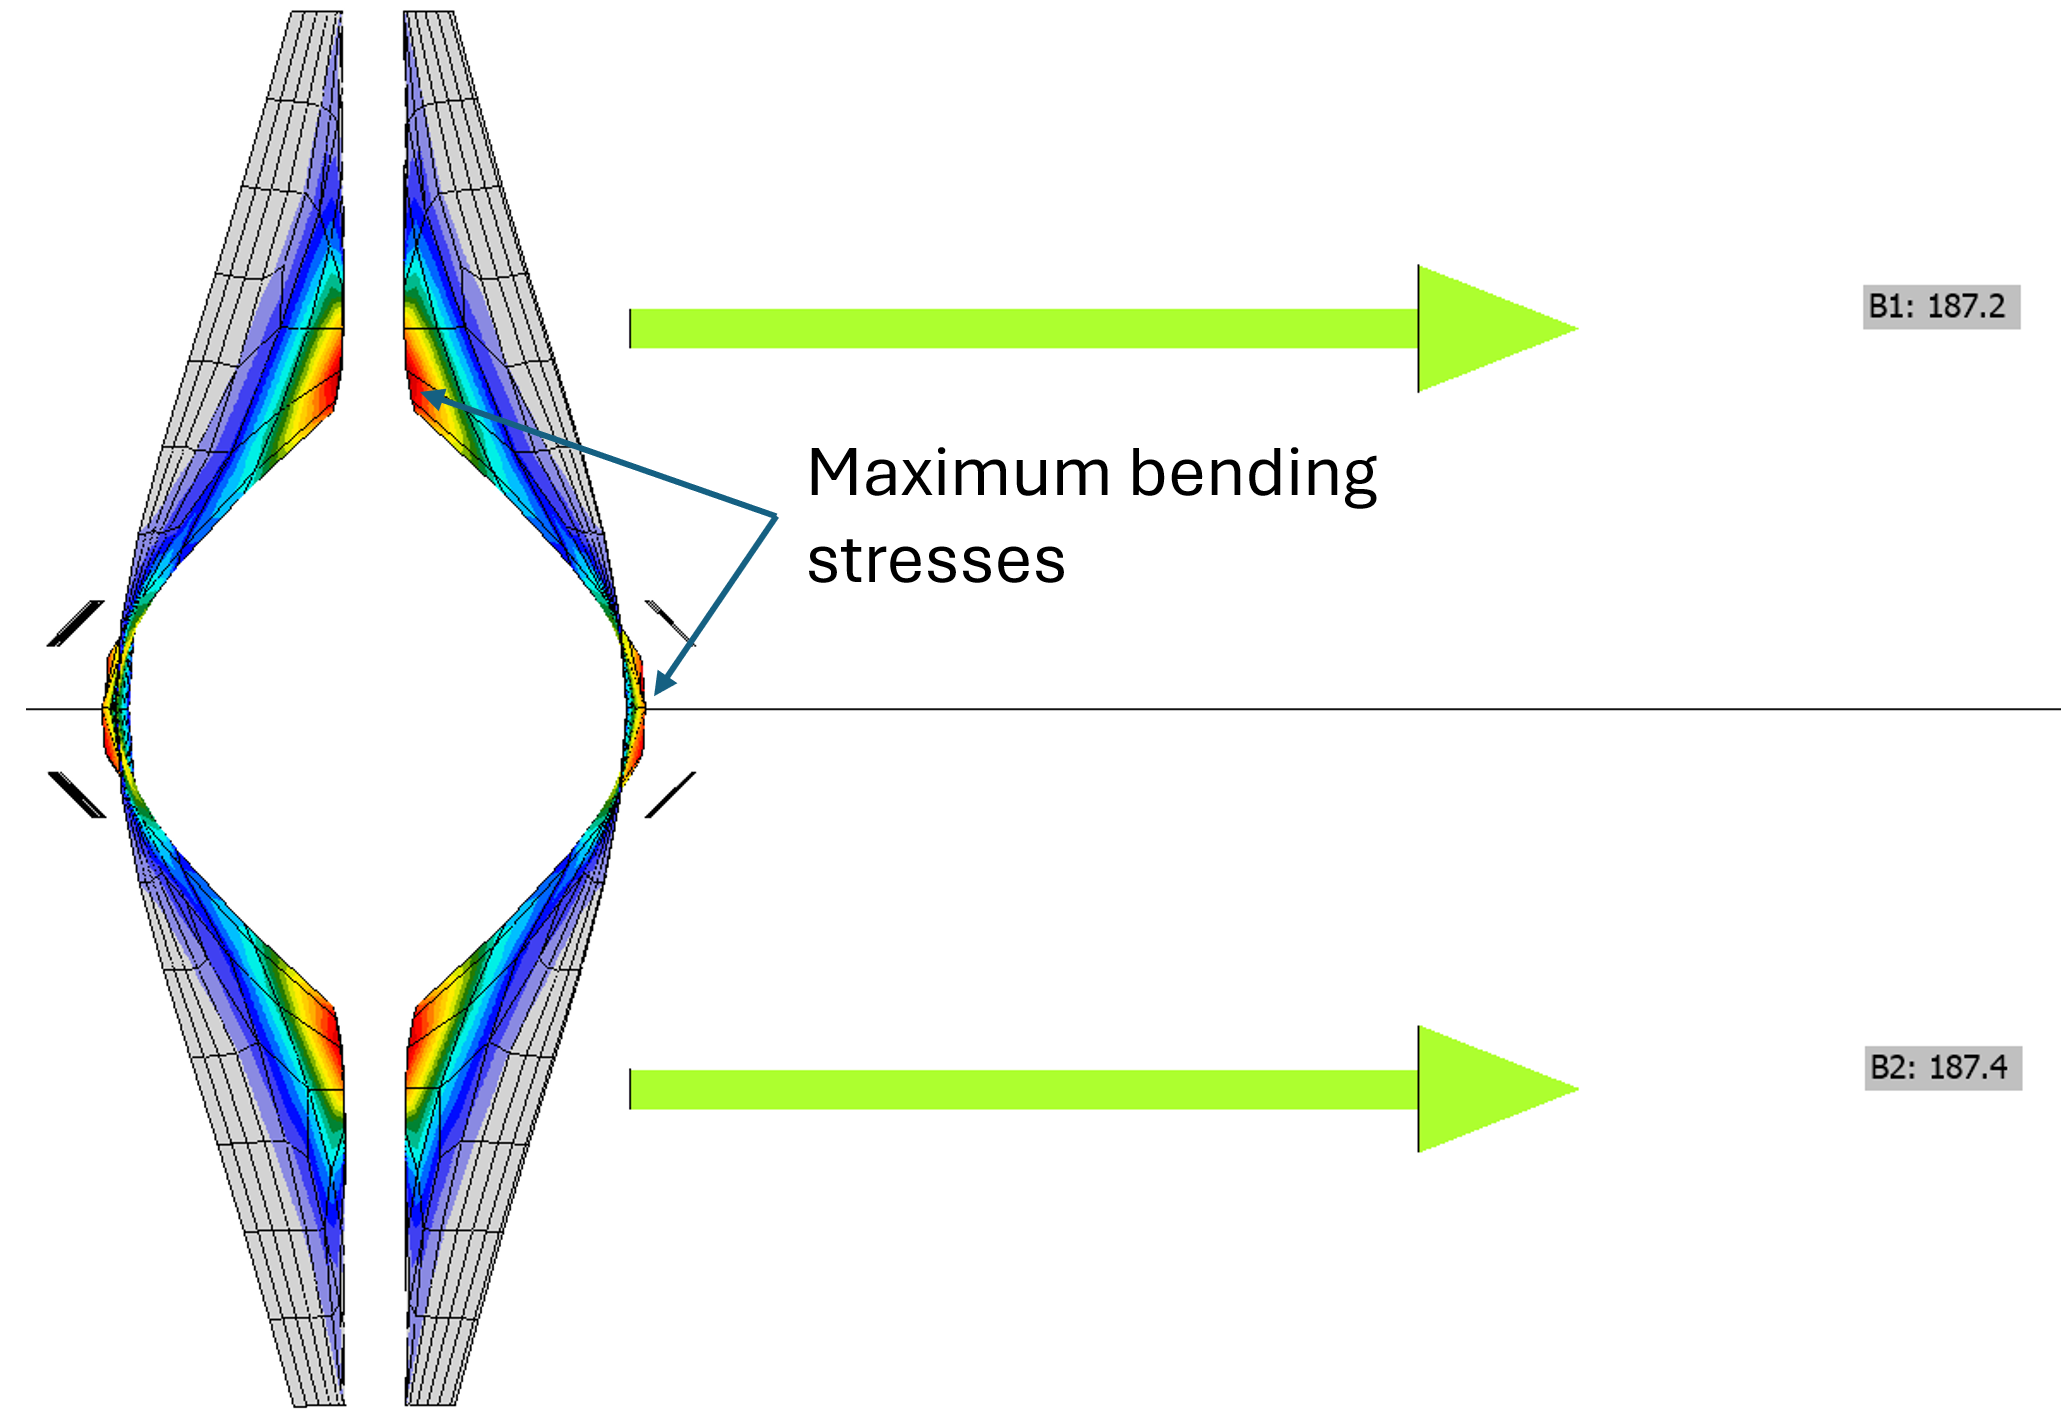
8. Schizzare la forma deformata della piastra dell'ala e identificare dove le tensioni di flessione sono maggiori.
La piastra dell'ala è in curvatura semplice. Le tensioni di flessione maggiori si trovano nella piastra dell'ala in corrispondenza della piastra dell'anima.

9. Ripetere i passaggi da 3 a 8, ma con lo spessore della piastra d'estremità impostato a 10 mm.
Il collegamento può sopportare un carico molto inferiore con piastre di flangia più sottili.
La forza massima che può essere trasferita tramite questo T-stub è 172 kN. La deformazione plastica nelle piastre di flangia controlla ora la resistenza. Lo sfruttamento dei bulloni è del 92%.
In media vi sono 187,3 kN nei bulloni, per un totale di 374,6 kN. Il 46% è attribuito alla forza applicata e il 54% alle forze di leva.
Le piastre di flangia sono ora in doppia curvatura. Le maggiori tensioni flessionali si trovano in prossimità della piastra d'anima e in corrispondenza dei bulloni.
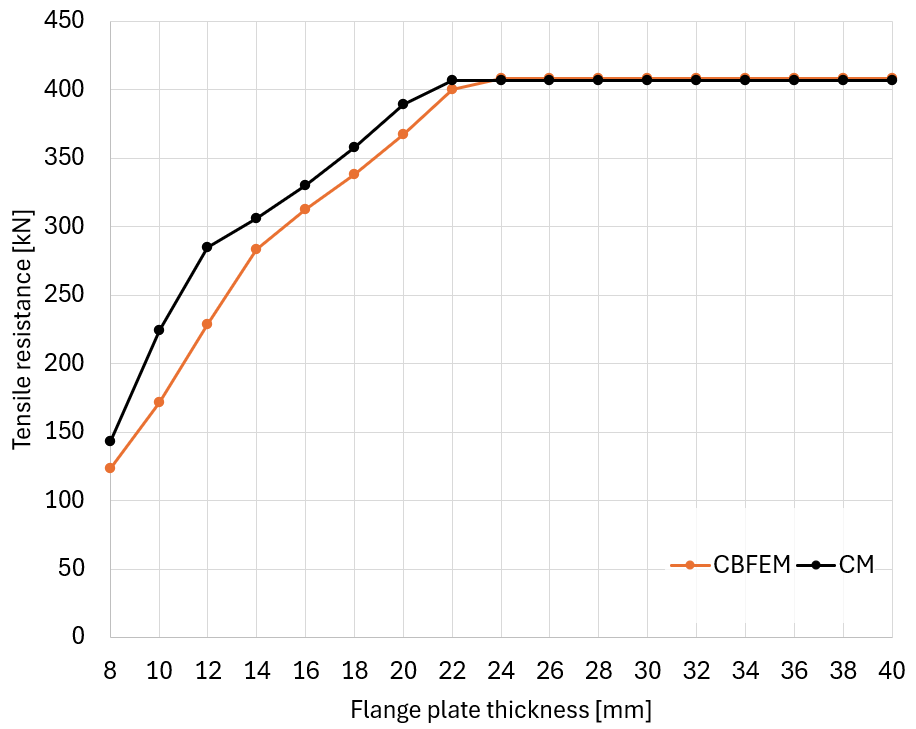
Completare la tabella seguente determinando la forza massima che il collegamento può sopportare per una varietà di spessori della piastra d'ala, quindi registrare tale forza insieme alla deformazione plastica massima e allo sfruttamento massimo dei bulloni a quella forza.
| Spessore della piastra d'ala [mm] | Forza massima [kN] | Deformazione plastica massima [%] | Sfruttamento dei bulloni [%] |
| 8 | 123.0 | 4.16 | 90.9 |
| 10 | |||
| 12 | 228.5 | 4.87 | 97.4 |
| 14 | 283.2 | 4.03 | 99.5 |
| 16 | 312.5 | 1.90 | 99.4 |
| 18 | 337.9 | 1.40 | 99.3 |
| 20 | |||
| 22 | 400.4 | 1.20 | 99.8 |
| 24 | 408.2 | 0.32 | 99.6 |
| 26 | 408.2 | 0.11 | 99.6 |
| 28 | 408.2 | 0.05 | 99.6 |
| 30 | |||
| 32 | 408.2 | 0.00 | 99.6 |
| 34 | 408.2 | 0.00 | 99.6 |
| 36 | 408.2 | 0.00 | 99.6 |
| 38 | 408.2 | 0.00 | 99.6 |
| 40 |
10. Cosa noti di questi risultati?
La resistenza del collegamento aumenta, diminuisce o rimane invariata quando le seguenti dimensioni vengono aumentate? Considerare come la risposta potrebbe essere diversa per diversi spessori della piastra d'ala.
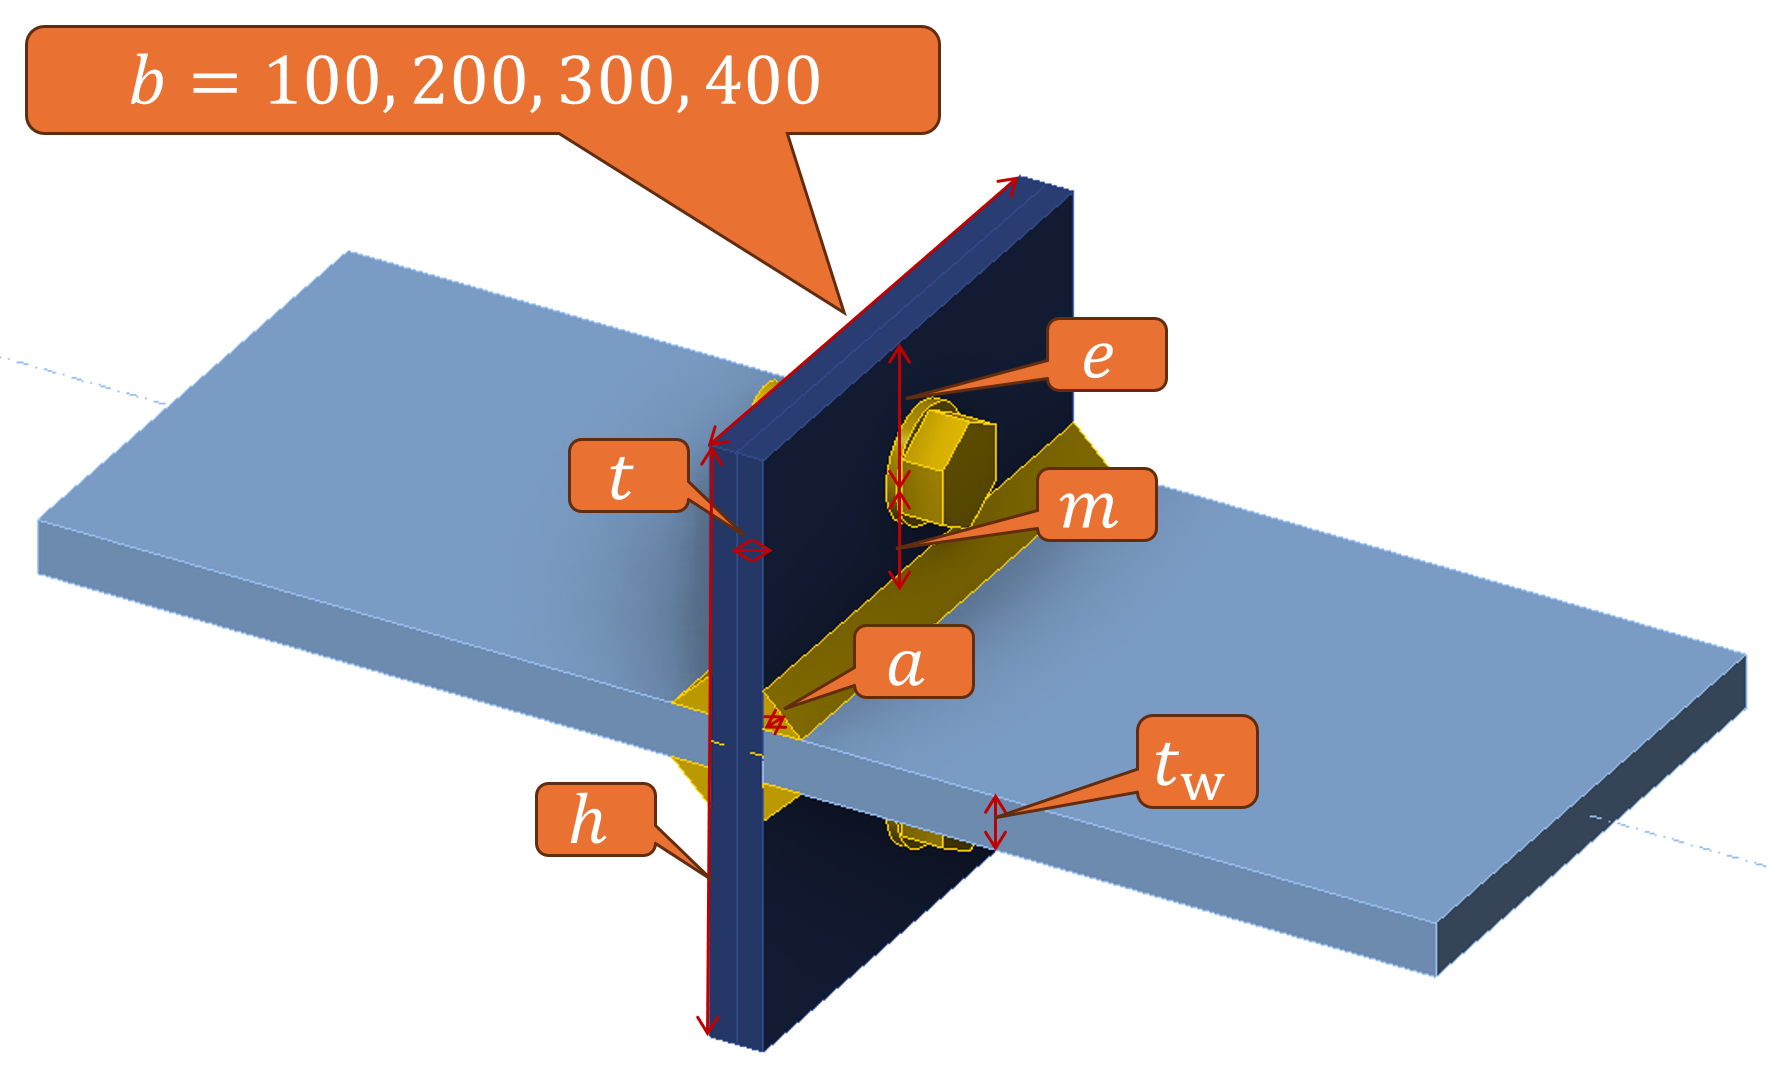
11. La larghezza del T-stub
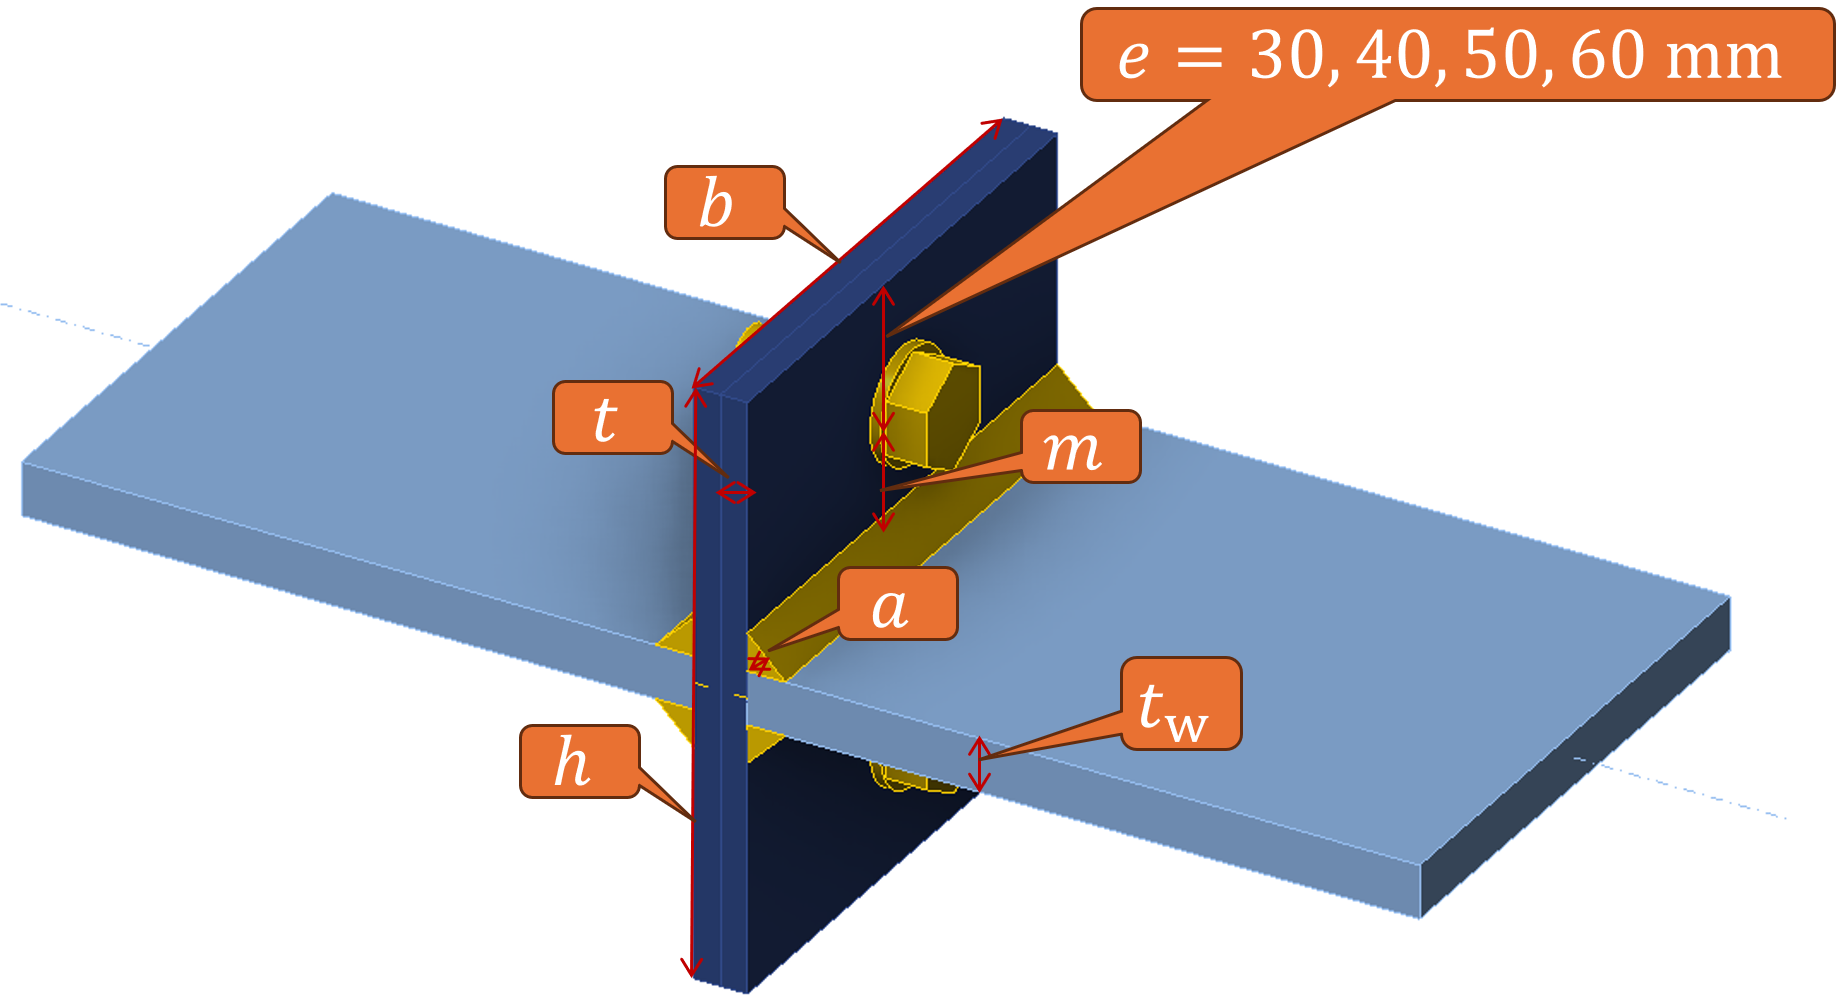
12. La distanza dalle linee dei bulloni al bordo della piastra d'ala.
13. Il diametro dei bulloni.
14. Calcolare la resistenza e il modo di rottura del collegamento utilizzando le equazioni equivalenti del T-stub in EN 1993-1-8 (Tabella 6.2) per spessori della piastra di flangia da 8 a 40 mm. In che modo differiscono le resistenze di IDEA StatiCa e dell'EC? Quali sono le possibili ragioni delle differenze?
Il modo di rottura secondo il CBFEM è stimato dalla deformazione plastica. Per deformazioni plastiche superiori al 3%, viene selezionato il modo di rottura 1; per deformazioni plastiche comprese tra 0,3% e 3%, viene selezionato il modo di rottura 2. Per deformazioni plastiche molto ridotte, inferiori allo 0,3%, viene selezionato il modo di rottura 3. Ciò può essere stimato con maggiore precisione osservando le linee di snervamento e le forze nei bulloni.
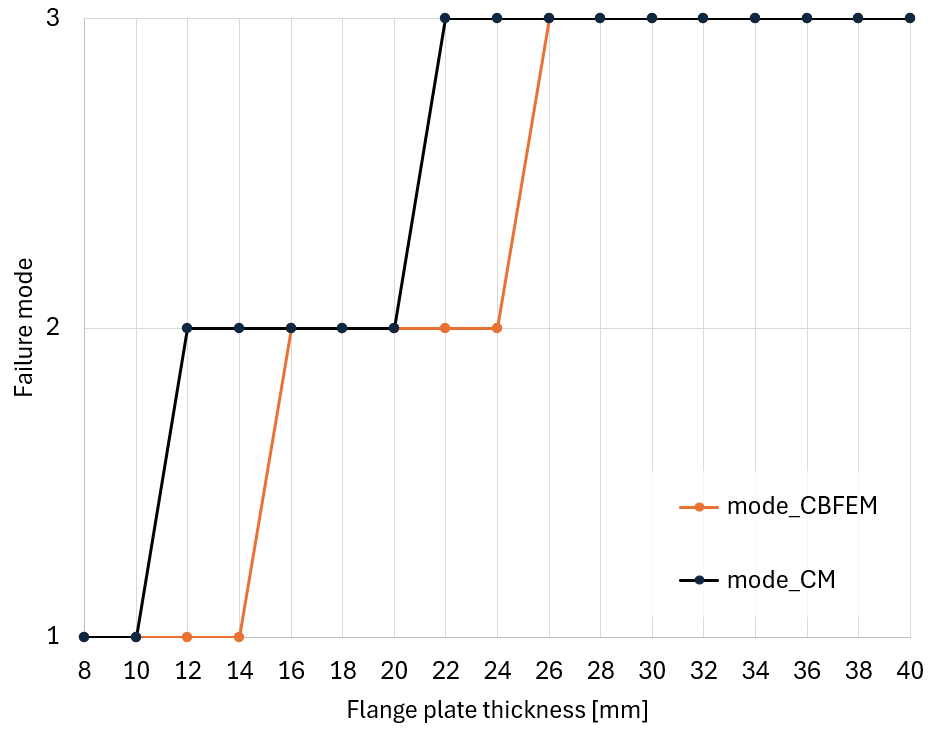
- Modello di base differente. Le equazioni dell'EC si basano su un modello di comportamento semplificato. IDEA StatiCa utilizza un modello CBFEM dettagliato.
- La linea di snervamento nel modello EC inizia dietro le saldature, mentre in IDEA StatiCa le saldature distribuiscono uniformemente il carico, ma non irrigidiscono la piastra di flangia.
Si noti che il calcolo manuale secondo EN 1993-1-8 è ben illustrato in SCI P398 alle pagine 10–17.
Riferimenti
EN 1993-1-8:2005 Eurocodice 3: Progettazione delle strutture in acciaio – Parte 1-8: Progettazione dei giunti, CEN, Bruxelles
SCI P398 Joints in Steel Construction: Moment-resisting Joints to Eurocode 3, 2013