Metoda porušení
V této kapitole je metoda konečných prvků založená na komponentách (CBFEM) pro návrh jednorovinných svařovaných přípojů kruhových dutých průřezů (CHS) ověřena metodou porušení (FMM): styčníky T, X a K. V CBFEM je návrhová únosnost omezena dosažením 5 % přetvoření nebo silou odpovídající deformaci styčníku 3 % d0, kde d0 je průměr pásu. Únosnost v FMM je obecně určena maximálním zatížením nebo mezním přetvořením 3 % d0, viz (Lu et al. 1994). FMM je založena na principu identifikace módů, které mohou způsobit porušení styčníku. Z praktických zkušeností a experimentů provedených v 70. a 80. letech byly pro styčníky CHS identifikovány dva módy porušení: plastifikace pásu a smykové protlačení pásu. Tato výpočetní metoda je vždy omezena na ověřenou geometrii styčníků. To znamená, že pro každou geometrii platí vždy jiné vzorce. V následujících studiích jsou svary navrženy podle EN 1993‑1‑8:2006 tak, aby nebyly nejslabšími komponenty ve styčníku.
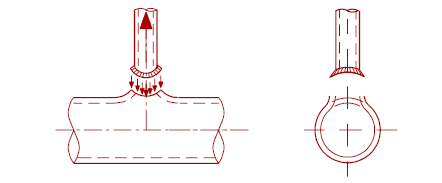
Plastifikace pásu
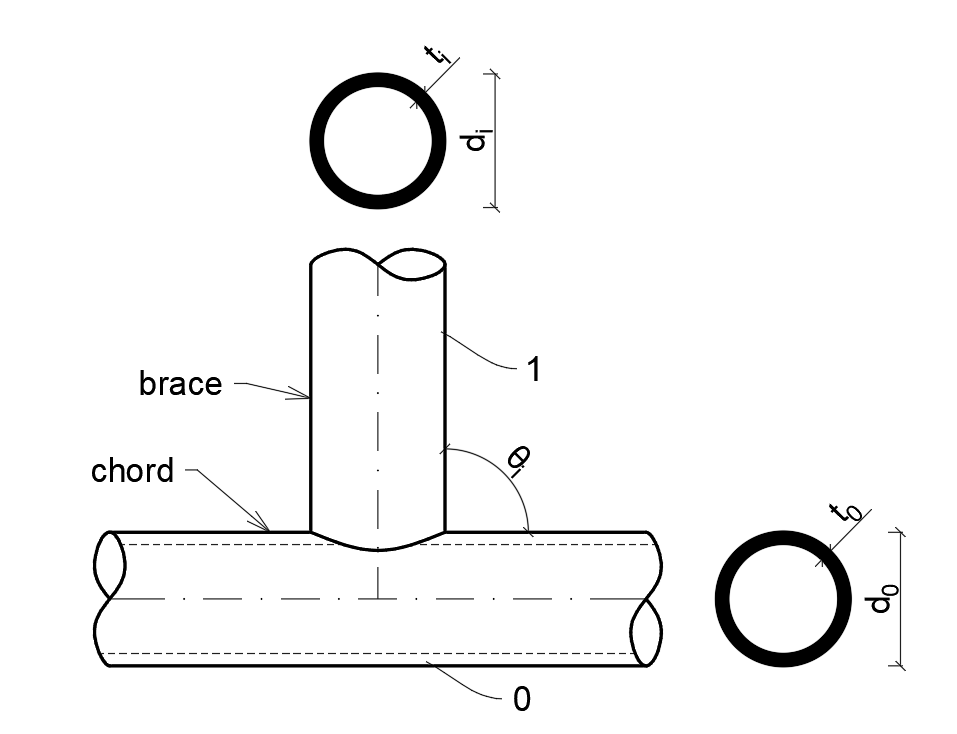
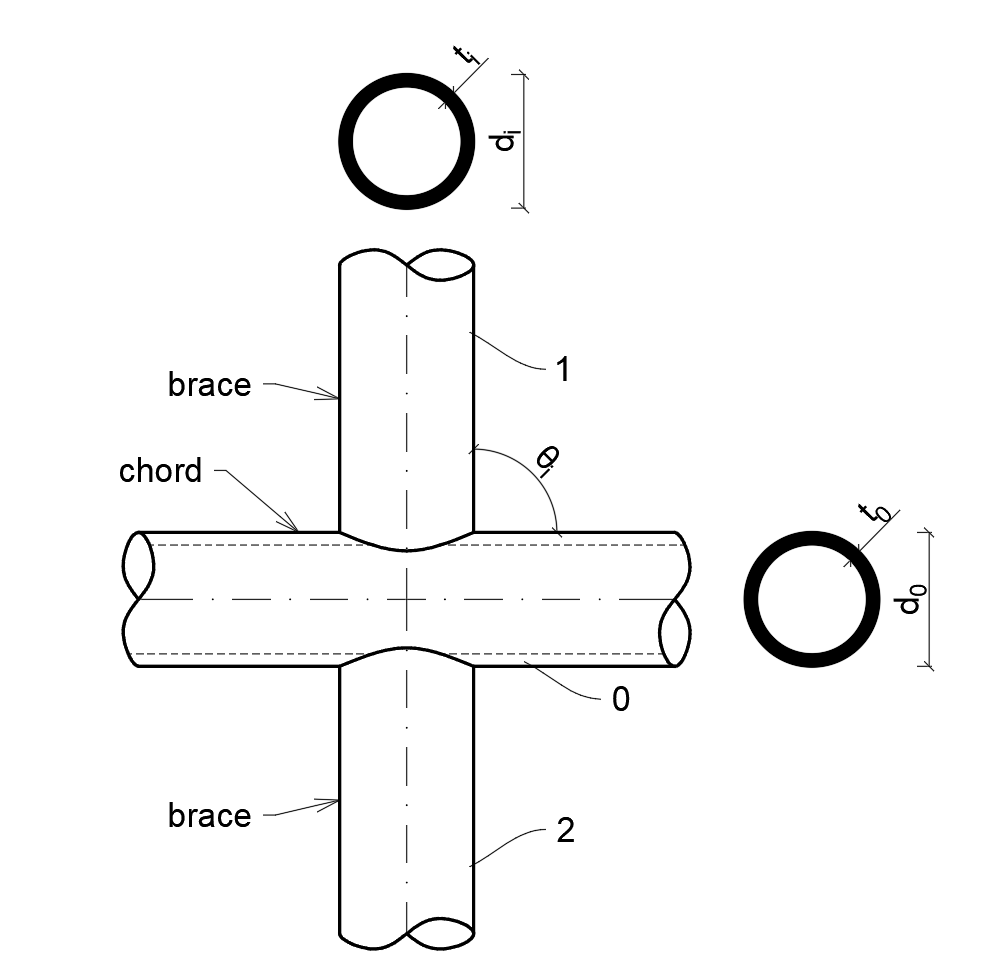
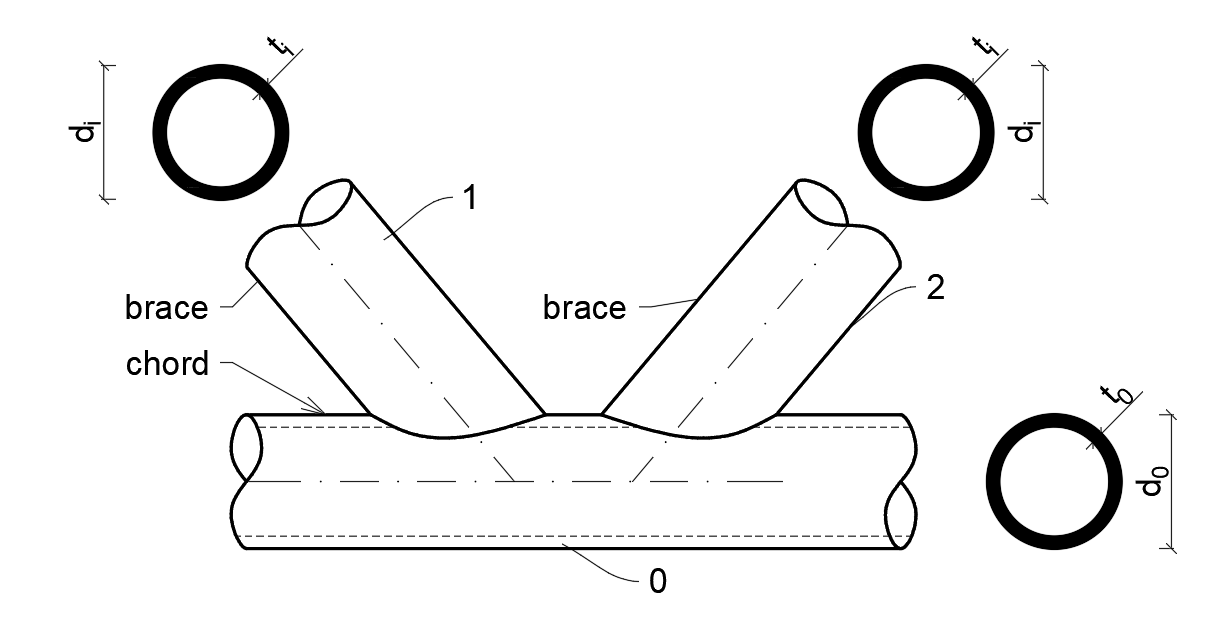
Návrhovou únosnost čelní stěny pásu CHS lze stanovit metodou FMM uvedenou v kap. 9 prEN 1993-1-8:2020; viz obr. 7.1.1. Metoda je rovněž uvedena v ISO/FDIS 14346 a podrobněji popsána v (Wardenier et al. 2010). Návrhová únosnost osově zatíženého svařovaného styčníku CHS je:
- pro styčník T a Y
- styčník X
- a pro styčník K s mezerou
kde:
- di – celkový průměr prvku CHS i (i = 0, 1, 2 nebo 3)
- fyi – mez kluzu prvku i (i = 0, 1, 2 nebo 3)
- g – mezera mezi diagonálami styčníku K
- ti – tloušťka stěny prvku CHS i (i = 0, 1, 2 nebo 3)
- – úhel mezi diagonálou i a pásem (i =1, 2 nebo 3)
- – poměr středního průměru nebo šířky diagonál k průměru nebo šířce pásu
- – poměr šířky nebo průměru pásu k dvojnásobku tloušťky jeho stěny
- Qf – součinitel napětí v pásu
- Cf – součinitel materiálu
- – dílčí součinitel únosnosti styčníků příhradových nosníků z dutých průřezů
- Ni,Rd – návrhová únosnost styčníku vyjádřená jako normálová síla v prvku i (i = 0, 1, 2 nebo 3)
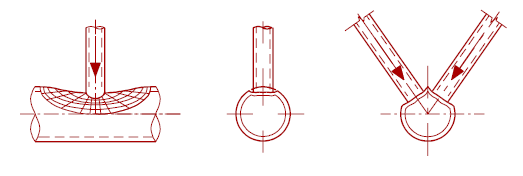
Smykové protlačení pásu
(pro )
Návrhová únosnost osově zatíženého styčníku T, Y, X a K svařovaných kruhových dutých průřezů pro smykové protlačení pásu (obr. 7.1.2) je:
kde:
- di – celkový průměr prvku CHS i (i = 0,1,2 nebo 3)
- ti – tloušťka stěny prvku CHS i (i = 0,1,2 nebo 3)
- fy,i – mez kluzu prvku i (i = 0,1,2 nebo 3)
- – úhel mezi diagonálou i a pásem (i = 1,2 nebo 3)
- Cf – součinitel materiálu
- Ni,Rd – návrhová únosnost styčníku vyjádřená jako normálová síla v prvku i (i = 0, 1, 2 nebo 3)
Smyk pásu
(pro styčníky X, pouze pokud )
Návrhová únosnost osově zatíženého styčníku X svařovaných kruhových dutých průřezů pro smyk pásu, viz obr. 7.1.3, je:
kde:
- Ai – plocha průřezu i (i = 0,1,2 nebo 3)
- fy,i – mez kluzu prvku i (i = 0,1,2 nebo 3)
- – úhel mezi diagonálou i a pásem (i = 1,2 nebo 3)
- Ni,Rd – návrhová únosnost styčníku vyjádřená jako normálová síla v prvku i (i = 0, 1, 2 nebo 3)
Rozsah platnosti
CBFEM byl ověřen pro typické styčníky svařovaných kruhových dutých průřezů. Rozsah platnosti pro tyto styčníky je definován v tabulce 7.1.8 prEN 1993-1-8:2020; viz tab. 7.1.2. Stejný rozsah platnosti je aplikován na model CBFEM. Mimo rozsah platnosti FMM by měl být proveden experiment pro validaci nebo ověření podle validovaného výzkumného modelu.
Tab. 7.1.2 Rozsah platnosti pro metodu porušení
| Obecně | |||
| Pás | Tlak | Třída 1 nebo 2 a (ale pro styčníky X: ) |
| Tah | (ale pro styčníky X: ) | |
| Diagonály CHS | Tlak | Třída 1 nebo 2 a |
| Tah |
Jednorovinný styčník T a Y-CHS
Přehled uvažovaných příkladů ve studii je uveden v tab. 7.1.3. Vybrané případy pokrývají široký rozsah geometrických poměrů styčníků. Geometrie styčníků s rozměry je znázorněna na obr. 7.1.2. Ve vybraných případech došlo k porušení styčníků podle FMM plastifikací pásu nebo smykovým protlačením.
Tab. 7.1.3 Přehled příkladů
| Příklad | Pás | Diagonála | Úhly | Materiál | ||
| Průřez | Průřez | fy | fu | E | ||
| [°] | [MPa] | [MPa] | [GPa] | |||
| 1 | CHS219.1/5.0 | CHS48.3/5.0 | 90 | 355 | 490 | 210 |
| 2 | CHS219.1/5.0 | CHS114.3/6.3 | 90 | 355 | 490 | 210 |
| 3 | CHS219.1/6.3 | CHS114.3/6.3 | 90 | 355 | 490 | 210 |
| 4 | CHS219.1/10.0 | CHS60.3/5.0 | 90 | 355 | 490 | 210 |
| 5 | CHS219.1/12.5 | CHS168.3/10.0 | 90 | 355 | 490 | 210 |
| 6 | CHS219.1/8.0 | CHS48.3/5.0 | 90 | 355 | 490 | 210 |
Ověření únosnosti
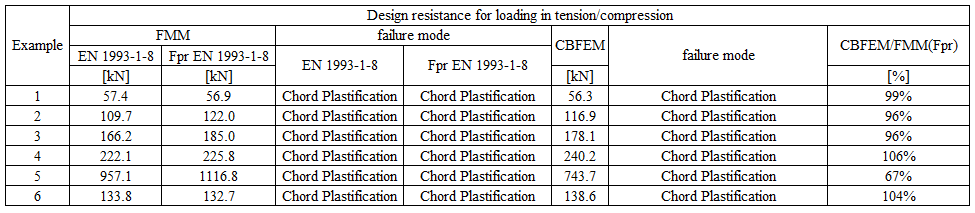
Výsledky metody FMM jsou porovnány s výsledky CBFEM. Porovnání je zaměřeno na únosnost a návrhový mód porušení. Výsledky jsou uvedeny v tab. 7.1.4.
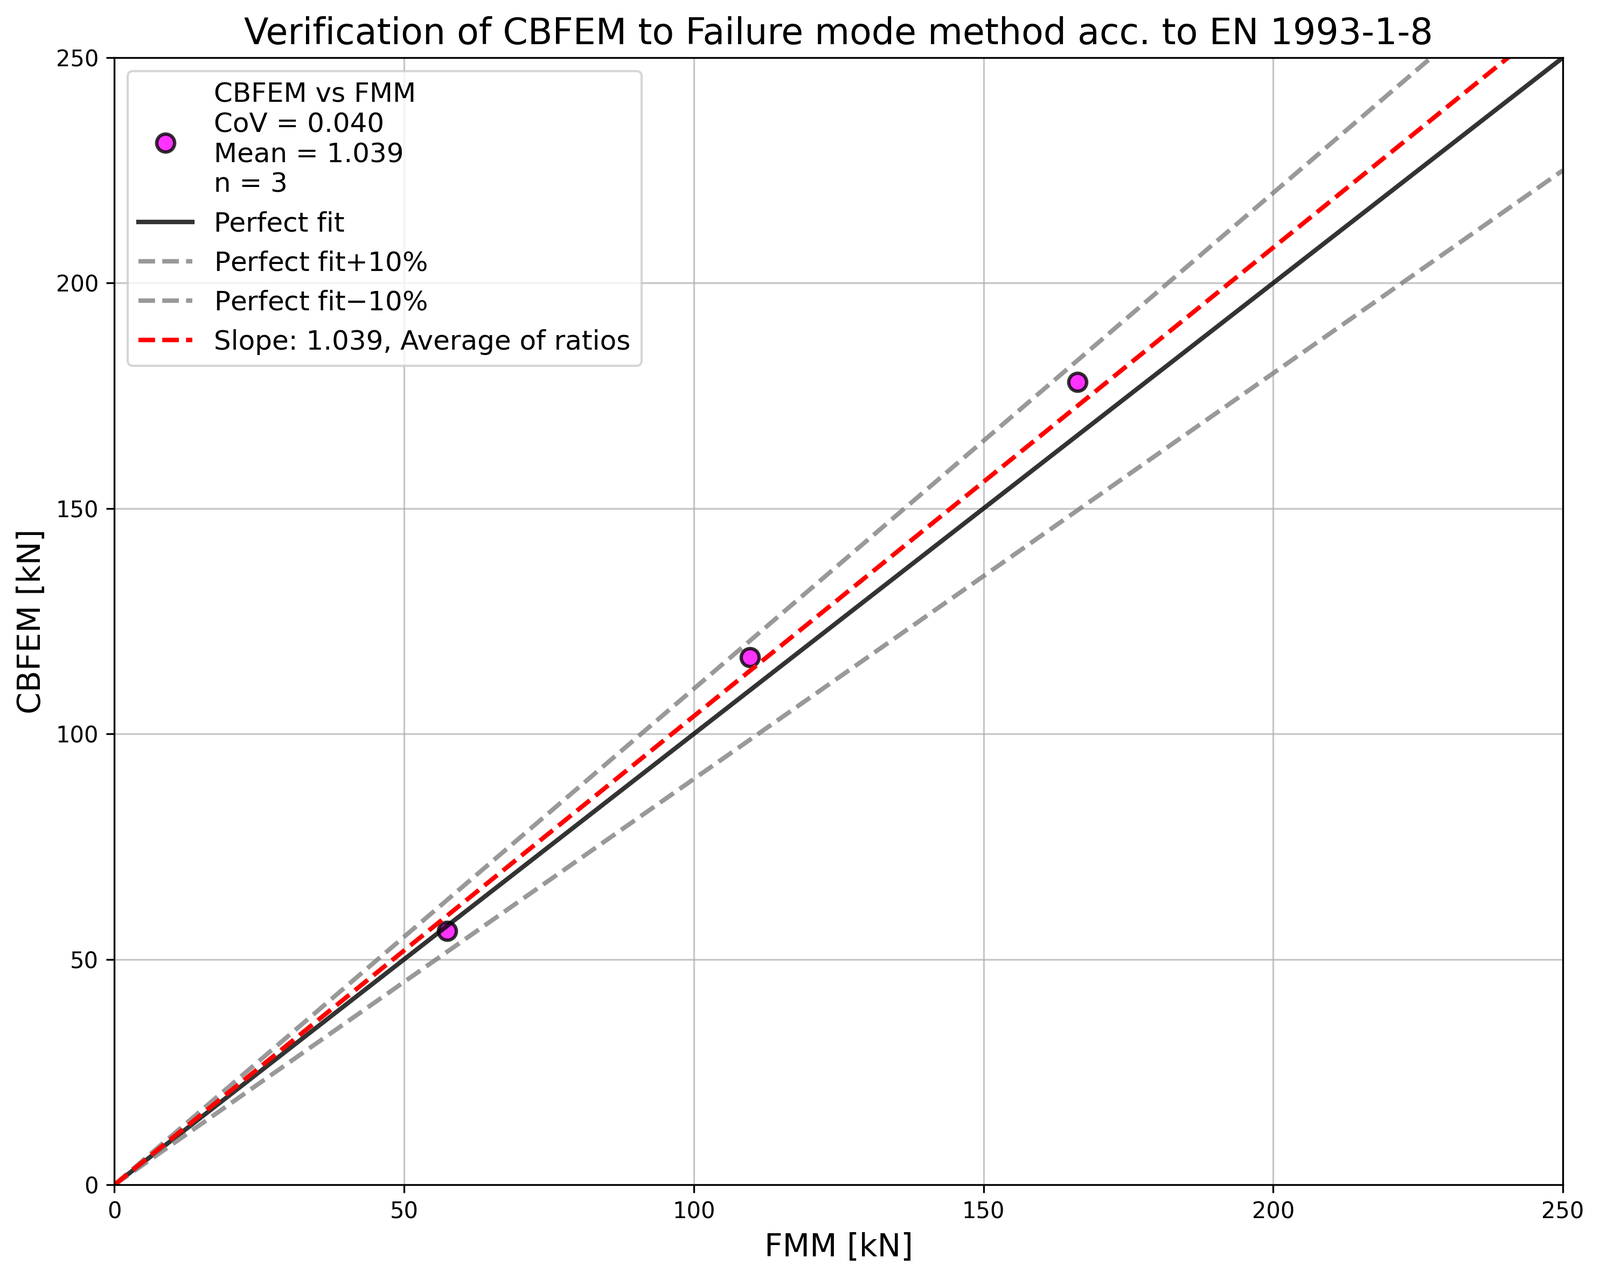
Studie ukazuje dobrou shodu pro uvažované zatěžovací případy. Výsledky jsou shrnuty v diagramu porovnávajícím návrhové únosnosti CBFEM a FMM; viz obr. 7.1.5. Výsledky ukazují, že rozdíl mezi oběma výpočetními metodami je ve všech případech menší než 14 %.
Tab. 7.1.4 Porovnání návrhových únosností pro zatížení tahem/tlakem: predikce pomocí CBFEM a FMM
Vzorový příklad
Vstupy
Pás
- Ocel S355
- Průřez CHS219.1/5.0
Diagonála
- Ocel S355
- Průřez CHS48.3/5.0
- Úhel mezi diagonálou a pásem 90°
Svar
- Tupý svar po obvodu diagonály
Zatížení
- Silou v diagonále v tlaku
Velikost sítě
- 64 prvků po obvodu kruhového dutého průřezu
Výstupy
- Návrhová únosnost v tlaku je NRd = 56,3 kN
- Návrhový mód porušení je plastifikace pásu
Jednorovinný styčník X-CHS
Přehled uvažovaných příkladů ve studii je uveden v tab. 7.1.5. Vybrané případy pokrývají široký rozsah geometrických poměrů styčníků. Geometrie styčníků s rozměry je znázorněna na obr. 7.1.6. Ve vybraných případech došlo k porušení styčníků podle FMM plastifikací pásu nebo smykovým protlačením.
Tab. 7.1.5 Přehled příkladů
| Příklad | Pás | Diagonála | Úhly | Materiál | ||
| Průřez | Průřez | fy | fu | E | ||
| [°] | [MPa] | [MPa] | [GPa] | |||
| 1 | CHS219.1/6.3 | CHS60.3/5.0 | 90 | 355 | 490 | 210 |
| 2 | CHS219.1/8.0 | CHS76.1/5.0 | 90 | 355 | 490 | 210 |
| 3 | CHS219.1/10.0 | CHS139.7/10.0 | 90 | 355 | 490 | 210 |
| 4 | CHS219.1/12.5 | CHS114.3/6.3 | 90 | 355 | 490 | 210 |
| 5 | CHS219.1/10.0 | CHS76.1/5.0 | 90 | 355 | 490 | 210 |
| 6 | CHS219.1/8.0 | CHS114.3/6.3 | 90 | 355 | 490 | 210 |
| 7 | CHS219.1/6.3 | CHS48.3/5.0 | 60 | 355 | 490 | 210 |
| 8 | CHS219.1/6.3 | CHS114.3/6.3 | 60 | 355 | 490 | 210 |
| 9 | CHS219.1/8.0 | CHS60.3/5.0 | 60 | 355 | 490 | 210 |
| 10 | CHS219.1/10.0 | CHS114.3/6.3 | 60 | 355 | 490 | 210 |
| 11 | CHS219.1/12.5 | CHS139.7/10.0 | 60 | 355 | 490 | 210 |
| 12 | CHS219.1/8.0 | CHS139.7/10.0 | 60 | 355 | 490 | 210 |
| 13 | CHS219.1/6.3 | CHS48.3/5.0 | 30 | 355 | 490 | 210 |
| 14 | CHS219.1/6.3 | CHS193.7/12.5 | 30 | 355 | 490 | 210 |
| 15 | CHS219.1/6.3 | CHS219.1/12.5 | 30 | 355 | 490 | 210 |
| 16 | CHS219.1/8.0 | CHS76.1/5.0 | 30 | 355 | 490 | 210 |
| 17 | CHS219.1/8.0 | CHS168.3/10 | 30 | 355 | 490 | 210 |
| 18 | CHS219.1/12.5 | CHS168.3/10 | 30 | 355 | 490 | 210 |
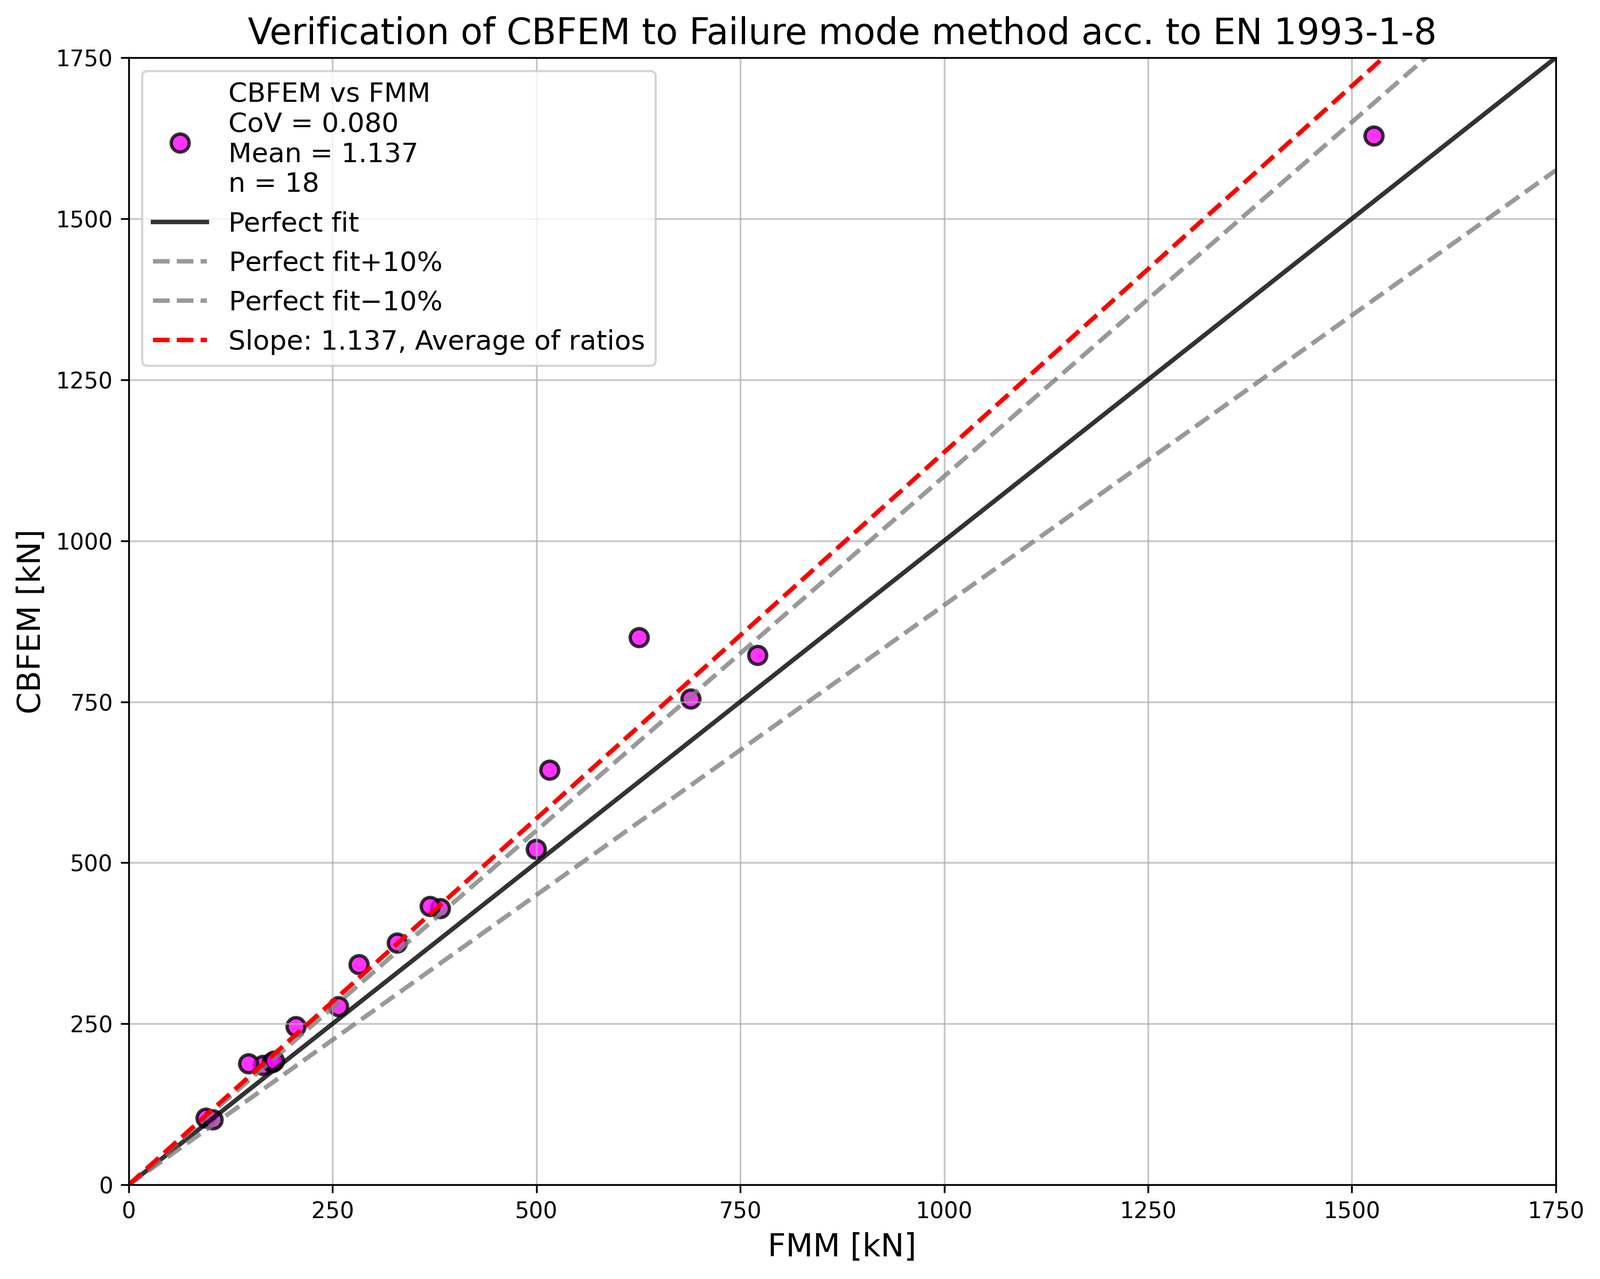
Ověření únosnosti
Výsledky CBFEM jsou porovnány s výsledky FMM. Porovnání je zaměřeno na únosnost a návrhový mód porušení. Výsledky jsou uvedeny v tab. 7.1.6.
Tab. 7.1.6 Porovnání výsledků predikce pomocí CBFEM a FMM
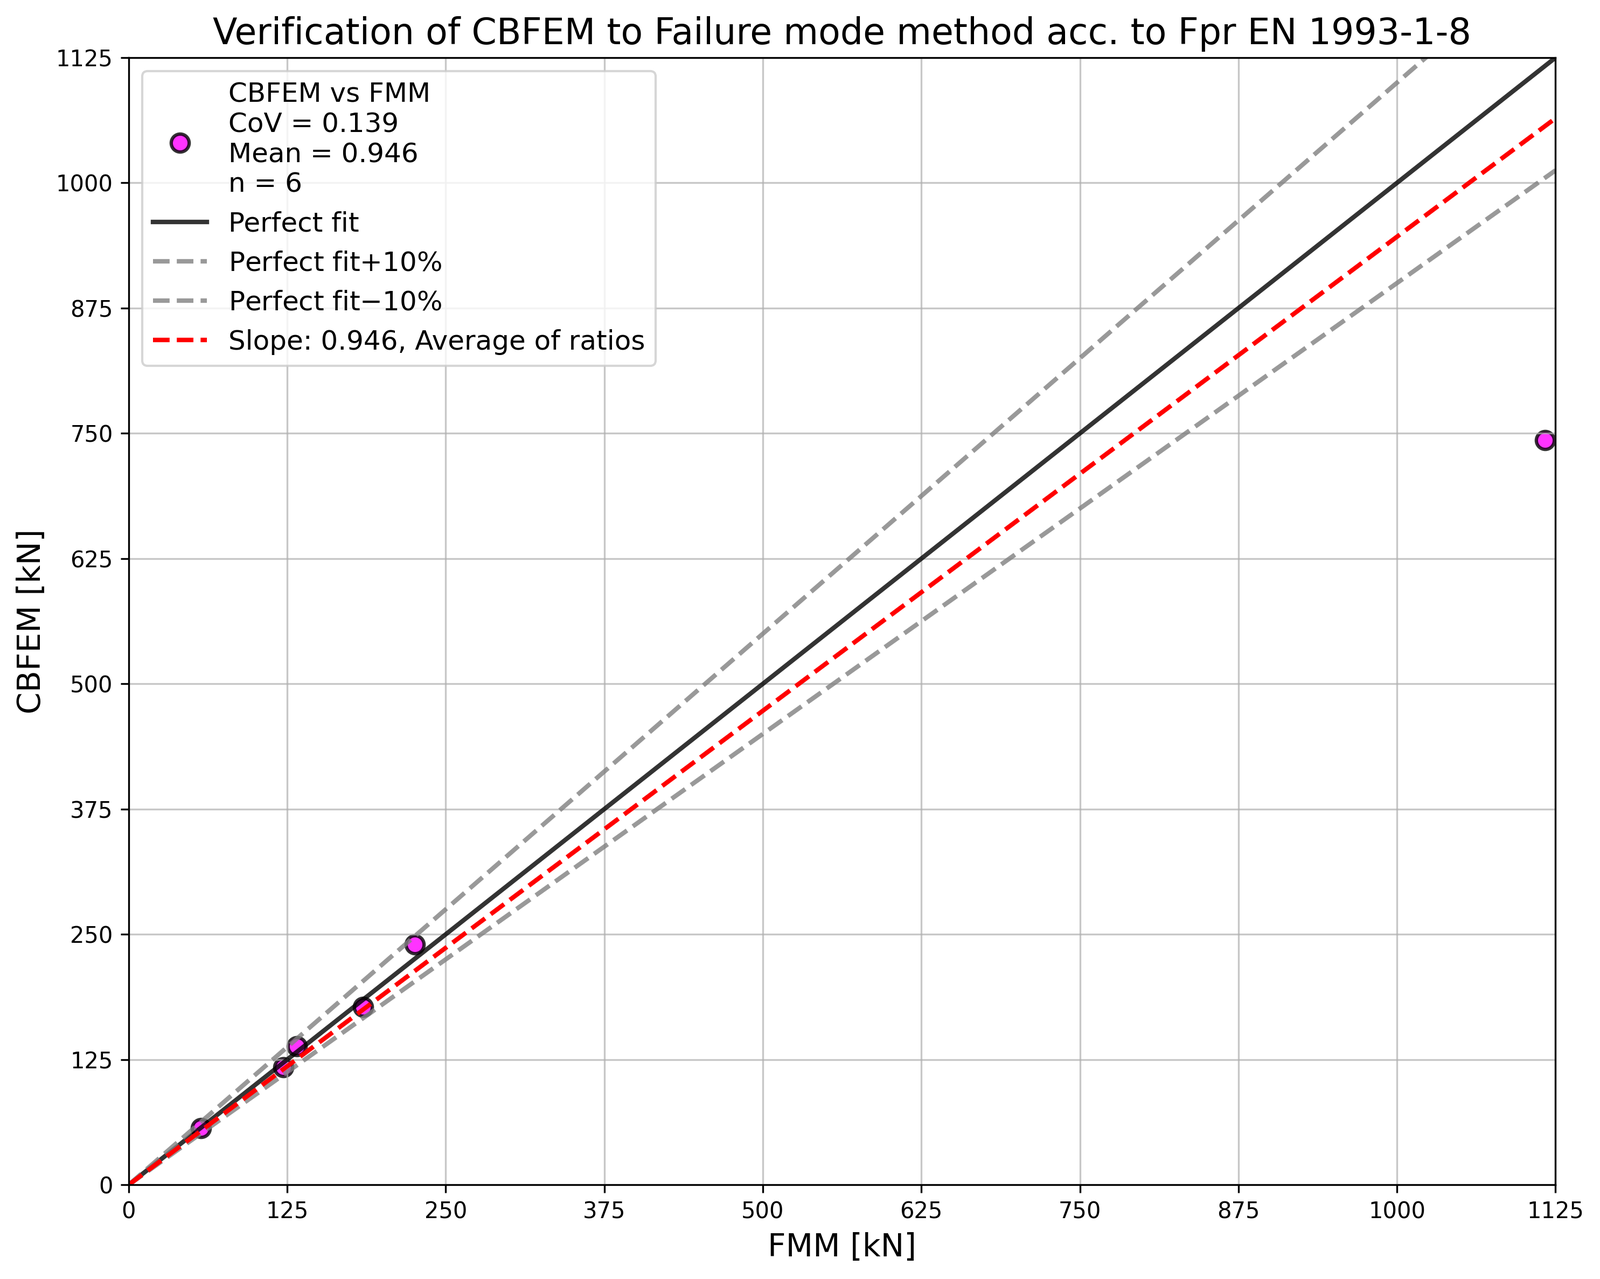
Studie ukazuje dobrou shodu pro většinu uvažovaných zatěžovacích případů. Výsledky jsou shrnuty v diagramu porovnávajícím návrhové únosnosti CBFEM a FMM; viz obr. 7.1.7. Výsledky ukazují, že rozdíl mezi oběma výpočetními metodami je ve většině případů menší než 13 %.
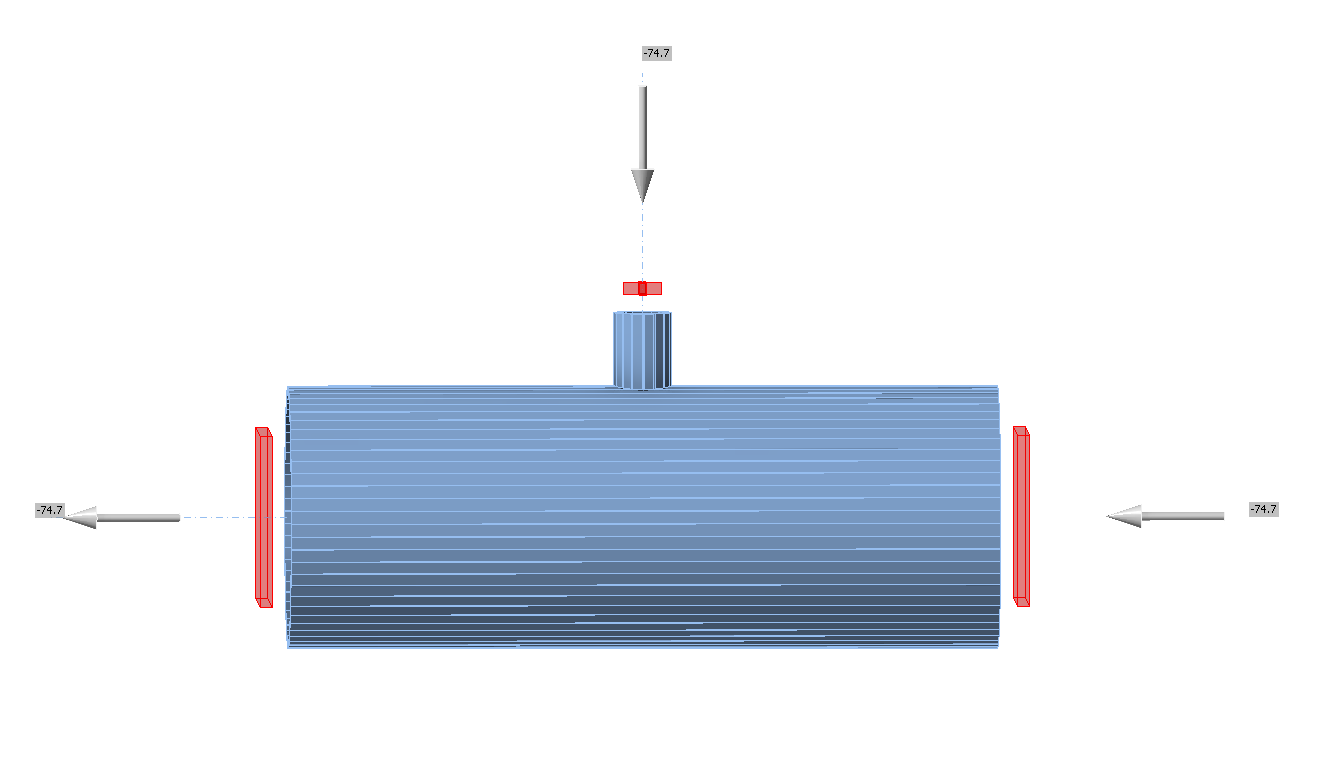
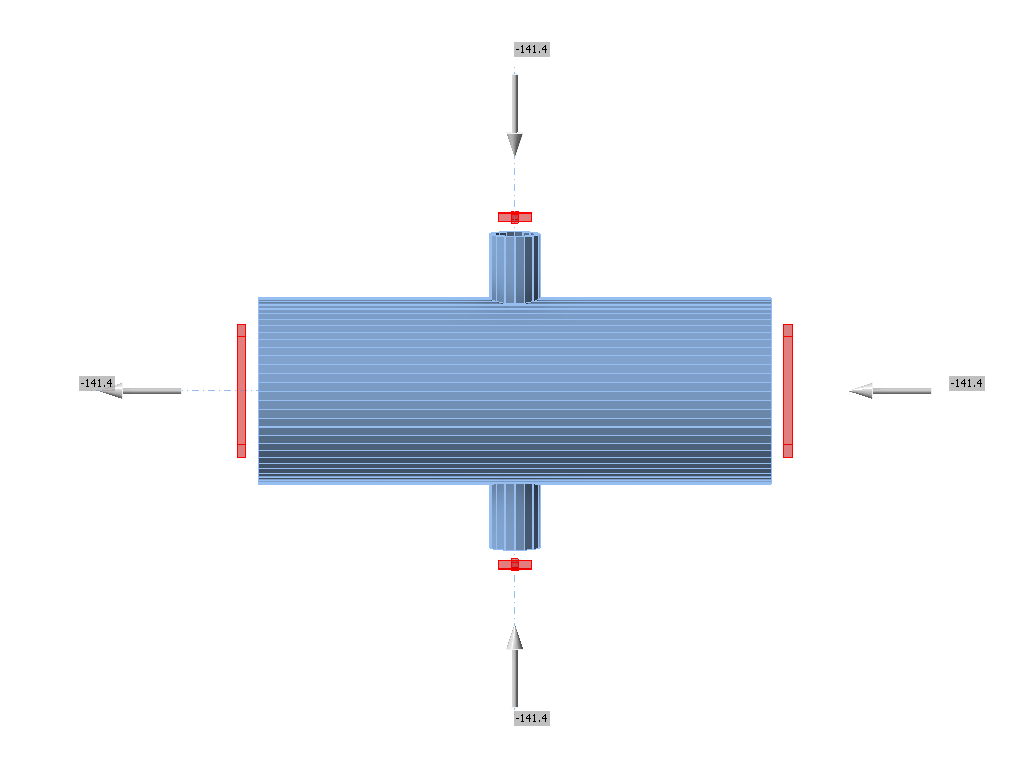
Vzorový příklad
Vstupy
Pás
- Ocel S355
- Průřez CHS219.1/6,3
Diagonála
- Ocel S355
- Průřez CHS60,3/5,0
- Úhel mezi diagonálou a pásem 90°
Svar
- Tupý svar po obvodu diagonály
Zatížení
- Silou v diagonále v tlaku
Velikost sítě
- 64 prvků po obvodu kruhového dutého průřezu
Výstupy
- Návrhová únosnost v tlaku je NRd = 103,9 kN
- Návrhový mód porušení je plastifikace pásu
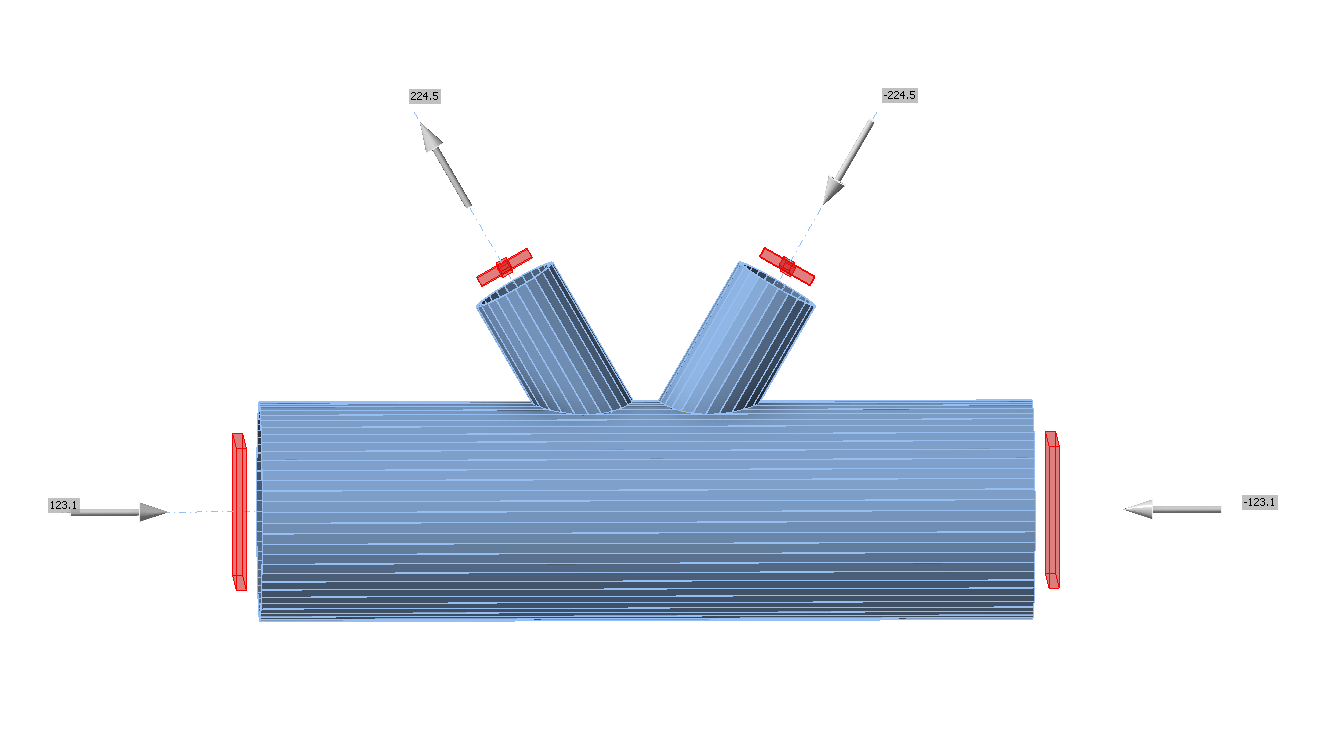
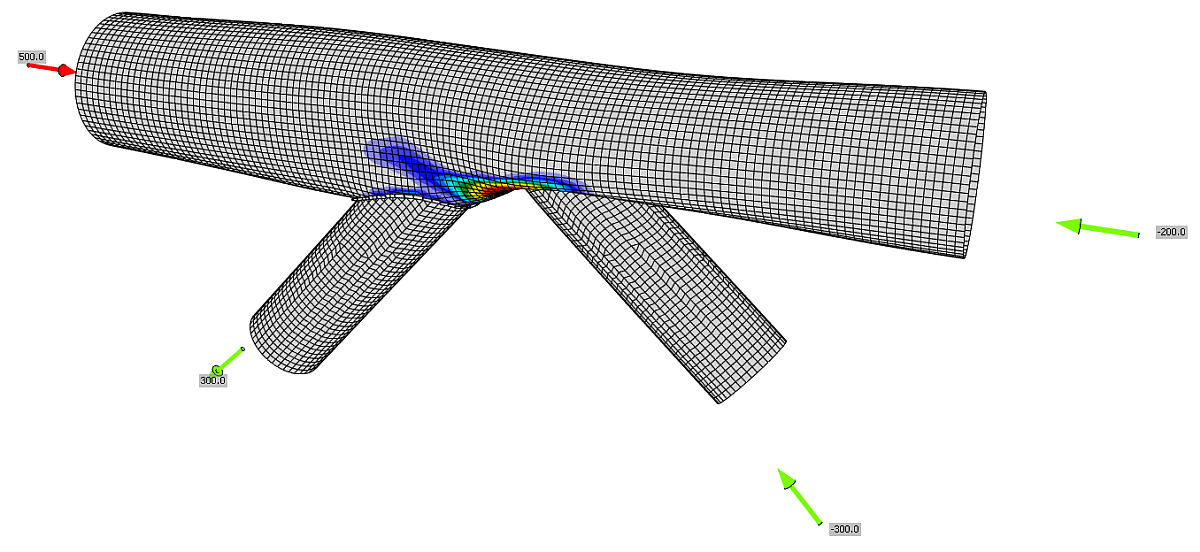
Jednorovinný styčník K-CHS
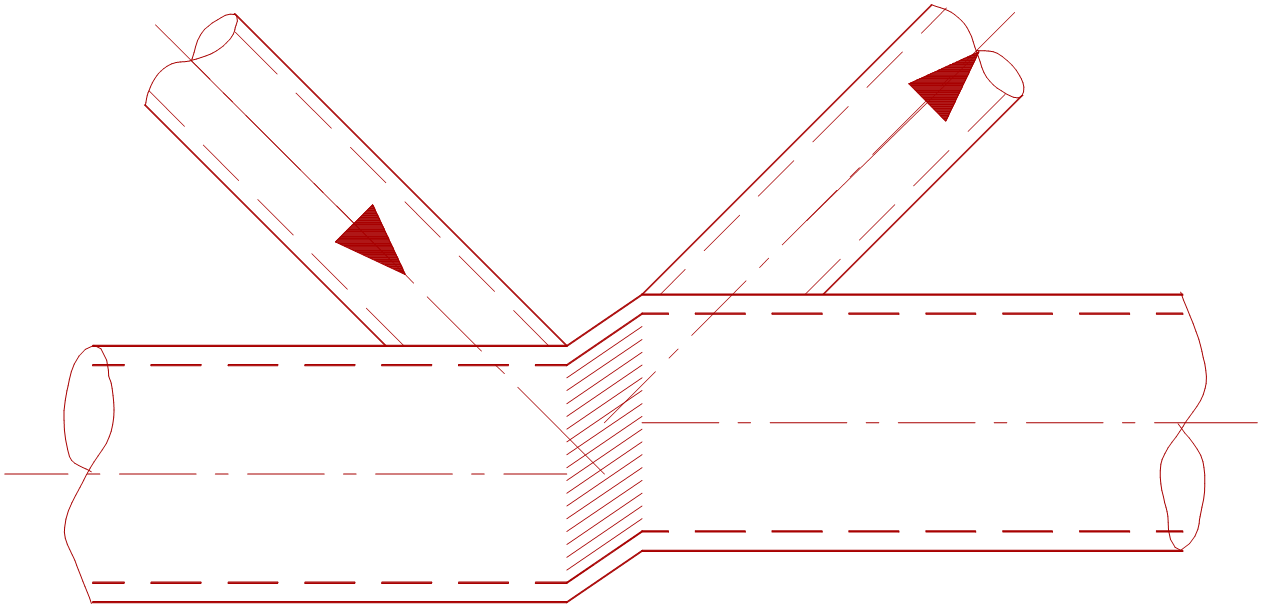
Přehled uvažovaných příkladů ve studii je uveden v tab. 7.1.7. Vybrané případy pokrývají široký rozsah geometrických poměrů styčníků. Geometrie styčníků s rozměry je znázorněna na obr. 7.1.8. Ve vybraných případech došlo k porušení styčníků podle metody porušení (FMM) plastifikací pásu nebo smykovým protlačením.
Tab. 7.1.7 Přehled příkladů
| Příklad | Pás | Diagonála | Mezera | Úhly | Materiál | ||
| Průřez | Průřez | g | fy | fu | E | ||
| [mm] | [°] | [MPa] | [MPa] | [GPa] | |||
| 1 | CHS219,1/8,0 | CHS88,9/5,0 | 23.8 | 60 | 355 | 490 | 210 |
| 2 | CHS219,1/12,5 | CHS88,9/5,0 | 23.8 | 60 | 355 | 490 | 210 |
| 3 | CHS219,1/5,0 | CHS88,9/5,0 | 23.8 | 60 | 355 | 490 | 210 |
| 4 | CHS219,1/10,0 | CHS60,3/5,0 | 56.9 | 60 | 355 | 490 | 210 |
| 5 | CHS219,1/6,3 | CHS88,9/5,0 | 23.8 | 60 | 355 | 490 | 210 |
| 6 | CHS219,1/6,3 | CHS60,3/5,0 | 56.9 | 60 | 355 | 490 | 210 |
| 7 | CHS219,1/8,0 | CHS76,1/5,0 | 38.6 | 60 | 355 | 490 | 210 |
| 8 | CHS219,1/10,0 | CHS76,1/5,0 | 38.6 | 60 | 355 | 490 | 210 |
| 9 | CHS219,1/6.3 | CHS48,3/65,0 | 70.7 | 60 | 355 | 490 | 210 |
| 10 | CHS219,1/12,5 | CHS48,3/5,0 | 70.7 | 60 | 355 | 490 | 210 |
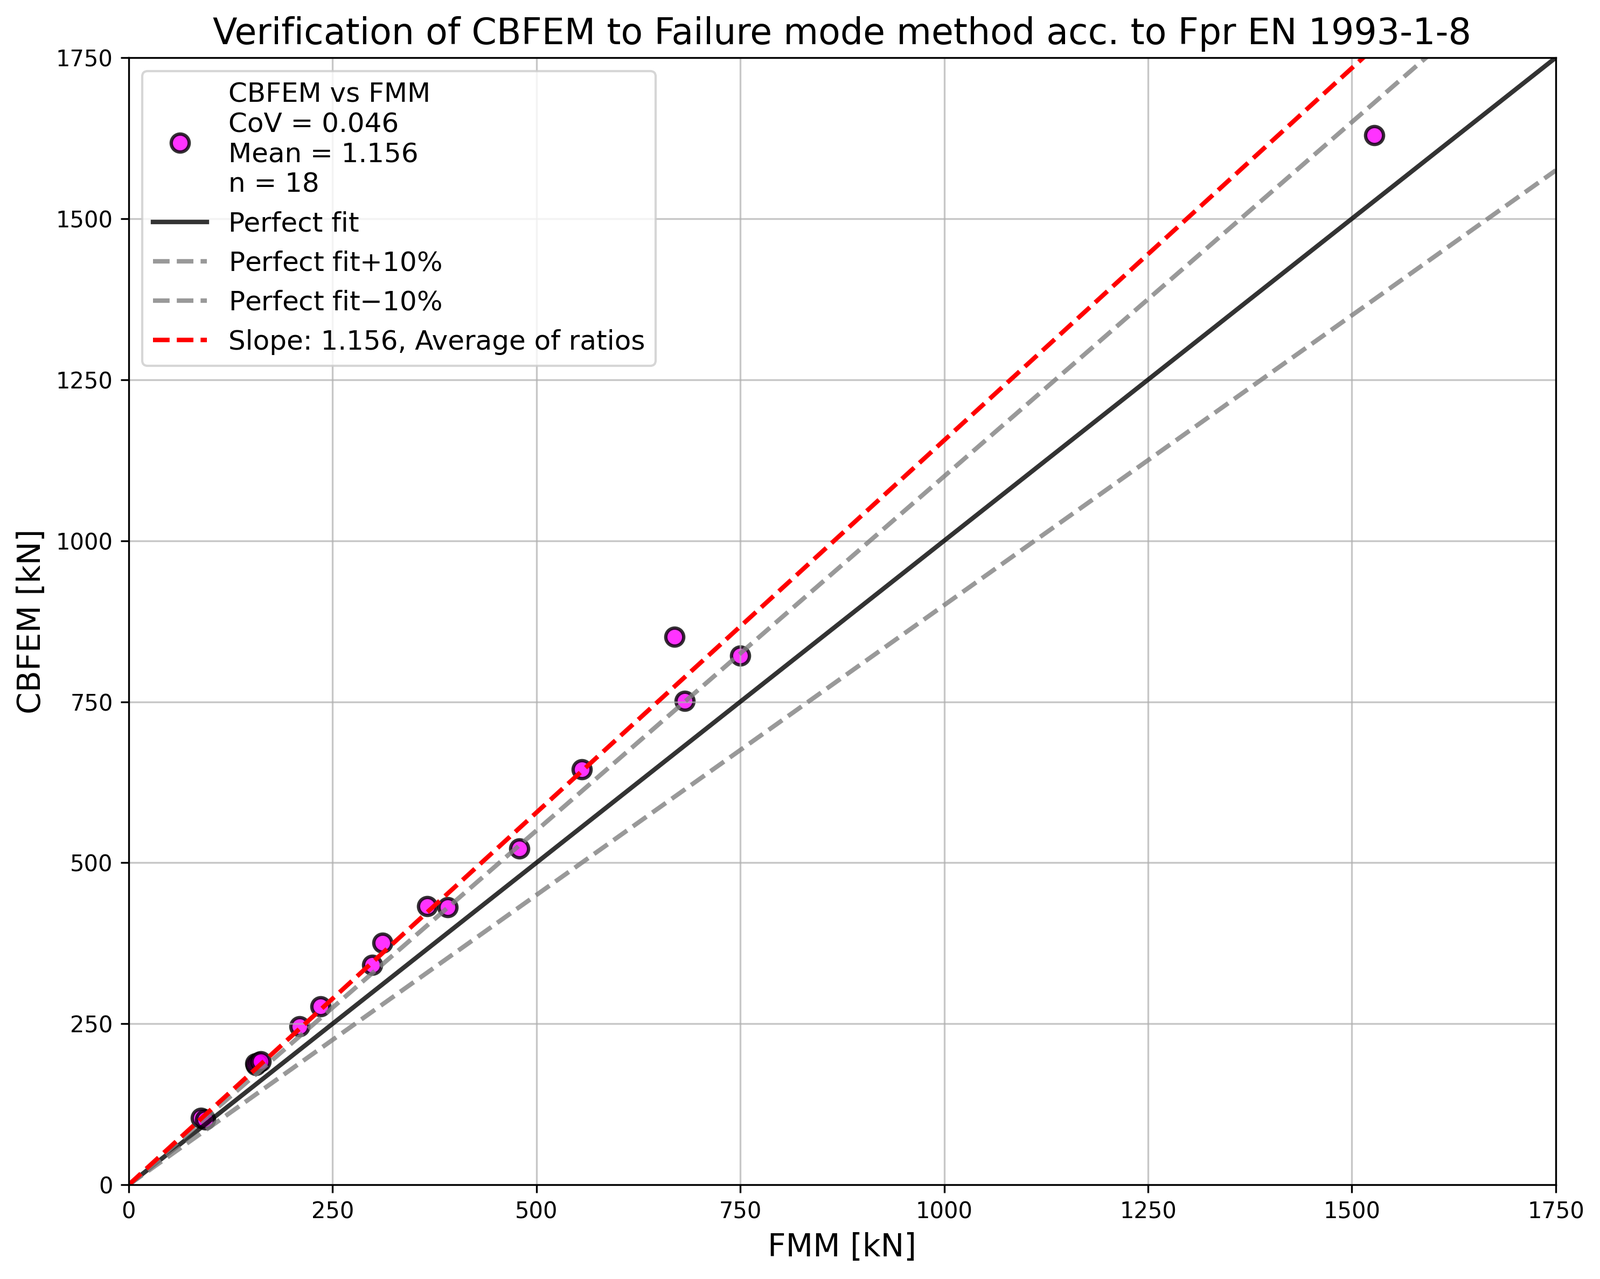
Ověření únosnosti
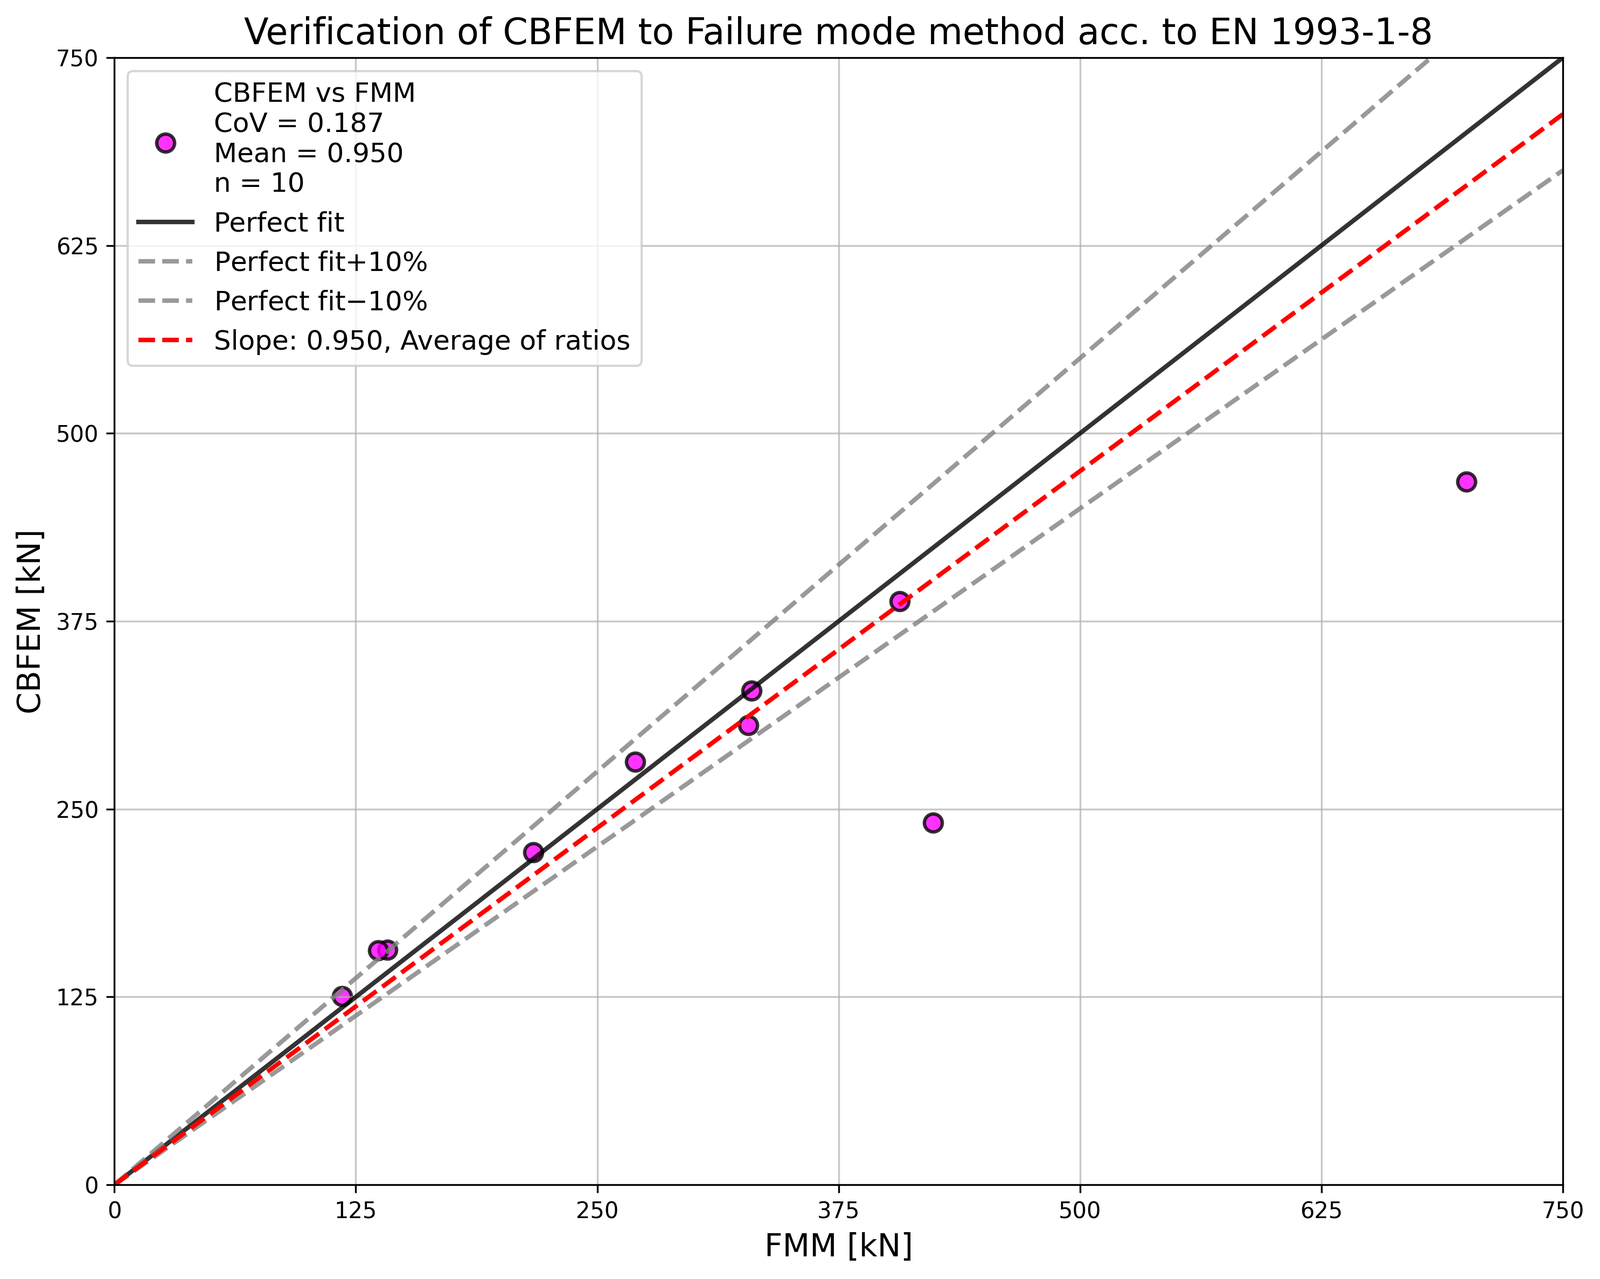
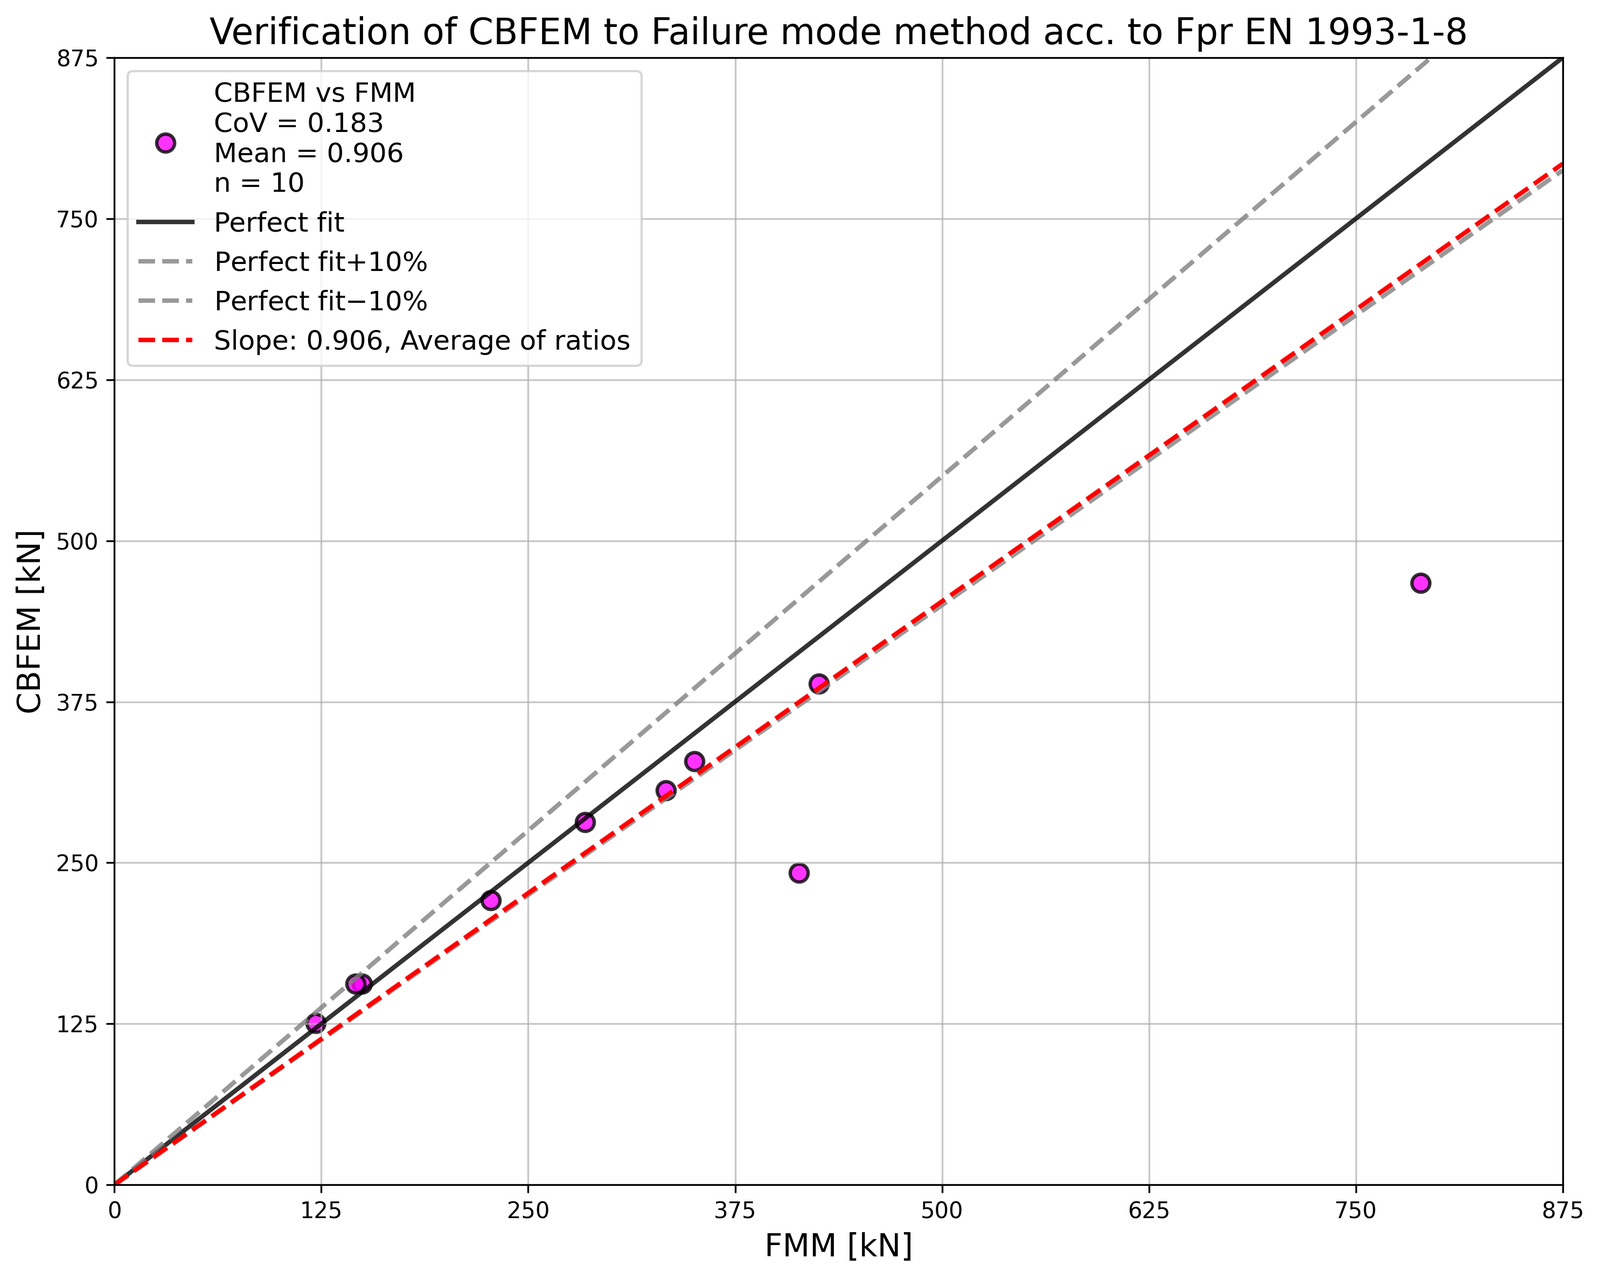
Výsledky metody porušení (FMM) jsou porovnány s výsledky CBFEM. Porovnání je zaměřeno na únosnost a návrhový mód porušení. Výsledky jsou uvedeny v tab. 7.1.8 a na obr. 7.1.9.
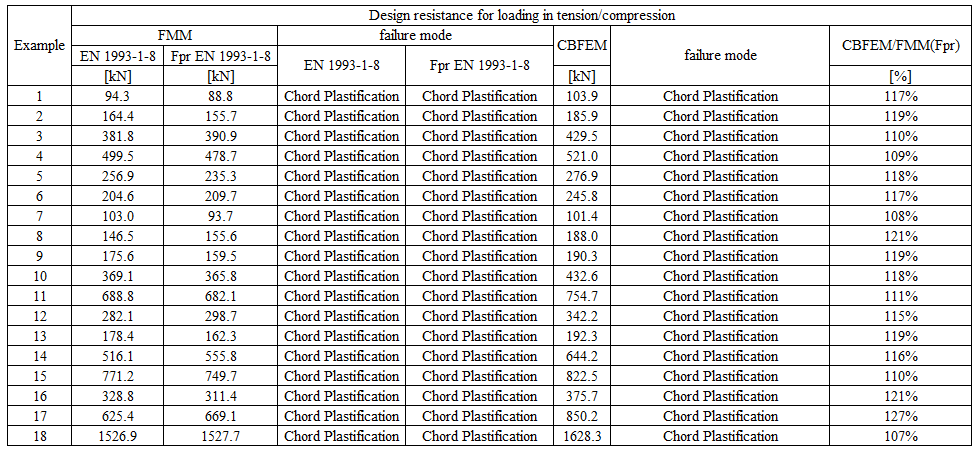
Tab. 7.1.8 Porovnání výsledků návrhových únosností pomocí CBFEM a FMM
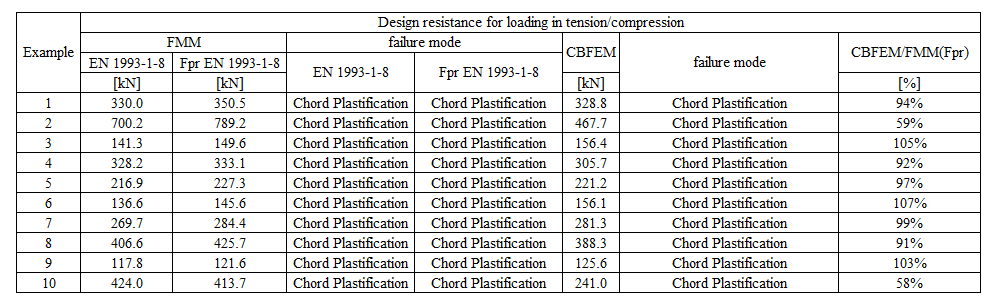
Studie ukazuje dobrou shodu pro uvažované zatěžovací případy. Výsledky jsou shrnuty v diagramu porovnávajícím návrhové únosnosti CBFEM a FMM; viz obr. 7.1.6. Výsledky ukazují, že rozdíl mezi oběma výpočetními metodami je ve všech případech menší než 12 %.
Vzorový příklad
Vstupy
Pás
- Ocel S355
- Průřez CHS 219.1/8.0
Diagonála
- Ocel S355
- Průřez CHS 88.9/5.0
- Úhel mezi diagonálou a pásem 60°
- Mezera mezi diagonálami g = 23,8 mm
Svar
- Tupý svar po obvodu diagonály
Zatížení
- Silou v diagonále v tlaku
Velikost sítě
- 64 prvků po obvodu kruhového dutého průřezu
Výstupy
- Návrhová únosnost v tlaku je NRd = 328,8 kN
- Návrhový mód porušení je plastifikace pásu