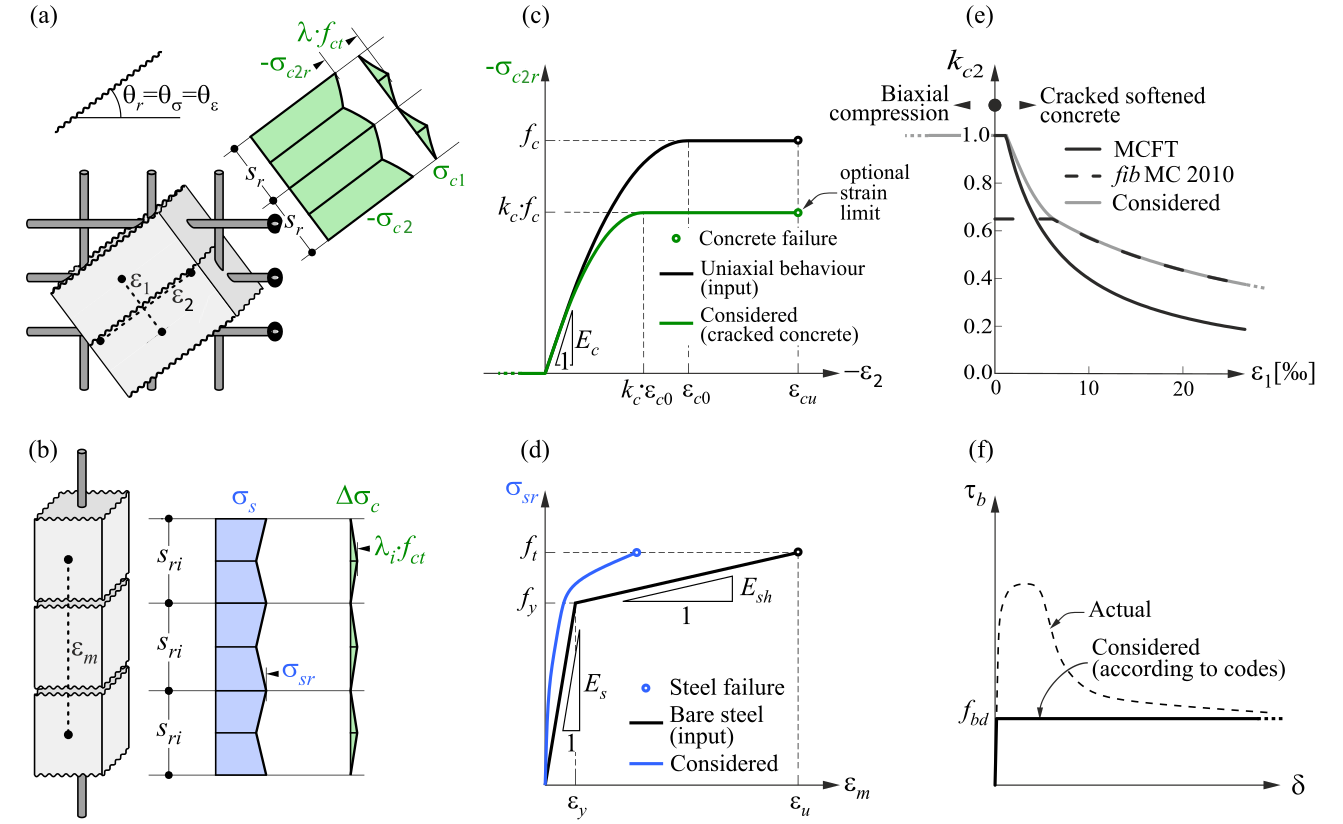
Main assumptions and limitations for CSFM

Cet article est aussi disponible en :

The CSFM assumes fictitious, rotating, stress-free cracks that open without slip (Fig. 2a), and considers the equilibrium at the cracks together with the average strains of the reinforcement. Hence, the model considers maximum concrete (σc3r) and reinforcement stresses (σsr) at the cracks while neglecting the concrete tensile strength (σc1r = 0), except for its stiffening effect on the reinforcement. The consideration of tension stiffening allows the average reinforcement strains (εm) to be simulated.

\( \textsf{\textit{\footnotesize{Fig. 2\qquad Basic assumptions of the CSFM: (a) principal stresses in concrete; (b) stresses in the reinforcement direction;}}}\) \( \textsf{\textit{\footnotesize{(c) stress-strain diagram of concrete in terms of maximum stresses with consideration of compression softening;}}}\) \( \textsf{\textit{\footnotesize{(d) stress-strain diagram of reinforcement in terms of stresses at cracks and average strains; (e) compression softening}}}\) \( \textsf{\textit{\footnotesize{law; (f) bond shear stress-slip relationship for anchorage length verifications.}}}\)


Despite their simplicity, similar assumptions have been demonstrated to yield accurate predictions for reinforced members subjected to in-plane loading (Kaufmann 1998; Kaufmann and Marti 1998) if the provided reinforcement avoids brittle failures at cracking. Furthermore, the non-consideration of any contribution of the tensile strength of concrete to the ultimate load is consistent with the principles of modern design codes, which are mostly based on plasticity theory.

However, the CSFM is not suited for slender elements without transverse reinforcement since relevant mechanisms for such elements as aggregate interlock, residual tensile stresses at the crack tip and dowel action – all of them relying directly or indirectly on the tensile strength of the concrete – are disregarded. While some design standards allow the design of such elements based on semi-empirical provisions, the CSFM is not intended for this type of potentially brittle structure.

Constitutive model

Concrete

The concrete model implemented in the CSFM is based on the uniaxial compression constitutive laws prescribed by design codes for the design of cross-sections, which only depend on compressive strength. The parabola-rectangle diagram specified in EN 1992-1-1 (Fig. 2c) is used by default in the CSFM, but designers can also choose a more simplified elastic ideal plastic relationship. When assessing according to ACI 3018-04, it is possible to use only the parabola-rectangle stress-strain diagram. As previously mentioned, the tensile strength is neglected, as it is in classic reinforced concrete design.

The effective compressive strength is automatically evaluated for cracked concrete based on the principal tensile strain (ε1) by means of the kc2 reduction factor, as shown in Fig. 2c and e. The implemented reduction relationship (Fig. 2e) is a generalization of the fib Model Code 2010 proposal for shear verifications, which contains a limiting value of 0.65 for the maximum ratio of effective concrete strength to concrete compressive strength, which is not applicable to other loading cases.

Using default settings, the current implementation of the CSFM in IDEA StatiCa Detail does not consider an explicit failure criterion in terms of strains for concrete in compression (i.e., it considers an infinitely plastic branch after the peak stress is reached). This simplification does not allow the deformation capacity of structures failing in compression to be verified. However, their ultimate capacity is properly predicted when, in addition to the factor of cracked concrete (kc2) defined in (Fig. 2e), the increase in the brittleness of concrete as its strength rises is considered by means of the \( \eta_{fc} \) reduction factor defined in fib Model Code 2010 as follows:

\[f_{ck,red} = k_c \cdot f_{ck} = \eta _{fc} \cdot k_{c2} \cdot f_{ck}\]

\[{\eta _{fc}} = {\left( {\frac{{30}}{{{f_{ck}}}}} \right)^{\frac{1}{3}}} \le 1\]

where:

kc is the global reduction factor of the compressive strength

kc2 is the reduction factor due to the presence of transverse cracking

fck is the concrete cylinder characteristic strength (in MPa for the definition of \( \eta_{fc} \)).

Reinforcement

By default, the idealized bilinear stress-strain diagram for the bare reinforcing bars typically defined by design codes (Fig. 2d) is considered. The definition of this diagram only requires the basic properties of the reinforcement to be known during the design phase (strength and ductility class). A user-defined stress-strain relationship can also be defined.

Tension stiffening is accounted for by modifying the input stress-strain relationship of the bare reinforcing bar in order to capture the average stiffness of the bars embedded in the concrete (εm) (Section 1.2.4).

Verification of anchorage length

Bond-slip between reinforcement and concrete is introduced in the finite element model for ultimate limit state load cases by considering the simplified rigid-perfectly plastic constitutive relationship presented in Fig. 2f, with fbd being the design value of the ultimate bond stress specified by the design code for the specific bond conditions.

This is a simplified model with the sole purpose of verifying bond prescriptions according to design codes (i.e., anchorage of reinforcement). The reduction of the anchorage length when using hooks, loops, and similar bar shapes can be considered by defining a certain capacity at the end of the reinforcement, as will be described in Section 3.5.3. It should be noted that a different bond shear stress-slip model is considered for tension stiffening and crack width calculations. In such cases, the model considers average bond shear stresses instead of characteristic values to capture the average behavior of the elements.

Tension stiffening

The implementation of tension stiffening distinguishes between cases of stabilized and non-stabilized crack patterns. In both cases, the concrete is considered fully cracked before loading by default.

\( \textsf{\textit{\footnotesize{Fig. 3\qquad Tension stiffening model: (a) tension chord element for stabilized cracking with distribution of bond shear,}}}\) \( \textsf{\textit{\footnotesize{steel and concrete stresses, and steel strains between cracks, considering average crack spacing); (b) pull-out assumption}}}\) \( \textsf{\textit{\footnotesize{for non-stabilized cracking with distribution of bond shear and steel stresses and strains around the crack; (c) resulting}}}\) \( \textsf{\textit{\footnotesize{tension chord behavior in terms of reinforcement stresses at the cracks and average strains for European B500B steel;}}}\) \( \textsf{\textit{\footnotesize{(d) detail of the initial branches of the tension chord response.}}}\)


Stabilized cracking

In fully developed crack patterns, tension stiffening is introduced using the Tension Chord Model (TCM) (Marti et al. 1998; Alvarez 1998) – Fig. 3a – which has been shown to yield excellent response predictions in spite of its simplicity (Burns 2012). The TCM assumes a stepped, rigid-perfectly plastic bond shear stress-slip relationship with with τ= τb0 =2 fctm for σs ≤ fy and τb =τb1 = fctm for σfy. Treating every reinforcing bar as a tension chord ­– Fig. 3b and Fig. 3a – the distribution of bond shear, steel and concrete stresses and hence the strain distribution between two cracks can be determined for any given value of the maximum steel stresses (or strains) at the cracks.

For sr = sr0, a new crack may or may not form because at the center between two cracks σc1 = fct. Consequently, the crack spacing may vary by a factor of two, i.e., sr = λsr0, with l = 0.5…1.0. Assuming a certain value for λ, the average strain of the chord (εm) can be expressed as a function of the maximum reinforcement stresses (i.e., stresses at the cracks, σsr). For the idealized bilinear stress-strain diagram for the reinforcing bare bars considered by default in the CSFM, the following closed form analytical expressions are obtained (Marti et al. 1998):

\[\varepsilon_m = \frac{\sigma_{sr}}{E_s} - \frac{\tau_{b0}s_r}{E_s Ø}\]

\[\textrm{for}\qquad\qquad\sigma_{sr} \le f_y\]


\[{\varepsilon_m} = \frac{{{{\left( {{\sigma_{sr}} - {f_y}} \right)}^2}Ø}}{{4{E_{sh}}{\tau _{b1}}{s_r}}}\left( {1 - \frac{{{E_{sh}}{\tau_{b0}}}}{{{E_s}{\tau_{b1}}}}} \right) + \frac{{\left( {{\sigma_{sr}} - {f_y}} \right)}}{{{E_s}}}\frac{{{\tau_{b0}}}}{{{\tau_{b1}}}} + \left( {{\varepsilon_y} - \frac{{{\tau_{b0}}{s_r}}}{{{E_s}Ø}}} \right)\]

\[\textrm{for}\qquad\qquad{f_y} \le {\sigma _{sr}} \le \left( {{f_y} + \frac{{2{\tau _{b1}}{s_r}}}{Ø}} \right)\]


\[ \varepsilon_m = \frac{f_s}{E_s} + \frac{\sigma_{sr}-f_y}{E_{sh}} - \frac{\tau_{b1} s_r}{E_{sh} Ø}\]

\[\textrm{for}\qquad\qquad\left(f_y + \frac{2\tau_{b1}s_r}{Ø}\right) \le \sigma_{sr} \le f_t\]

where:
Esh           the steel hardening modulus Esh = (ft – fy)/(εu – fy /Es) ,

Es            modulus of elasticity of reinforcement,

Ø            reinforcing bar diameter,

sr                crack spacing,

σsr           reinforcement stresses at the cracks,

σs            actual reinforcement stresses,

fy                yield strength of reinforcement.


The Idea StatiCa Detail implementation of the CSFM considers average crack spacing by default when performing computer-aided stress field analysis. The average crack spacing is considered to be 2/3 of the maximum crack spacing (λ = 0.67), which follows recommendations made on the basis of bending and tension tests (Broms 1965; Beeby 1979; Meier 1983). It should be noted that calculations of crack widths consider a maximum crack spacing (λ = 1.0) in order to obtain conservative values.

The application of the TCM depends on the reinforcement ratio, and hence the assignment of an appropriate concrete area acting in tension between the cracks to each reinforcing bar is crucial. An automatic numerical procedure has been developed to define the corresponding effective reinforcement ratio (ρeff = As/Ac,eff) for any configuration, including skewed reinforcement (Fig. 4).

\( \textsf{\textit{\footnotesize{Fig. 4\qquad Effective area of concrete in tension for stabilized cracking: (a) maximum concrete area that can be activated;}}}\) \( \textsf{\textit{\footnotesize{(b) cover and global symmetry condition; (c) resultant effective area.}}}\)


Non-stabilized cracking

Cracks existing in regions with geometric reinforcement ratios lower than ρcr, i.e., the minimum reinforcement amount for which the reinforcement is able to carry the cracking load without yielding, are generated by either non-mechanical actions (e.g. shrinkage) or the progression of cracks controlled by other reinforcement. The value of this minimum reinforcement is obtained as follows:

\[{\rho _{cr}} = \frac{{{f_{ct}}}}{{{f_y} - \left( {n - 1} \right){f_{ct}}}}\]

where:

fy              reinforcement yield strength,

fct             concrete tensile strength,

n              modular ratio, n = Es / Ec .

For conventional concrete and reinforcing steel, ρcr amounts to approximately 0.6%.

For stirrups with reinforcement ratios below ρcr, cracking is considered to be non-stabilized and tension stiffening is implemented by means of the Pull-Out Model (POM) described in Fig. 3b. This model analyzes the behavior of a single crack considering no mechanical interaction between separate cracks, neglecting the deformability of concrete in tension and assuming the same stepped, rigid-perfectly plastic bond shear stress-slip relationship used by the TCM. This allows the reinforcement strain distribution (εs) in the vicinity of the crack to be obtained for any maximum steel stress at the crack (σsr) directly from equilibrium. Given the fact that the crack spacing is unknown for a non-fully developed crack pattern, the average strain (εm) is computed for any load level over the distance between points with zero slip when the reinforcing bar reaches its tensile strength (ft) at the crack (lε,avg in Fig. 3b), leading to the following relationships:

The proposed models allow the computation of the behavior of bonded reinforcement, which is finally considered in the analysis. This behavior (including tension stiffening) for the most common European reinforcing steel (B500B, with ft / fy = 1.08 and εu = 5%) is illustrated in Fig. 3c-d.

Articles associés