
Bewertung der Tragfähigkeit von Brückenumlenkern: IDEA StatiCa vs. ABAQUS-Simulationen
Hohlkastenbrücken verwenden Umlenker, um den externen Verlauf der Vorspannung zu ändern. Dies ist ein Bereich hoher Spannungskonzentration und eine potenzielle Schwachstelle, an der eine mangelhafte Bemessung und Analyse zu schwerwiegenden Versagen führen kann. In diesem Beitrag analysieren wir eine Hohlkastenbrücke mit externer Vorspannung, wobei wir uns speziell auf den Umlenker-Bereich konzentrieren. Unser Ziel ist es, die Grenztragfähigkeit des Umlenkers durch fortgeschrittene numerische Methoden zu bestimmen und den Spannungs-, Dehnungs- und Rissentwicklungszustand zu simulieren. Wir werden drei verschiedene Bemessungsvarianten vergleichen und ihre Tragfähigkeit anhand des in den einschlägigen Normen beschriebenen Zuverlässigkeitsansatzes bewerten.
Modellbeschreibung
Geometrie und Materialeigenschaften
Für Simulationszwecke wurde ein Ausschnitt eines Brückentragwerksmodells aus Beton der Festigkeitsklasse C50/60 verwendet. Das Modell wurde in der Fahrbahnplatte quer mit Y1860 S7-15.2 Monolitzen mit einer Verankerungsspannung von 1.100 MPa vorgespannt. Die Bewehrung und ihre Eigenschaften entsprechen den Eigenschaften von B500B.
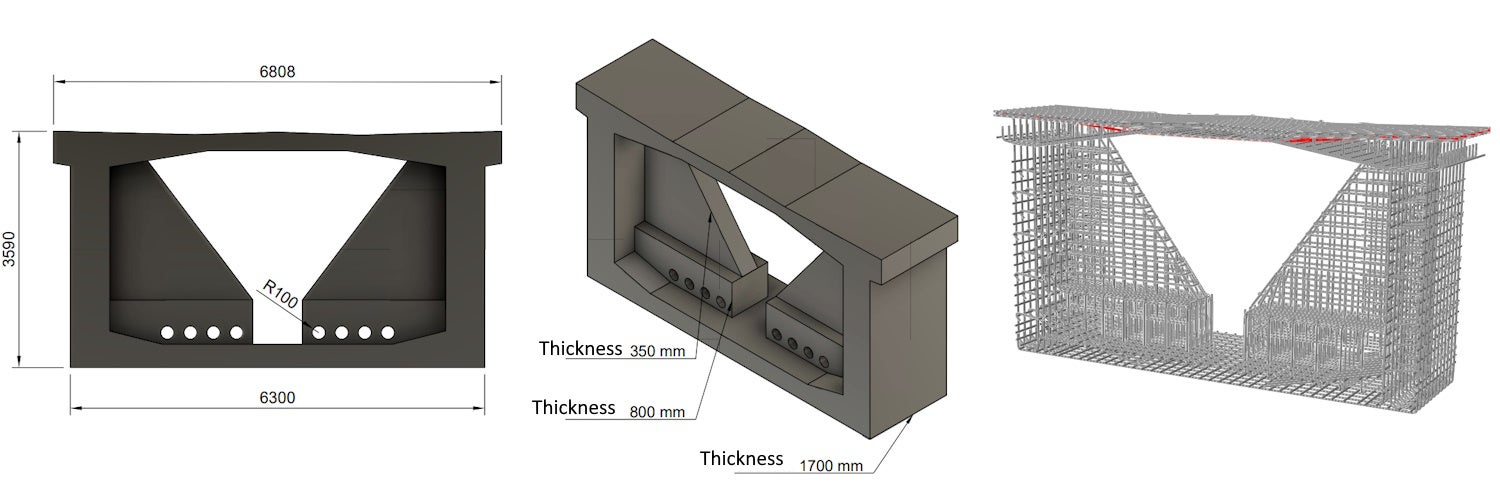
Abb. 1 Geometrie und Bewehrung
Modelle
Für Simulationszwecke wurden drei Modelle mit unterschiedlichem Komplexitätsgrad erstellt. Das erste Modell (im Folgenden als Modell A bezeichnet) wurde als ebenes 2D-Problem mit der Vereinfachung des ebenen Spannungszustands gelöst. Für die Lösung wurde das Kompatibles Spannungsfeldverfahren (CSFM) [1] verwendet, das Bemessungsannahmen für die Berechnung berücksichtigt, die mit den aktuellen EN 1992-1-1-Normen [3] übereinstimmen. In einem nächsten Schritt wurde eine Simulation an einem zweiten Modell (im Folgenden als Modell B bezeichnet) durchgeführt, das räumlich mit Volumenelementen gelöst wird und dabei auch die dritte Richtung, d. h. die Längsrichtung der Hohlkastenbrücke, berücksichtigt. Für Modell B wird angenommen, dass die Anfangsspannung in Längsschnittrichtung der Struktur null ist und damit die in Modell A getroffenen Annahmen des ebenen Spannungszustands erfüllt. Die Lösung des 3D-Modells basiert auf dem Drucker-Prager-Materialmodell „Concrete Damage Plasticity" [2]. Alle Eingaben entsprechen dem Zuverlässigkeitsansatz auf Basis der in den Normen angegebenen Zuverlässigkeitsbeiwerte [3]. Das dritte Modell (im Folgenden als Modell C bezeichnet) unterscheidet sich von Modell B durch die Anfangsbedingung der Längsdruckspannung im Hohlkastenquerschnitt. Daher weicht die Anfangsbedingung von Modell A ab.
CSFM – Modell A
Annahmen
Das in dieser Studie verwendete Modell umfasst sowohl 2D-Beton- als auch 1D-Bewehrungs-Finite-Elemente. Es wird angenommen, dass der Beton nur für die Übertragung von Druckspannungen verantwortlich ist, während die Bewehrung die Zugkräfte aufnimmt. Die Zugfestigkeit des Betons wird nicht berücksichtigt, jedoch im Modell in Form von Zugverfestigung im Bewehrungsmaterialdiagramm einbezogen. Das Modell berücksichtigt auch die Druckerweichung des Betons infolge von Querzugspannungen gemäß fib MC 2010. Der Verbund zwischen Beton, Bewehrung und Spannbewehrung ist in Form von Verbundelementen enthalten, die durch ein starr-plastisches Diagramm mit einem langen plastischen Ast dargestellt werden. Weitere Informationen finden Sie im Dokument „Theoretical Background for IDEA StatiCa Detail." [1].
Lasten und Randbedingungen
Der Umlenker befindet sich im Drittelspunkt der Spannweite des Brückentragwerks. Um sein Verhalten zu simulieren, wurden Auflager im unteren Bereich der Wand des Hohlkastenquerschnitts angeordnet und mit der Betonbewehrung über Verteilungskopplungsgleichungen mit einem Radius von 300 mm verbunden. Die Randbedingung berücksichtigt ein festes Gelenklager auf einer Seite (für horizontale und vertikale Bewegung) und ein Gleitgelenklager auf der anderen Seite (für vertikale Bewegung). Die Randbedingungen beeinflussten die Spannungszustände nicht, sagten jedoch den Ort des Umlenkerversagens während der Simulation des Umlenkverhaltens voraus.
Die externen Spannglieder bestehen aus 31 Drähten, und die Verankerungsspannung in der Struktur beträgt 1.394 MPa. Diese Spannung entspricht den Bemessungsradialdruckkräften im Umlenker von 674 kN in vertikaler Richtung und 67 kN in horizontaler Richtung (ca. 10 % der Vertikalkraft unter Berücksichtigung der räumlichen Spanngliedführung). Mit Modell A wurde ermittelt, dass die Größe der vertikalen Radialkraft eines einzelnen Spannglieds bei der Tragfähigkeit des Umlenkers 1.980 kN beträgt. Für diese Grenztragfähigkeit wurde eine nichtlineare Analyse mit den einzelnen Modellen durchgeführt. Das Modell berücksichtigt eine gleichmäßige Verteilung der Radiallast in Längsrichtung.
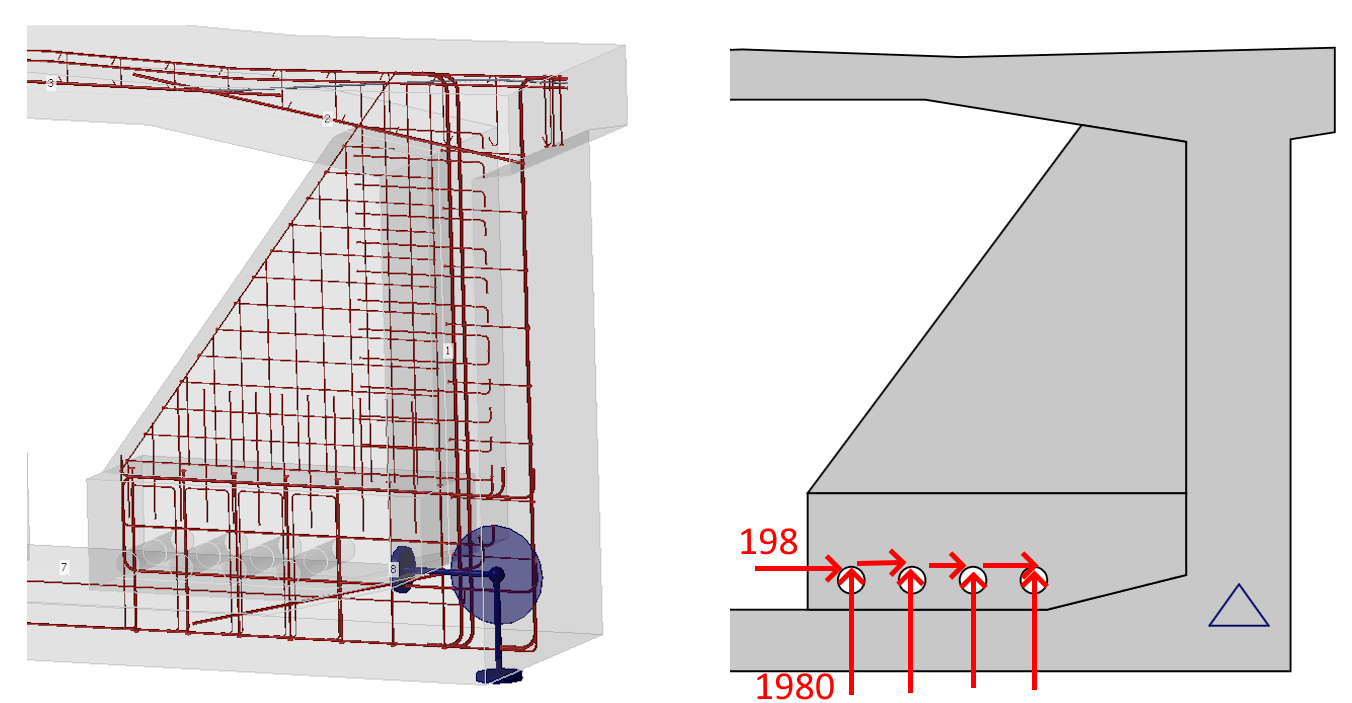
Abb. 2 Randbedingung und Grenztragfähigkeit
Ergebnisse – Modell A
Basierend auf den Simulationsergebnissen tritt die höchste Druckspannung an der Stelle auf, an der das Spannglied mit dem Betonumlenker in Kontakt kommt. An dieser Stelle hat der Beton typischerweise die Plastizität vollständig erreicht und erzeugt eine Spannung von -28 MPa. Dieser Spannungswert ist die Bemessungsfestigkeit des Betons unter Berücksichtigung des Eta-Faktors für den Sprödbruch des Materials. Die maximale Bewehrungsspannung von 469 MPa befindet sich in dem Bereich, in dem der Umlenker und die Platte des Hohlkastenquerschnitts verbunden sind. Diese Stelle ist aus Sicht der Tragfähigkeit und der Verankerungslänge entscheidend, die vollständig ausgenutzt wird. Darüber hinaus ist die Wand des Hohlkastenquerschnitts ein weiterer Bereich hoher Zugspannung. Aus Betonsicht ist auch die Versteifungswand, die die obere Platte des Hohlkastenquerschnitts verbindet, ein Bereich hoher Spannungskonzentration.
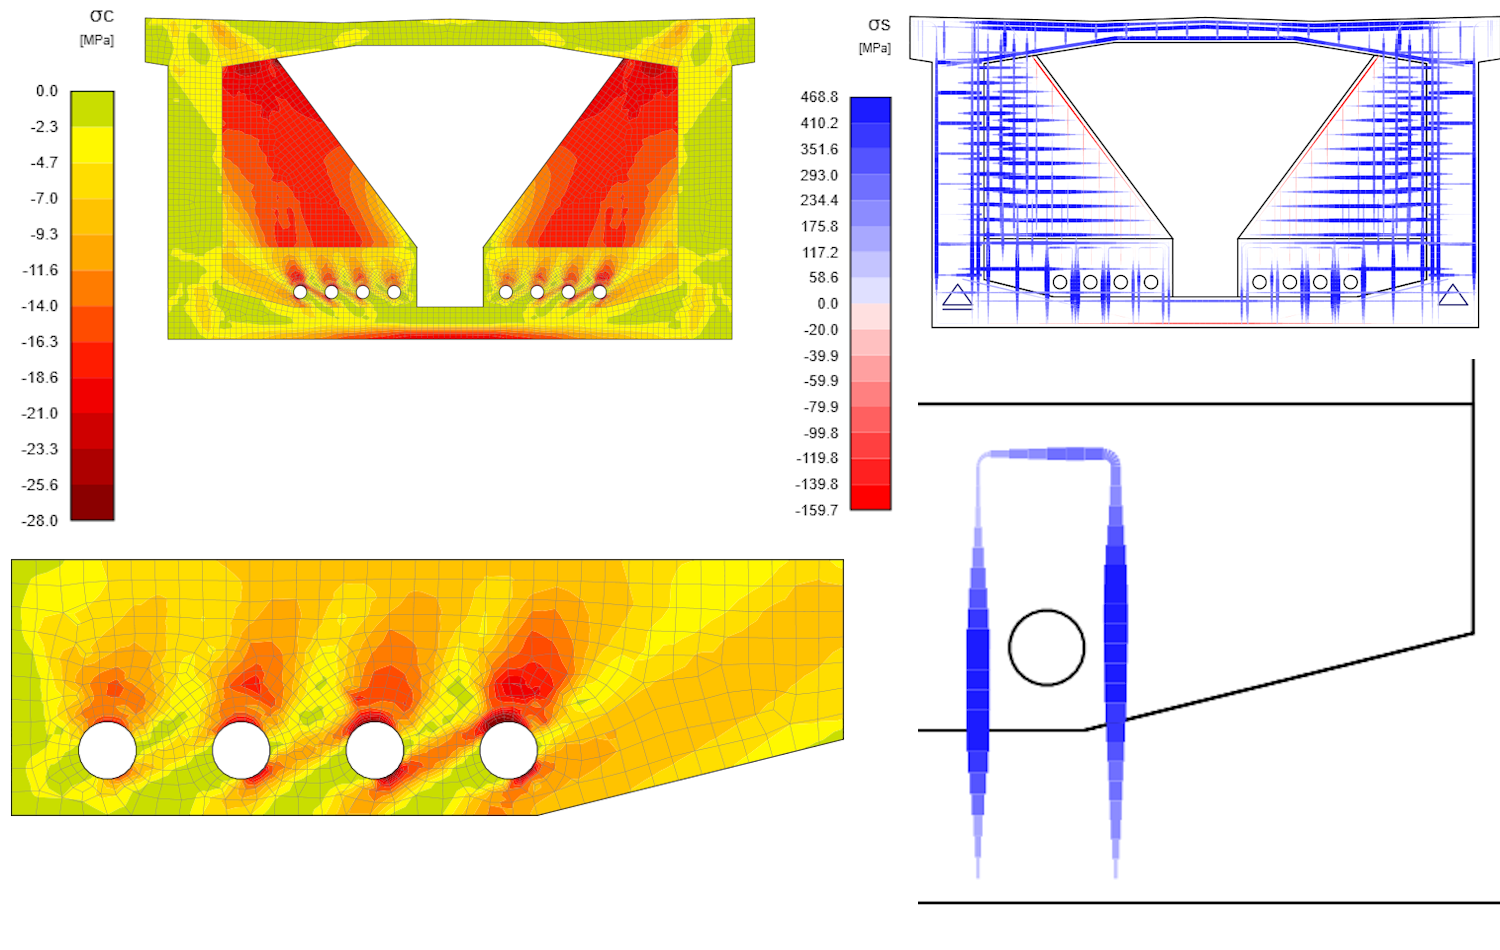
Abb. 3 Hauptspannung auf Druck (links), Spannung in der Bewehrung (rechts), maximale Spannung in Bewehrung und Beton im Detail
Das Betonschädigungsmodell – Modelle B und C
Methodenannahmen
Concrete Damage Plasticity (im Folgenden CDP) basiert auf der Drucker-Prager-Plastizitätsbedingung [2]. Dieses Modell eignet sich für Materialien mit innerer Reibung wie Böden oder Beton. Die Zugfestigkeit ist geringer als die Druckfestigkeit, und der hydrostatische Anteil des Spannungstensors spielt eine Rolle bei der Entwicklung der Plastizitätsfläche. Unter allgemeinem Spannungszustand hat die Plastizitätsbedingung die Oberfläche eines rotierenden Kegels. Das Materialmodell für Druck- und Zugspannungen berücksichtigt auch das postkritische Verhalten, das durch sogenannte Schädigungsparameter gesteuert wird, die Werte von null bis eins annehmen (für nahezu null elastische Steifigkeit des Betons auf Druck oder Zug im postkritischen Zustand). Je größer der Schädigungsparameter, desto stärker ist das Element geschädigt und trägt weniger zur Steifigkeit bei [2].
Materialmodelle
Das einachsige Materialmodell für Beton auf Druck und Zug basiert auf der Theorie von Thorenfeldt [4]. Alle Eingaben sind Bemessungswerte, die dem Zuverlässigkeitsansatz der EN 1992-1-1 [3] folgen. Das Materialmodell der Bewehrung B500B wird mit Zugverfestigung im plastischen Bereich berücksichtigt, ähnlich wie bei den Spannstählen Y1860 S7-15.2.
FEA-Elemente sowie Randbedingungen für Beton und Bewehrung
Das C3D8- bzw. Hexaeder-Element mit linearer Basisfunktion und acht Integrationspunkten wurde für das FEM-Modell des Betons verwendet. Die Beton- und Spannbewehrung besteht aus T3D2-Elementen, die nur axiale Wirkungen übertragen. Die Interaktion zwischen Bewehrung und Beton wird durch MPC-Randbedingungen gewährleistet, bei denen die Zugverfestigung berücksichtigt wird, was in gewissem Umfang das Verbundmodell oder den Dübeleffekt abdeckt. Die Auflager sind mit der Bewehrung durch Verteilungskopplung verbunden [2].
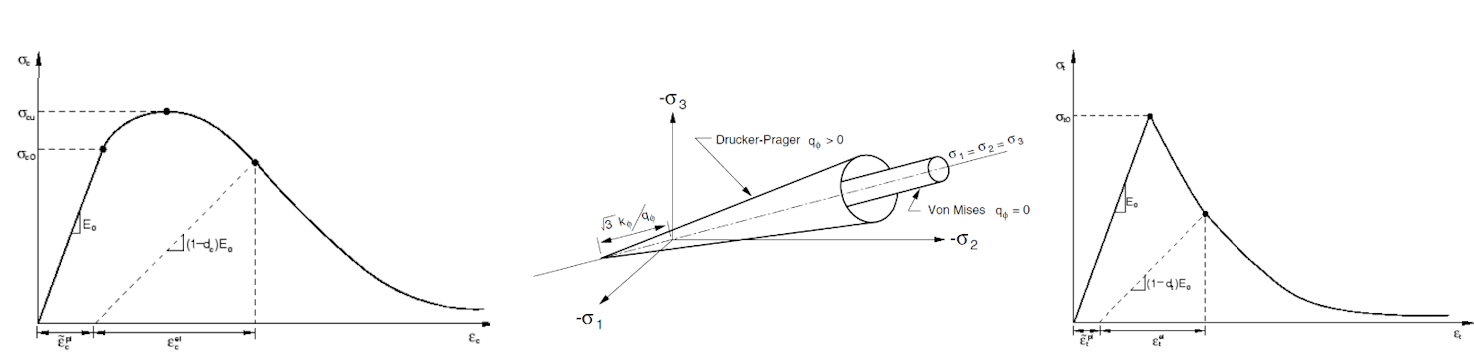
Abb. 4 Materialmodell auf Druck (links), Drucker-Prager-Plastizitätsfläche (Mitte), Materialmodell auf Zug (rechts)
Lasten und Randbedingungen
Die Randbedingungen für Modelle B und C sind identisch. Das Modell wird kraftbelastet, und die Einzelkraft wird über die Kontaktfläche des Hüllrohrs im Umlenker mittels Verteilungskopplung verteilt, was eine gleichmäßige Lastverteilung über die Dicke des Umlenkers gewährleistet. Die Punktauflager wurden mit einem Radius von 300 mm und über eine Dicke von 1.700 mm des Hohlkastenquerschnitts mit der Bewehrung durch Gleichungen der Verteilungskopplung verbunden.
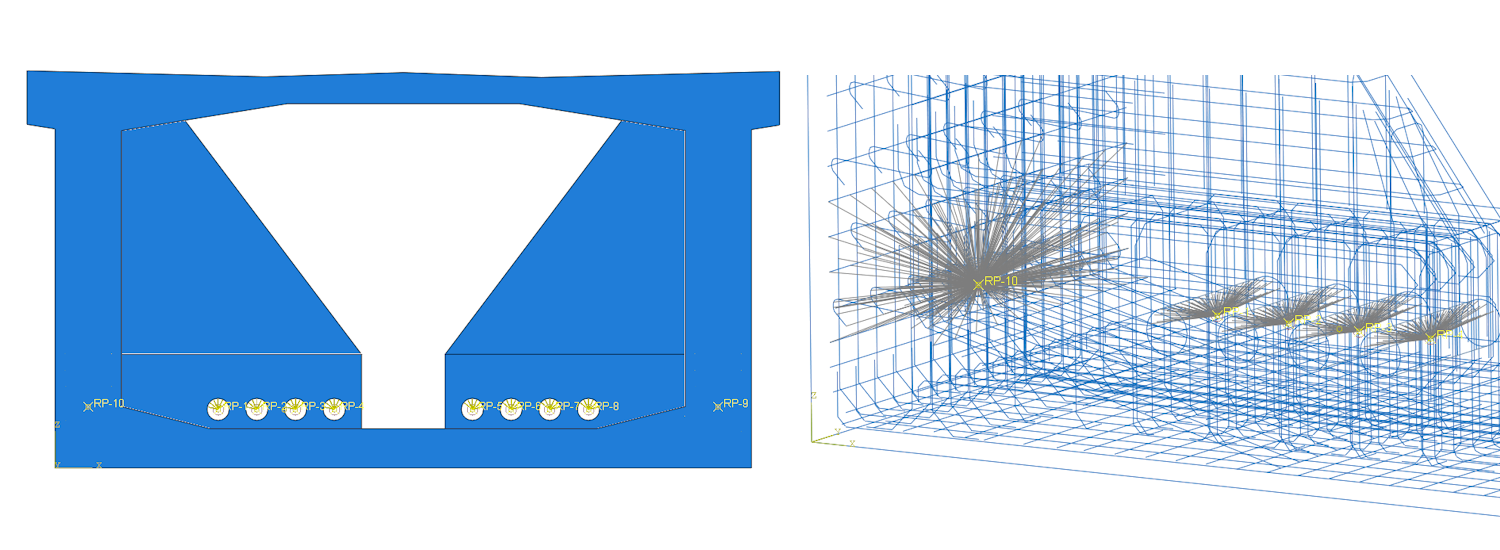
Abb. 5 Modell (links), Randbedingungen und Kopplungsgleichungen (rechts)
Ergebnisse – Modell B
Modell B setzt voraus, dass in Längsrichtung der Brücke keine Anfangsspannung vorhanden ist, was eine konservative Annahme darstellt. Aufgrund der räumlichen Spannungszustände und hauptsächlich der Konzentration beim Drücken der Ecke erfährt der Anschlussbereich der Versteifungswand an die obere Platte des Hohlkastenquerschnitts die höchste Druckspannung von -88 MPa. Wenn wir uns auf den Umlenkerbereich konzentrieren, können wir eine maximale Druckspannung von -23,5 MPa im Kontaktbereich zwischen dem Spannglied und dem Hüllrohr beobachten. Die Bewehrungsstäbe in der Nähe des Spannglied-Hüllrohrs erfahren eine Extremspannung von 439 MPa, die die Bodenplatte des Hohlkastenquerschnitts mit dem Umlenker verbindet. Die Stelle der Extremspannung stimmt mit Modell A überein.
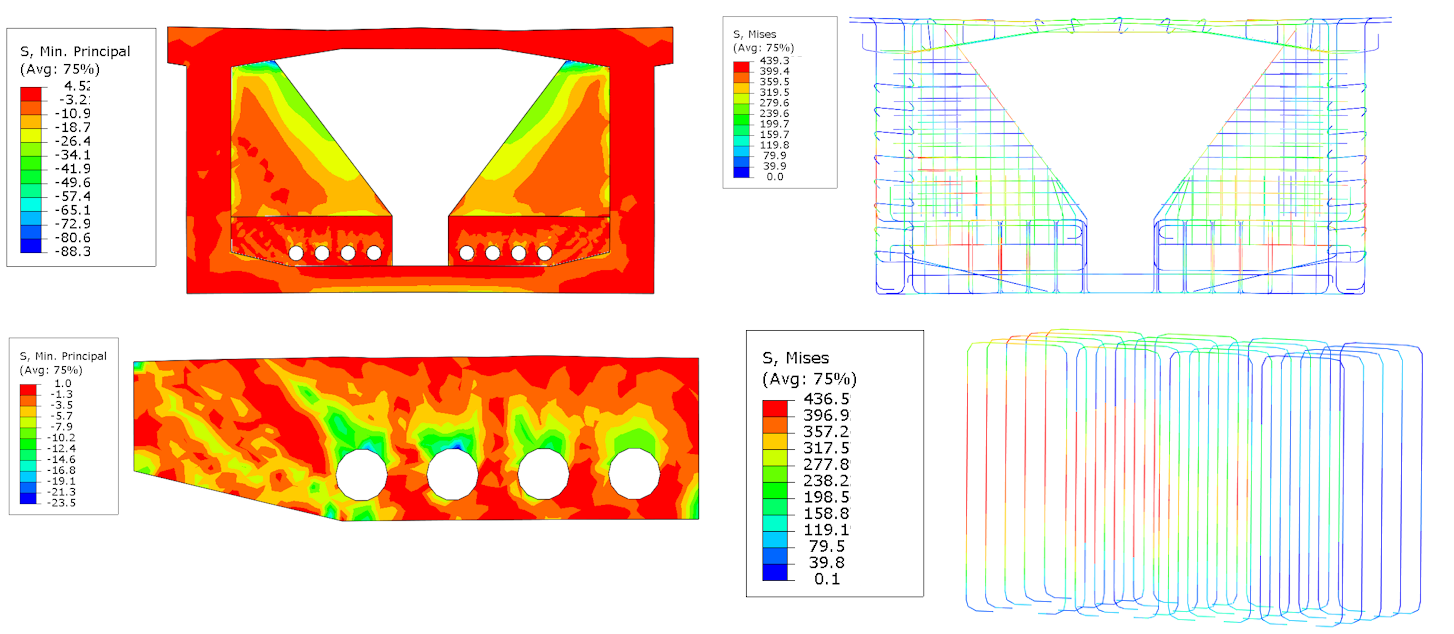
Abb. 6 Hauptspannung im Beton (links), Von-Mises-Spannung in den Stäben (rechts)
Ergebnisse – Modell C
Modell C setzt voraus, dass der Hohlkastenquerschnitt anfänglich unter gleichmäßiger Druckspannung steht. Infolgedessen ändert sich die Spannungsverteilung, was zu einer Verringerung der kritischen Druckspannung auf -74 MPa führt, wobei die Position gleich bleibt. Bei Betrachtung des Umlenkerbereichs hat der Anfangszustand des Querschnitts keinen wesentlichen Einfluss auf die Tragfähigkeit des Umlenkers, da der maßgebende Bereich innerhalb des Hohlkastenquerschnitts liegt. Die Lage und Position der Bewehrungsstäbe mit maximaler Spannung haben sich trotz des unterschiedlichen Anfangsspannungszustands im Vergleich zu Modell B nicht verändert. Die maximale Spannung hat nun 437 MPa erreicht.
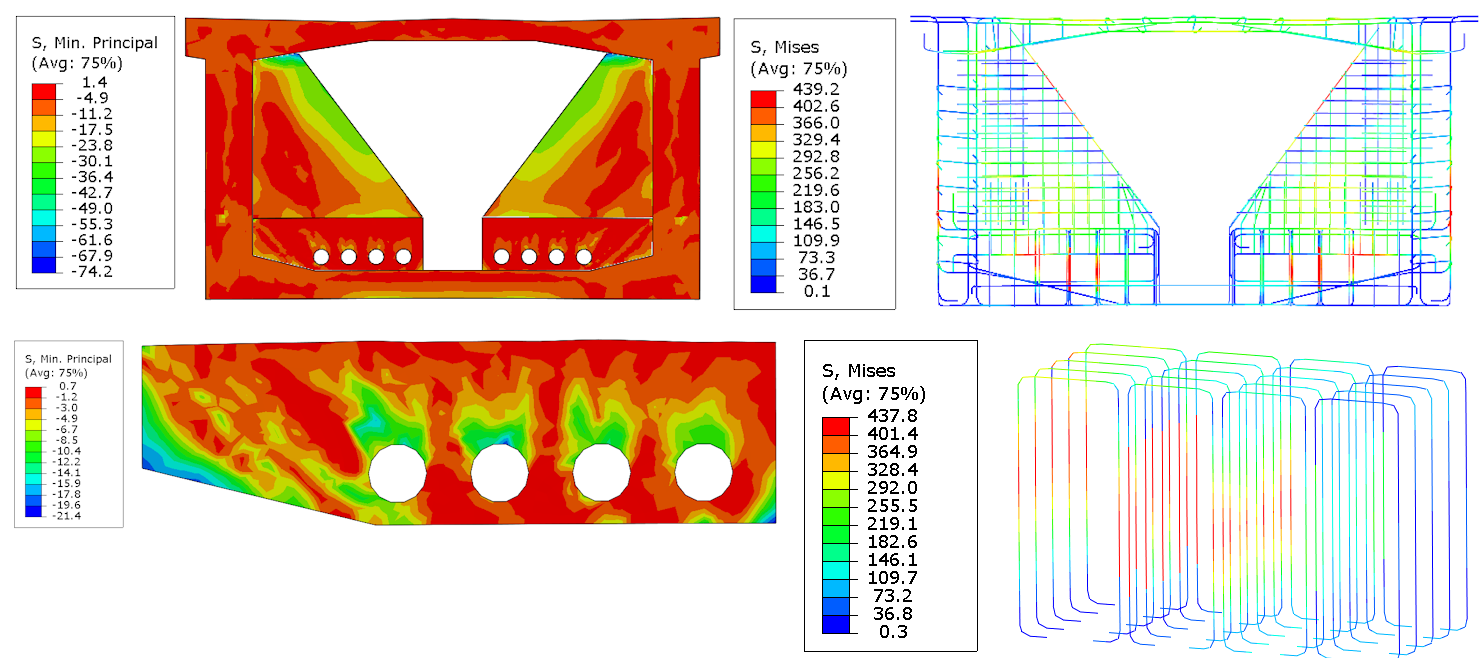
Abb. 7 Hauptspannung im Beton (links), Von-Mises-Spannung in den Stäben (rechts)
Reaktions-Verformungs-Diagramm
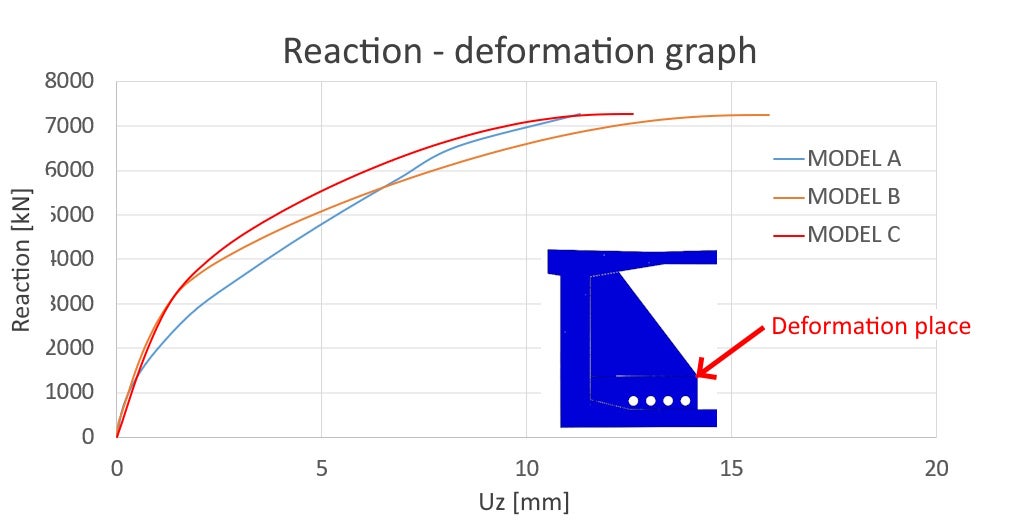
Der Nachweis des komplexen Verhaltens des Modells wird durch die Reaktions-Verformungs-Kurve erbracht. Der Verschiebungsextraktionspunkt wurde im Umlenker- und Versteifungswandbereich vorbestimmt. Die korrekte Interpretation der Ergebnisse erfordert einen unvoreingenommenen Ansatz. Die Berücksichtigung der Zugfestigkeit im Beton selbst hat Abweichungen zwischen den Modellen B und C und dem vereinfachten Modell A verursacht. Das vereinfachte Modell A vernachlässigt die Zugfestigkeit des Betons. Der Zugverfestigungseffekt wird nur auf das Materialdiagramm der Bewehrungsstäbe angewendet. Die Bemessungszugfestigkeit der Modelle B und C wurde auf Basis von Thorenfeldt [4] mit 1,6 MPa angesetzt, was etwa 0,3 MPa niedriger ist als die Bemessungszugfestigkeit gemäß EN 1992-1-1 [3]. Die resultierende Reaktion hat die Kriterien des Grenzzustands der Tragfähigkeit (GZT) erfüllt.
Schlussfolgerung
Vergleich
Ziel der Überprüfung war es, den Spannungs- und Verformungszustand zu kontrollieren, mit Schwerpunkt auf der Tragfähigkeit des Umlenkers auf Basis der Normannahmen [3]. Der Fokus lag darauf, die effektivste Lösung auf Basis der Ingenieurpraxis und Zeitersparnis zu identifizieren. Modell A berücksichtigt die Annahmen des ebenen Spannungszustands und basiert auf dem CSFM [1]. Das „Concrete Damage Plasticity"-Drucker-Prager-Modell [2] wurde für die Modelle B und C verwendet. Der kritische Bereich der maximalen Hauptdruckspannung wurde an unterschiedlichen Stellen zwischen Modell A und den Modellen B und C lokalisiert. Modell A zeigt eine Druckspannung von -28 MPa in der Nähe des Kontakts zwischen dem Spannglied und dem Umlenker-Hüllrohr. Bei den Modellen B und C ist die kritische Stelle dort, wo die Versteifungswand mit der oberen Platte des Hohlkastenquerschnitts zusammentrifft. Die Spannungswerte an scharfen Ecken haben sich auf bis zu -88 MPa für Modell A und -74 MPa für Modell B erhöht. Der Anfangszustand von Modell C verursachte eine Verringerung der Hauptdruckspannung um etwa 14 MPa. Betrachtet man den Umlenkerbereich, sind die Modelle B und C dem Modell A hinsichtlich der Erkennung kritischer Stellen ähnlich. Modell B zeigte -23,5 MPa und Modell C -21,4 MPa. Es lässt sich sagen, dass der Spannungszustand am Umlenker quasi unabhängig vom Anfangszustand, d. h. der Druckspannung im Hohlkastenquerschnitt, ist. Der Umlenker spielt eine entscheidende Rolle bei der Reduzierung der Hauptdruckspannung durch Erhöhung der Zugfestigkeit des Betons und der Spannungsverteilung in Längsrichtung. Vereinfachte Modelle wie Modell A oder das CSFM-Verfahren können zur effizienten Lösung dieser Aufgabe eingesetzt werden. Bei allen Modellen ist das Hüllrohr des Umlenkers in den Bügeln, die die Bodenplatte des Hohlkastenquerschnitts mit dem Umlenker verbinden, die kritische Stelle aus Bewehrungssicht. Der maximale Spannungswert in Modell A beträgt 469 MPa, während die Modelle B und C Spannungen von 439 MPa aufweisen, was den Einfluss der Zugfestigkeit des Betons verdeutlicht. Es lässt sich schlussfolgern, dass ein nachweisbarer Konsens hinsichtlich der Spannungen in der Betonbewehrung aus der Perspektive der kritischen Stelle besteht.
Lösungseffizienz
Das beste Modell für die praktische und zeiteffiziente Bearbeitung von Brückenumlenker ist Modell A. Dies liegt daran, dass der Tragwerksplaner alle Aufgaben, von der Modellvorbereitung bis zur Nachbearbeitung, innerhalb weniger Stunden abschließen kann, im Gegensatz zu den Modellen B und C, deren Bearbeitung mehrere Tage in Anspruch nimmt.
Literatur
[2] Abaqus analysis user's manual. Abaqus analysis user's manual [online] www: https://classes.engineering.wustl.edu/2009/spring/mase5513/abaqus/docs/v6.6/books/usb/default.htm?startat=pt05ch18s05abm36.html
[3] ČSN EN 1992-1-1 ed.2 (731201). Eurokód 2: Navrhování betonových konstrukcí – Část 1-1: Obecná pravidla a pravidla pro pozemní stavby. Praha: Český normalizační institut, 2019, 208 s.
[4] Massone, L. M.; et al. Shear-Flexure Interaction for Structural Walls, 2006. ResearchGate. https://www.researchgate.net/publication/284079633_Shear-flexure_interaction_for_structural_walls (accessed Jan 01, 2006).
[5] ČSN EN 1992-2 (736208). Eurokód 2: Navrhování betonových konstrukcí – Část 2: Betonové mosty – Navrhování a konstrukční zásady. Praha: Český normalizační institut, 2019, 90 s.