
Jak začít s API - Optimalizace komponent ve styčníku 04
První kroky
Doporučujeme projít tutoriál Jak začít s API - Základy 01, který vás seznámí s API a nastavením prostředí.
Soubor přípoje
Tento příklad vychází ze souborů vytvořených v rámci tutoriálu Jak začít s API - Import šablony a spuštění výpočtu 03.
Stáhněte si soubor tutorial 03 with template-new.ideaCon.
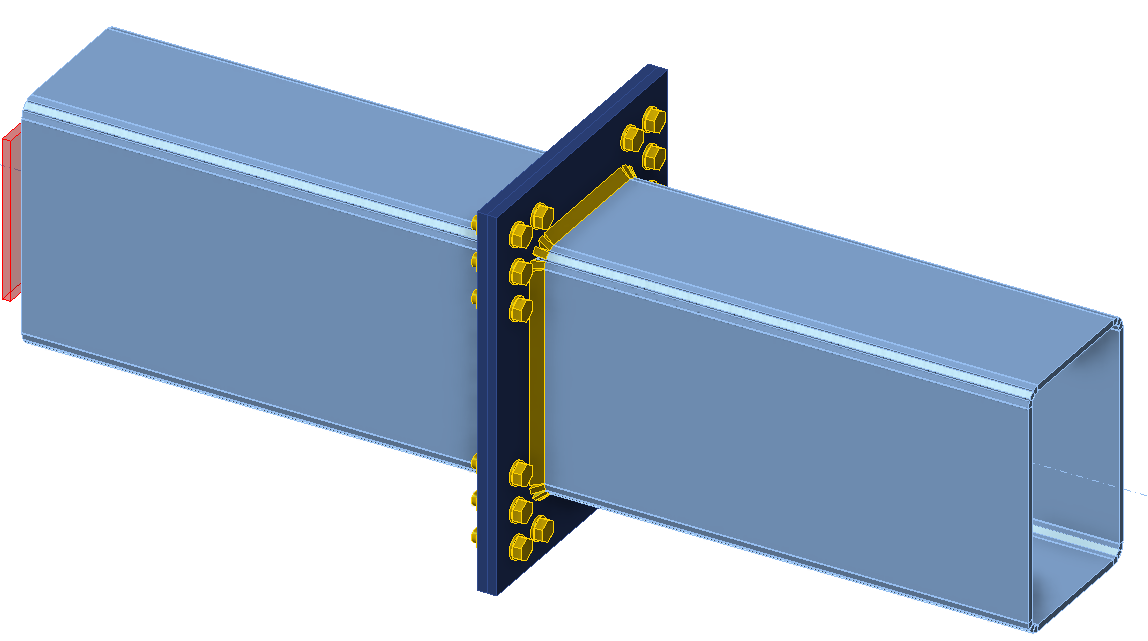
Chceme optimalizovat komponenty přípoje (svary, průměr a počet šroubů). Výsledkem optimalizace jsou náklady na styčník, které jsou přehledně zobrazeny v grafu.
Python klient
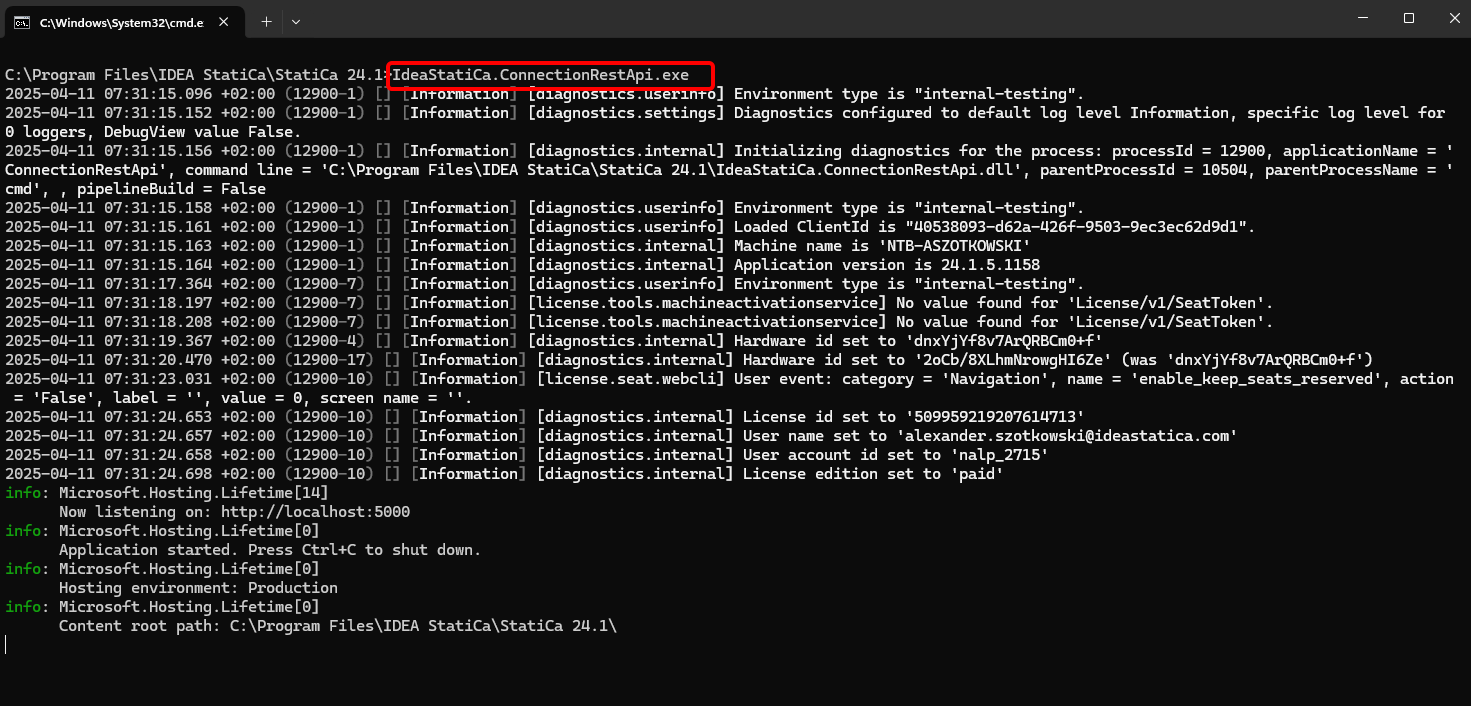
Spusťte "IdeaStatiCa.ConnectionRestApi.exe" v CMD ve správné složce IDEA StatiCa a otevřete IDE nástroj dle vašeho výběru.
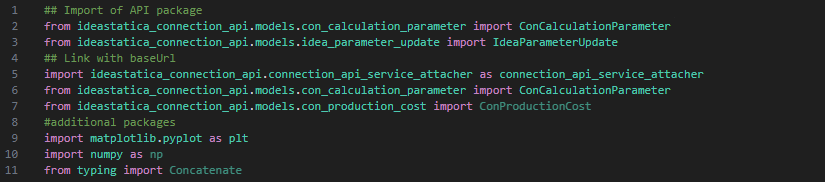
- Vytvořte nový soubor a importujte balíčky, které umožní použití výpočtu a propojení s URL localhost.
Zdrojový kód:
## Import balíčku API
from ideastatica_connection_api.models.con_calculation_parameter import ConCalculationParameter
## Propojení s baseUrl
import ideastatica_connection_api.connection_api_service_attacher as connection_api_service_attacher
from ideastatica_connection_api.models.con_calculation_parameter import ConCalculationParameterfrom ideastatica_connection_api.models.con_production_cost import ConProductionCost
#dodatečné balíčky
import matplotlib.pyplot as plt
import numpy as np
from typing import Concatenate
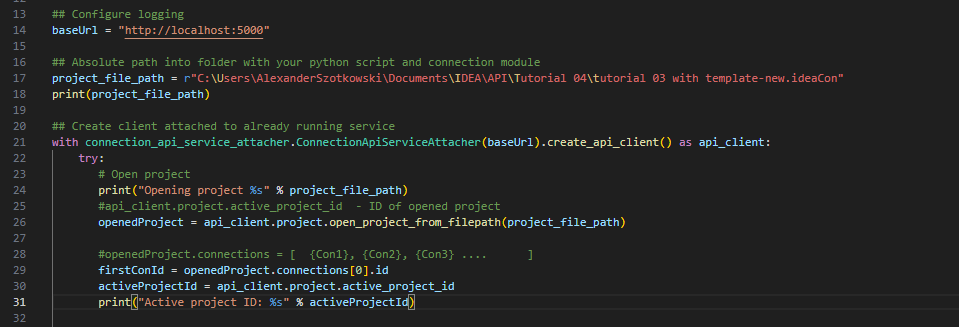
- Nakonfigurujte protokolování pomocí proměnné "baseUrl," která načte váš localhost. Ve druhém kroku spárujte absolutní cestu k souboru IDEA StatiCa Connection.
## Konfigurace protokolování
baseUrl = "http://localhost:5000"
## Absolutní cesta do složky s vaším pythonovým skriptem a modulem přípoje
project_file_path = r"C:\Users\AlexanderSzotkowski\Documents\IDEA\API\Tutorial 04\tutorial 03 with template -new.ideaCon"
print(project_file_path)
- Spárujte klienta s již běžící službou. Použijte blok try/except – pokud blok try vyvolá chybu, bude proveden blok except. V první fázi je nutné otevřít projekt a najít ID projektu, které je jedinečné pro každý projekt IDEA StatiCa. Poté vybereme první přípoj uložený v našem souboru.
# Vytvoření klienta připojeného k již běžící službě
with connection_api_service_attacher.ConnectionApiServiceAttacher(baseUrl).create_api_client() as api_client:
try:
# Otevření projektu
print("Opening project %s" % project_file_path)
#api_client.project.active_project_id - ID otevřeného projektu
openedProject = api_client.project.open_project_from_filepath(project_file_path)
#openedProject.connections = [ {Con1}, {Con2}, {Con3} .... ]
firstConId = openedProject.connections[0].id
activeProjectId = api_client.project.active_project_id
print("Active project ID: %s" % activeProjectId)
- Načtěte všechny potřebné parametry ze souboru ideaCon (počet šroubů, průměr, velikost svaru, sestava šroubů)
#získání parametrů ze souboru ideaCon
include_hidden = True
parameters = api_client.parameter.get_parameters(activeProjectId, firstConId, include_hidden=include_hidden)
#získání výchozích hodnot ze souboru ideaCon
#Průměr šroubu
boltParameter = parameters[3]
#print('bolt ',boltParameter.value)
#Počet řad šroubů
rowParameter = parameters[11]
#print('row ',rowParameter.value)
#Velikost svaru
weldParameter = parameters[28]
#print('weld ',weldParameter.value)
#Sestava šroubů
boltAssemblyParameter = parameters[29]
#print('bolt assembly ',boltAssemblyParameter.value)
- Chceme získat výsledky pouze tehdy, když je výpočet 100% pozitivní pro všechny části (plechy, svary, šrouby), proto musíme nastavit Zastavit na mezním přetvoření na True. Výsledky budou uloženy v seznamu nazvaném matrix, který pak použijeme k zobrazení grafu.
#nastavení
updateSettings = api_client.settings.get_settings(api_client.project.active_project_id)
from typing import Dict
updateSettings: Dict [str, object] = {
"calculationCommon/Analysis/AnalysisGeneral/Shared/StopAtLimitStrain@01" : True,
"calculationCommon/Checks/Shared/LimitPlasticStrain@01" : 0.05
}
api_client.settings.update_settings(api_client.project.active_project_id, updateSettings)
#Databáze konečných výsledků
matrix = []

- Nyní spustíme cyklus, ve kterém měníme svary (od t = 8 do 5 mm), průměr šroubu (od M16 do M12) a počet řad (od 3 do 1). Čísla 8, M16 a 3 jsou hodnoty převzaté ze souboru ideaCon. Průběžné výsledky jsou vypisovány na obrazovku a také přidávány do seznamu výsledků.
#procházení svary s danými řadami a šrouby
for row in range(rowParameter.value,1, -1):
#print ('Number of bolt rows is', row)
for bolt in range(int(1000*boltParameter.value), 12,-2):
for weld in range(int(1000*weldParameter.value), 5,-1):
par_row = IdeaParameterUpdate() # Vytvoření nové instance
par_row.key = rowParameter.key
par_row.expression = str(row)
par_bolt = IdeaParameterUpdate() # Vytvoření nové instance
par_bolt.key = boltParameter.key
par_bolt.expression = str(bolt/1000) # Snížení výrazu
par_boltAssembly = IdeaParameterUpdate() # Vytvoření nové instance
par_boltAssembly.key = boltAssemblyParameter.key
par_boltAssembly.expression = str('M'+ str(bolt) + ' 8.8')
par_weld = IdeaParameterUpdate() # Vytvoření nové instance
par_weld.key = weldParameter.key
par_weld.expression = str(weld/1000) # Snížení výrazu
updateResponse = api_client.parameter.update(activeProjectId, firstConId, [par_row, par_bolt, par_boltAssembly, par_weld] )
updateResponse.set_to_model
# Ověření, zda byly parametry úspěšně aktualizovány
if updateResponse.set_to_model == False:
print('Parameters failed: %s' % ', '.join(updateResponse.failed_validations))
#nastavení typu analýzy
ConCalculationParameter.analysis_type = "stress_strain"
conParameter = ConCalculationParameter()
conParameter.connection_ids = [ firstConId ]
summary = api_client.calculation.calculate(activeProjectId, conParameter.connection_ids)
# Získání výsledků po výpočtu, uložení do samostatného souboru a výpis aktuálních výsledků
results = api_client.calculation.get_results(activeProjectId, conParameter.connection_ids)
CheckResSummary = results[0].check_res_summary
costs = api_client.connection.get_production_cost(api_client.project.active_project_id, firstConId)
api_client.project.download_project(activeProjectId, r'C:\Users\AlexanderSzotkowski\Documents\IDEA\API\Tutorial 04\tutorial 03 with template-updated.ideaCon')
if CheckResSummary[0].check_status == False:
break
if CheckResSummary[0].check_status == True:
print (row,'rows of', bolt, 'bolts', 'and weld size ',par_weld.expression,' results are OK. Costs: ', costs.total_estimated_cost)
values= [row, bolt,par_weld.expression,costs.total_estimated_cost]
#print(values)
matrix.append(values)
else:
print ('Iteration %i failed' % weld)
else:
print ('Iteration %i for weld failed' % weld)
else:
print ('Iteration %i for bolts failed' % bolt)
else:
print ('Iteration %i for rows failed' % row)

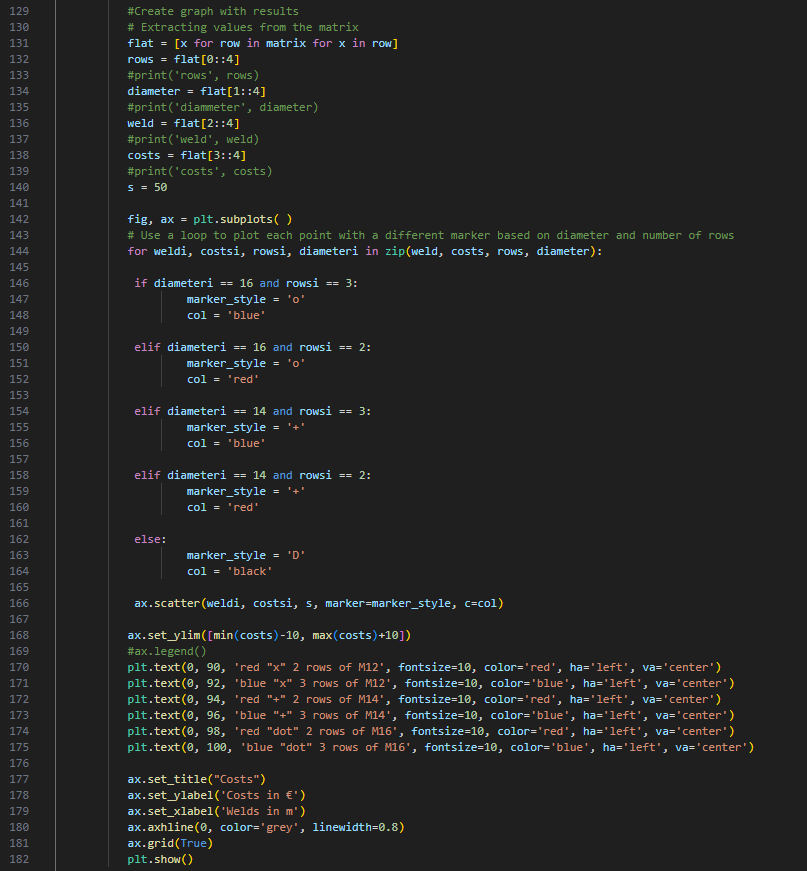
- Poslední část se týká vytvoření grafu s našimi výsledky.
#Vytvoření grafu s výsledky
# Extrakce hodnot z matice
flat = [x for row in matrix for x in row]
rows = flat[0::4]
#print('rows', rows)
diameter = flat[1::4]
#print('diammeter', diameter)
weld = flat[2::4]
#print('weld', weld)
costs = flat[3::4]
#print('costs', costs)
s = 50
fig, ax = plt.subplots( )
# Použití smyčky pro vykreslení každého bodu s různým značkovačem podle průměru a počtu řad
for weldi, costsi, rowsi, diameteri in zip(weld, costs, rows, diameter):
if diameteri == 16 and rowsi == 3:
marker_style = 'o'
col = 'blue'
elif diameteri == 16 and rowsi == 2:
marker_style = 'o'
col = 'red'
elif diameteri == 14 and rowsi == 3:
marker_style = '+'
col = 'blue'
elif diameteri == 14 and rowsi == 2:
marker_style = '+'
col = 'red'
else:
marker_style = 'D'
col = 'black'
ax.scatter(weldi, costsi, s, marker=marker_style, c=col)
ax.set_ylim([min(costs)-10, max(costs)+10])
#ax.legend()
plt.text(0, 90, 'red "x" 2 rows of M12', fontsize=10, color='red', ha='left', va='center')
plt.text(0, 92, 'blue "x" 3 rows of M12', fontsize=10, color='blue', ha='left', va='center')
plt.text(0, 94, 'red "+" 2 rows of M14', fontsize=10, color='red', ha='left', va='center')
plt.text(0, 96, 'blue "+" 3 rows of M14', fontsize=10, color='blue', ha='left', va='center')
plt.text(0, 98, 'red "dot" 2 rows of M16', fontsize=10, color='red', ha='left', va='center')
plt.text(0, 100, 'blue "dot" 3 rows of M16', fontsize=10, color='blue', ha='left', va='center')
ax.set_title("Costs")
ax.set_ylabel('Costs in €')
ax.set_xlabel('Welds in m')
ax.axhline(0, color='grey', linewidth=0.8)
ax.grid(True)
plt.show()
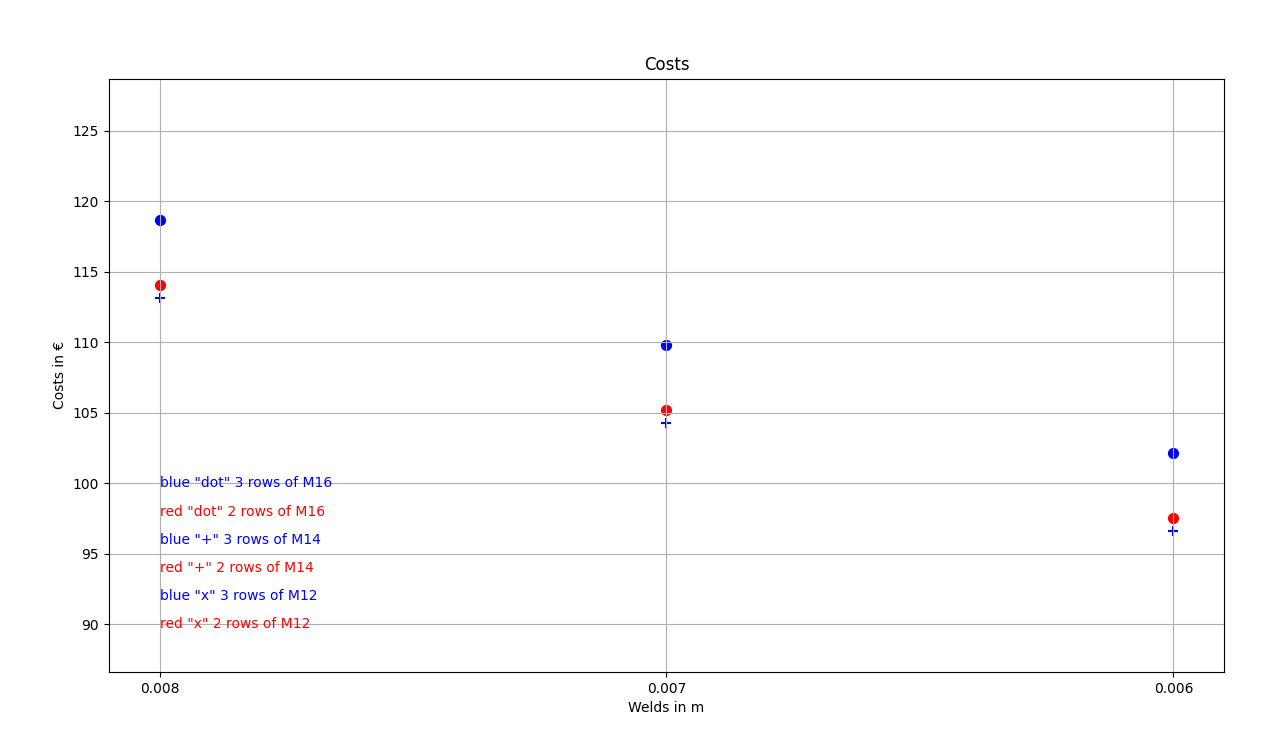
Jak vidíte, v tomto konkrétním případě je nejekonomičtější styčník ten se svarem 6 mm a třemi řadami šroubů M14.
Přiložené soubory ke stažení
- tutorial 04 - 3 optimize bolts and welds.py (PY, 9 kB)
- tutorial 03 with template-new.ideaCon (IDEACON, 59 kB)