
Cómo empezar con la API - Optimizar componentes en una unión 04
Primeros pasos
Recomendamos seguir el tutorial Cómo empezar con la API - Conceptos básicos 01, que le enseña sobre la API y cómo configurar el entorno.
Archivo de unión
Este ejemplo se basa en archivos creados en el tutorial Cómo empezar con la API - Importar una plantilla y ejecutar el cálculo 03.
Por favor, descargue el archivo tutorial 03 with template-new.ideaCon.
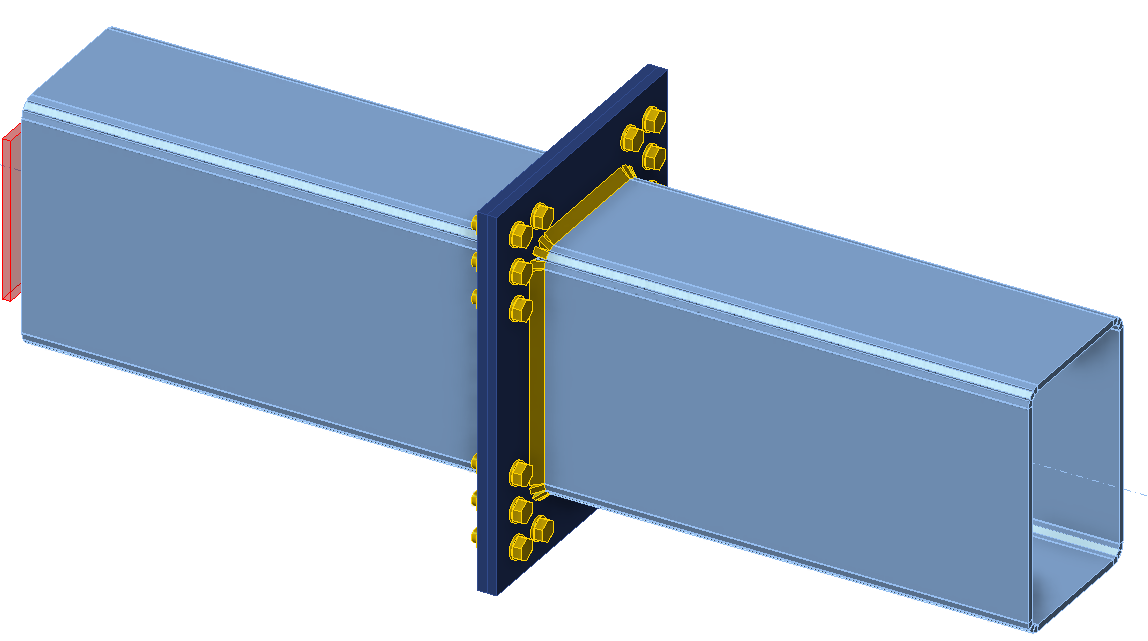
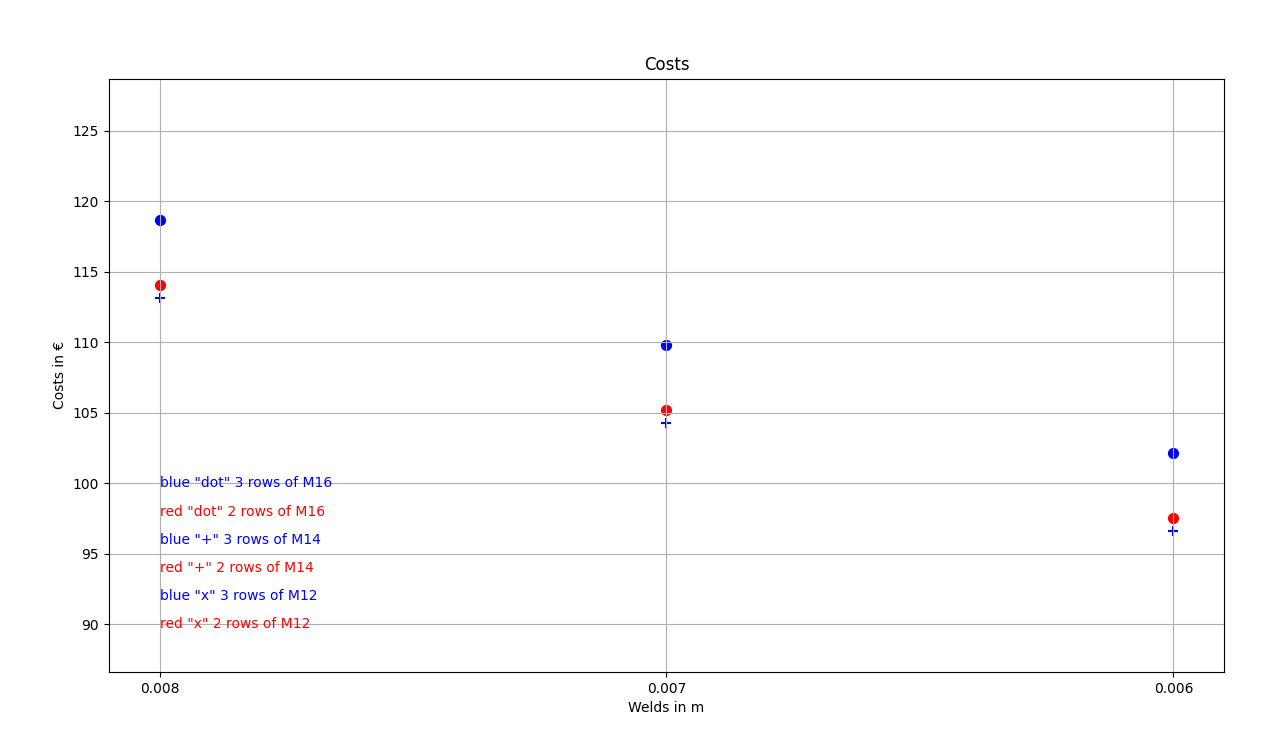
Queremos optimizar los componentes de la unión (soldaduras, diámetro y número de pernos). El resultado de la optimización son los costes de la junta, que se presentan de forma clara en un gráfico.
Cliente Python
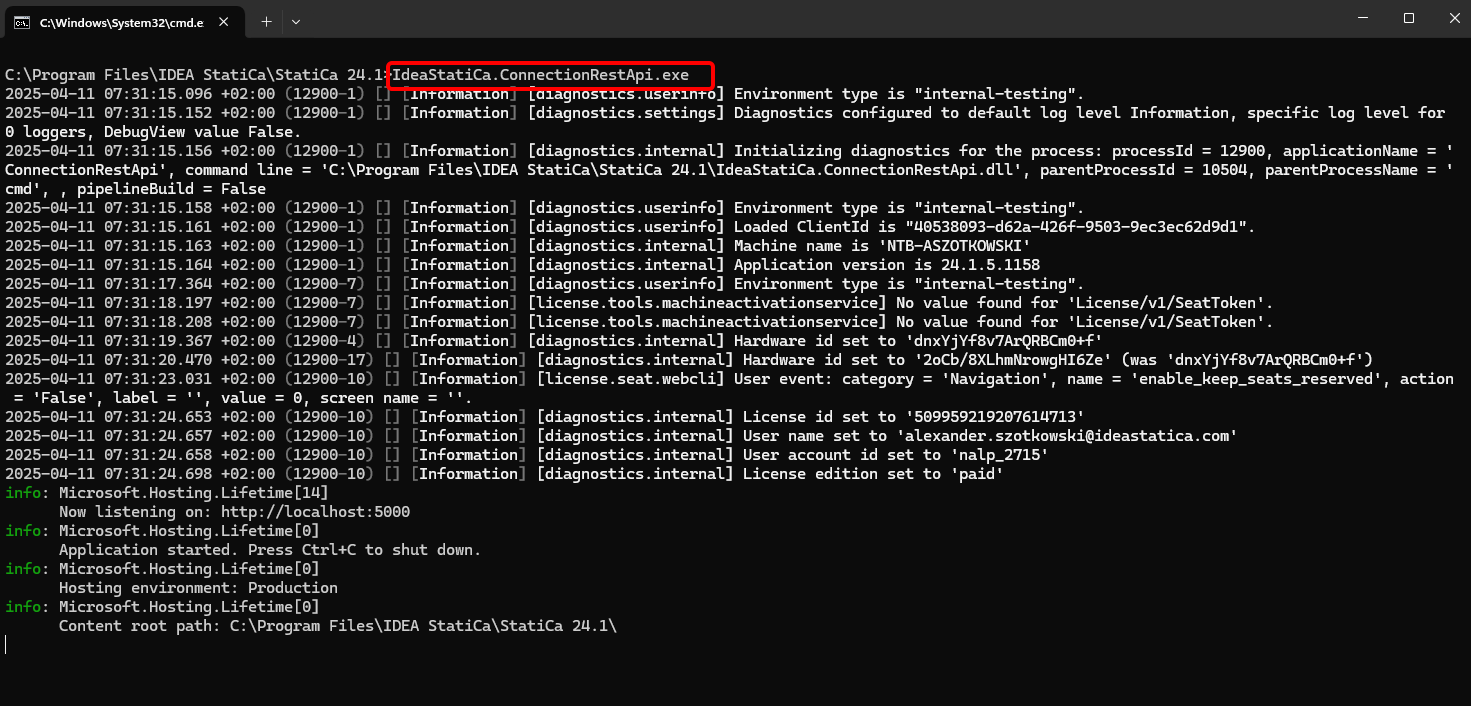
Ejecute "IdeaStatiCa.ConnectionRestApi.exe" en CMD dentro de la carpeta correcta de IDEA StatiCa y abra la herramienta IDE de su elección.
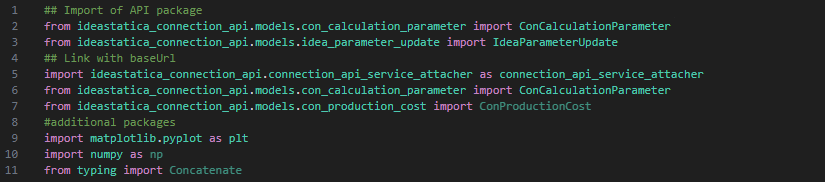
- Cree un nuevo archivo e importe los paquetes que permitirán el uso del cálculo y la vinculación con la URL del localhost.
Código fuente:
## Import of API package
from ideastatica_connection_api.models.con_calculation_parameter import ConCalculationParameter
## Link with baseUrl
import ideastatica_connection_api.connection_api_service_attacher as connection_api_service_attacher
from ideastatica_connection_api.models.con_calculation_parameter import ConCalculationParameterfrom ideastatica_connection_api.models.con_production_cost import ConProductionCost
#additional packages
import matplotlib.pyplot as plt
import numpy as np
from typing import Concatenate
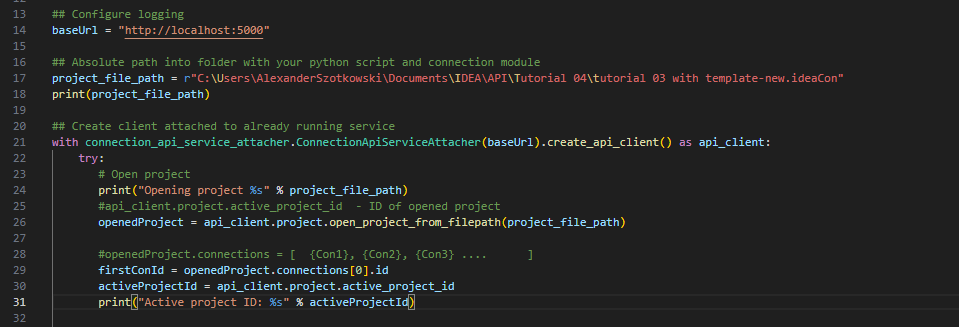
- Configure el registro mediante la variable "baseUrl", que abrirá su localhost. En el segundo paso, vincule la ruta absoluta de su archivo de IDEA StatiCa Connection.
## Configure logging
baseUrl = "http://localhost:5000"
## Absolute path into folder with your python script and connection module
project_file_path = r"C:\Users\AlexanderSzotkowski\Documents\IDEA\API\Tutorial 04\tutorial 03 with template -new.ideaCon"
print(project_file_path)
- Vincule el cliente con un servicio ya en ejecución. Utilice el bloque try/except - dado que el bloque try genera un error, se ejecutará el bloque except. En la primera fase, es necesario abrir el proyecto y encontrar el ID del proyecto, que es único para cada proyecto de IDEA StatiCa. Luego seleccionamos la primera unión almacenada en nuestro archivo.
# Create a client attached to an already running service
with connection_api_service_attacher.ConnectionApiServiceAttacher(baseUrl).create_api_client() as api_client:
try:
# Open project
print("Opening project %s" % project_file_path)
#api_client.project.active_project_id - ID of opened project
openedProject = api_client.project.open_project_from_filepath(project_file_path)
#openedProject.connections = [ {Con1}, {Con2}, {Con3} .... ]
firstConId = openedProject.connections[0].id
activeProjectId = api_client.project.active_project_id
print("Active project ID: %s" % activeProjectId)
- Recupere todos los parámetros necesarios del ideaCon (número de pernos, diámetro, tamaño de soldadura, conjunto de pernos)
#get parameters from ideaCon file
include_hidden = True
parameters = api_client.parameter.get_parameters(activeProjectId, firstConId, include_hidden=include_hidden)
#get default values from the ideaCon file
#Diameter of the bolt
boltParameter = parameters[3]
#print('bolt ',boltParameter.value)
#Number of bolt rows
rowParameter = parameters[11]
#print('row ',rowParameter.value)
#Weld size
weldParameter = parameters[28]
#print('weld ',weldParameter.value)
#Bolt assembly
boltAssemblyParameter = parameters[29]
#print('bolt assembly ',boltAssemblyParameter.value)
- Queremos obtener resultados solo cuando el cálculo sea 100% positivo para todas las partes (placas, soldaduras, pernos), por lo que debemos establecer Detener en la deformación límite en True. Los resultados se almacenarán en una lista llamada matrix, que luego utilizamos para mostrar un gráfico.
#setup
updateSettings = api_client.settings.get_settings(api_client.project.active_project_id)
from typing import Dict
updateSettings: Dict [str, object] = {
"calculationCommon/Analysis/AnalysisGeneral/Shared/StopAtLimitStrain@01" : True,
"calculationCommon/Checks/Shared/LimitPlasticStrain@01" : 0.05
}
api_client.settings.update_settings(api_client.project.active_project_id, updateSettings)
#Final results database
matrix = []

- Ahora iniciamos un ciclo cambiando las soldaduras (de t = 8 a 5 mm), el diámetro del perno (de M16 a M12) y el número de filas (de 3 a 1). Los números 8, M16 y 3 son valores tomados del archivo ideaCon. Los resultados en curso se imprimen en pantalla y también se añaden a la lista de resultados.
#cycling through welds with given rows and bolts
for row in range(rowParameter.value,1, -1):
#print ('Number of bolt rows is', row)
for bolt in range(int(1000*boltParameter.value), 12,-2):
for weld in range(int(1000*weldParameter.value), 5,-1):
par_row = IdeaParameterUpdate() # Create a new instance
par_row.key = rowParameter.key
par_row.expression = str(row)
par_bolt = IdeaParameterUpdate() # Create a new instance
par_bolt.key = boltParameter.key
par_bolt.expression = str(bolt/1000) # Decrement the expression
par_boltAssembly = IdeaParameterUpdate() # Create a new instance
par_boltAssembly.key = boltAssemblyParameter.key
par_boltAssembly.expression = str('M'+ str(bolt) + ' 8.8')
par_weld = IdeaParameterUpdate() # Create a new instance
par_weld.key = weldParameter.key
par_weld.expression = str(weld/1000) # Decrement the expression
updateResponse = api_client.parameter.update(activeProjectId, firstConId, [par_row, par_bolt, par_boltAssembly, par_weld] )
updateResponse.set_to_model
# Check if the parameters were updated successfully
if updateResponse.set_to_model == False:
print('Parameters failed: %s' % ', '.join(updateResponse.failed_validations))
#set the type of analysis
ConCalculationParameter.analysis_type = "stress_strain"
conParameter = ConCalculationParameter()
conParameter.connection_ids = [ firstConId ]
summary = api_client.calculation.calculate(activeProjectId, conParameter.connection_ids)
# Obtener resultados tras el cálculo, almacenarlos en un archivo separado e imprimir los resultados actuales
results = api_client.calculation.get_results(activeProjectId, conParameter.connection_ids)
CheckResSummary = results[0].check_res_summary
costs = api_client.connection.get_production_cost(api_client.project.active_project_id, firstConId)
api_client.project.download_project(activeProjectId, r'C:\Users\AlexanderSzotkowski\Documents\IDEA\API\Tutorial 04\tutorial 03 with template-updated.ideaCon')
if CheckResSummary[0].check_status == False:
break
if CheckResSummary[0].check_status == True:
print (row,'rows of', bolt, 'bolts', 'and weld size ',par_weld.expression,' results are OK. Costs: ', costs.total_estimated_cost)
values= [row, bolt,par_weld.expression,costs.total_estimated_cost]
#print(values)
matrix.append(values)
else:
print ('Iteration %i failed' % weld)
else:
print ('Iteration %i for weld failed' % weld)
else:
print ('Iteration %i for bolts failed' % bolt)
else:
print ('Iteration %i for rows failed' % row)

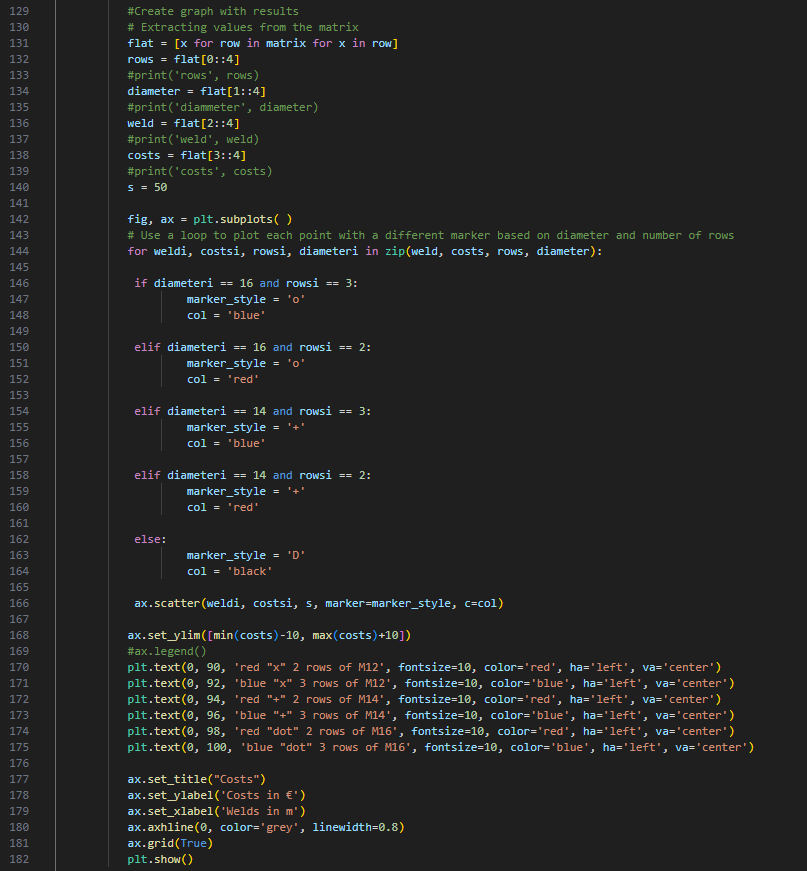
- La última parte consiste en crear un gráfico con nuestros resultados.
#Create graph with results
# Extracting values from the matrix
flat = [x for row in matrix for x in row]
rows = flat[0::4]
#print('rows', rows)
diameter = flat[1::4]
#print('diammeter', diameter)
weld = flat[2::4]
#print('weld', weld)
costs = flat[3::4]
#print('costs', costs)
s = 50
fig, ax = plt.subplots( )
# Use a loop to plot each point with a different marker based on diameter and number of rows
for weldi, costsi, rowsi, diameteri in zip(weld, costs, rows, diameter):
if diameteri == 16 and rowsi == 3:
marker_style = 'o'
col = 'blue'
elif diameteri == 16 and rowsi == 2:
marker_style = 'o'
col = 'red'
elif diameteri == 14 and rowsi == 3:
marker_style = '+'
col = 'blue'
elif diameteri == 14 and rowsi == 2:
marker_style = '+'
col = 'red'
else:
marker_style = 'D'
col = 'black'
ax.scatter(weldi, costsi, s, marker=marker_style, c=col)
ax.set_ylim([min(costs)-10, max(costs)+10])
#ax.legend()
plt.text(0, 90, 'red "x" 2 rows of M12', fontsize=10, color='red', ha='left', va='center')
plt.text(0, 92, 'blue "x" 3 rows of M12', fontsize=10, color='blue', ha='left', va='center')
plt.text(0, 94, 'red "+" 2 rows of M14', fontsize=10, color='red', ha='left', va='center')
plt.text(0, 96, 'blue "+" 3 rows of M14', fontsize=10, color='blue', ha='left', va='center')
plt.text(0, 98, 'red "dot" 2 rows of M16', fontsize=10, color='red', ha='left', va='center')
plt.text(0, 100, 'blue "dot" 3 rows of M16', fontsize=10, color='blue', ha='left', va='center')
ax.set_title("Costs")
ax.set_ylabel('Costs in €')
ax.set_xlabel('Welds in m')
ax.axhline(0, color='grey', linewidth=0.8)
ax.grid(True)
plt.show()
Como puede ver, en este caso particular, la junta más económica es la que tiene una soldadura de 6 mm y tres filas de pernos M14.
Descargas adjuntas
- tutorial 04 - 3 optimize bolts and welds.py (PY, 9 kB)
- tutorial 03 with template-new.ideaCon (IDEACON, 59 kB)