
Come iniziare con le API - Ottimizzare i componenti in un giunto 04
Primi passi
Si consiglia di seguire il tutorial Come iniziare con le API - Nozioni di base 01, che illustra le API e come configurare l'ambiente.
File di collegamento
Questo esempio si basa sui file creati nel tutorial Come iniziare con le API - Importare un modello ed eseguire il calcolo 03.
Scaricare il file tutorial 03 with template-new.ideaCon.
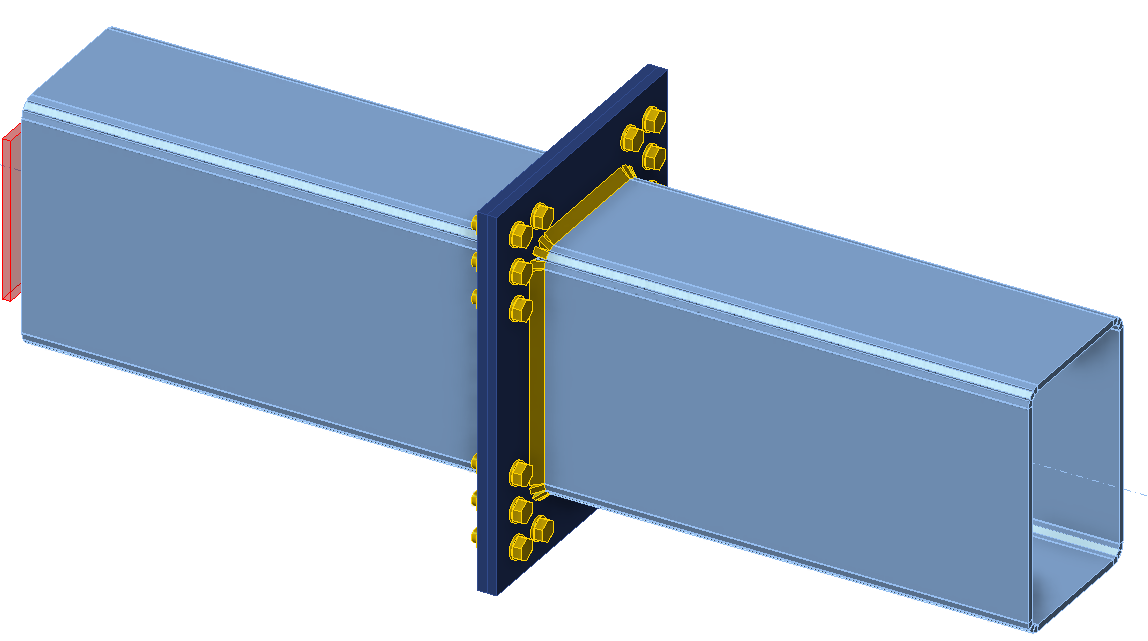
Si desidera ottimizzare i componenti del collegamento (saldature, diametro e numero di bulloni). Il risultato dell'ottimizzazione è il costo del giunto, presentato in modo chiaro in un grafico.
Client Python
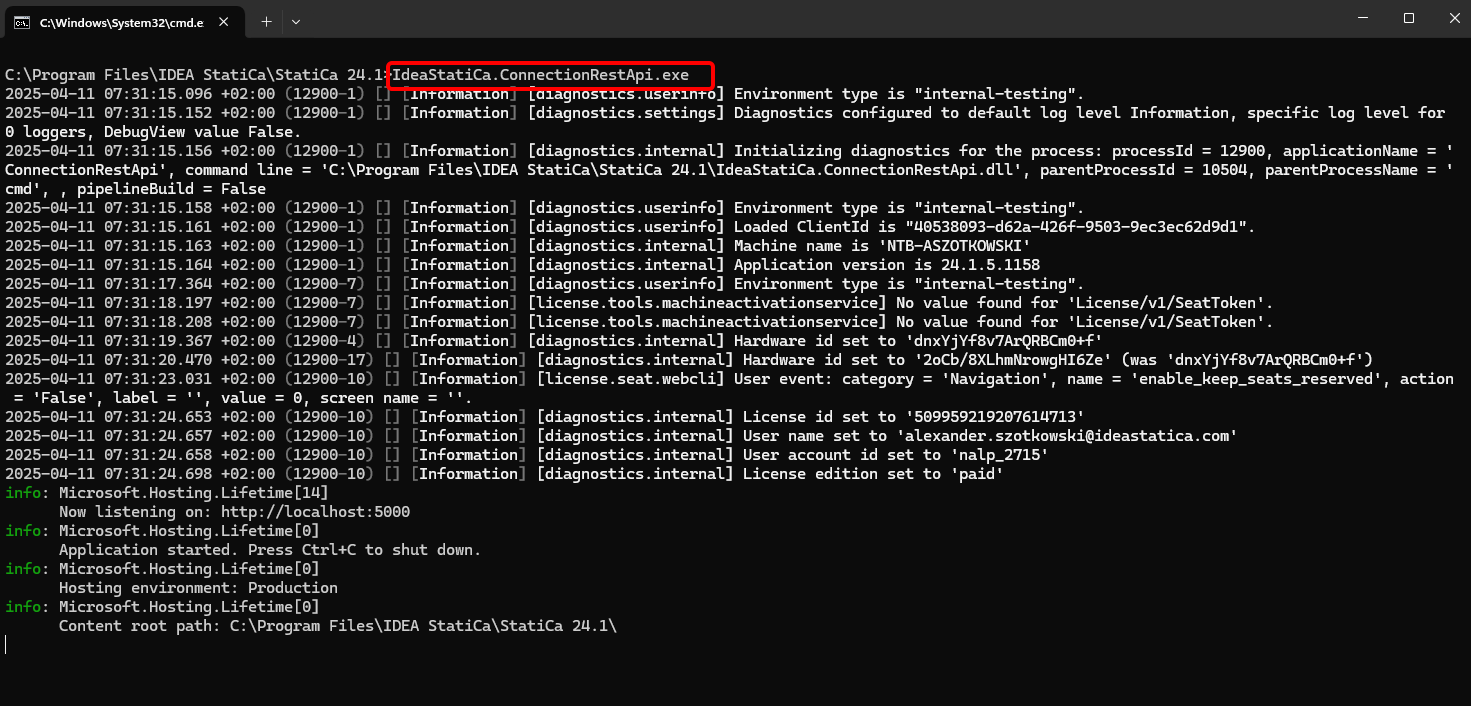
Eseguire "IdeaStatiCa.ConnectionRestApi.exe" in CMD nella cartella IDEA StatiCa appropriata e aprire lo strumento IDE di propria scelta.
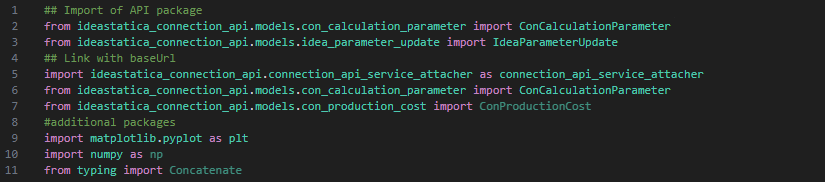
- Creare un nuovo file e importare i pacchetti che consentiranno l'uso del calcolo e il collegamento con l'URL localhost.
Codice sorgente:
## Import of API package
from ideastatica_connection_api.models.con_calculation_parameter import ConCalculationParameter
## Link with baseUrl
import ideastatica_connection_api.connection_api_service_attacher as connection_api_service_attacher
from ideastatica_connection_api.models.con_calculation_parameter import ConCalculationParameterfrom ideastatica_connection_api.models.con_production_cost import ConProductionCost
#additional packages
import matplotlib.pyplot as plt
import numpy as np
from typing import Concatenate
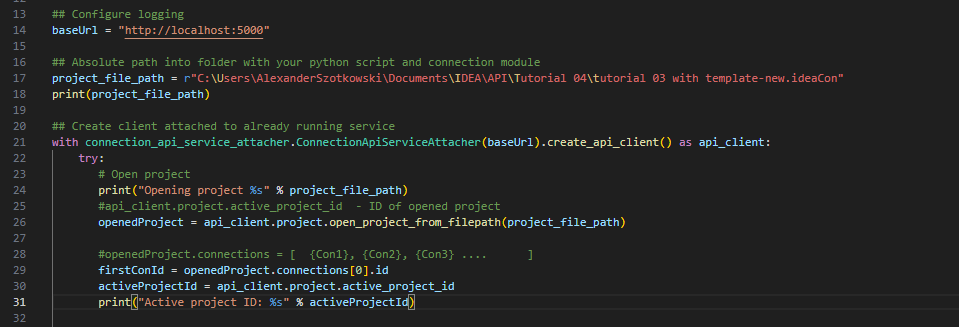
- Configurare il logging tramite la variabile "baseUrl," che richiamerà il localhost. Nel secondo passaggio, associare il percorso assoluto del file IDEA StatiCa Connection.
## Configure logging
baseUrl = "http://localhost:5000"
## Absolute path into folder with your python script and connection module
project_file_path = r"C:\Users\AlexanderSzotkowski\Documents\IDEA\API\Tutorial 04\tutorial 03 with template -new.ideaCon"
print(project_file_path)
- Associare il client a un servizio già in esecuzione. Utilizzare il blocco try/except - poiché il blocco try genera un errore, verrà eseguito il blocco except. Nella prima fase, è necessario aprire il progetto e trovare l'ID progetto, univoco per ogni progetto IDEA StatiCa. Quindi si seleziona il primo collegamento memorizzato nel file.
# Create a client attached to an already running service
with connection_api_service_attacher.ConnectionApiServiceAttacher(baseUrl).create_api_client() as api_client:
try:
# Open project
print("Opening project %s" % project_file_path)
#api_client.project.active_project_id - ID of opened project
openedProject = api_client.project.open_project_from_filepath(project_file_path)
#openedProject.connections = [ {Con1}, {Con2}, {Con3} .... ]
firstConId = openedProject.connections[0].id
activeProjectId = api_client.project.active_project_id
print("Active project ID: %s" % activeProjectId)
- Recuperare tutti i parametri necessari dal file ideaCon (numero di bulloni, diametro, dimensione della saldatura, gruppo bulloni)
#get parameters from ideaCon file
include_hidden = True
parameters = api_client.parameter.get_parameters(activeProjectId, firstConId, include_hidden=include_hidden)
#get default values from the ideaCon file
#Diameter of the bolt
boltParameter = parameters[3]
#print('bolt ',boltParameter.value)
#Number of bolt rows
rowParameter = parameters[11]
#print('row ',rowParameter.value)
#Weld size
weldParameter = parameters[28]
#print('weld ',weldParameter.value)
#Bolt assembly
boltAssemblyParameter = parameters[29]
#print('bolt assembly ',boltAssemblyParameter.value)
- Si desidera ottenere risultati solo quando il calcolo è positivo al 100% per tutte le parti (piastre, saldature, bulloni), pertanto è necessario impostare Stop at the limit strain su True. I risultati verranno memorizzati in un elenco denominato matrix, che verrà poi utilizzato per visualizzare un grafico.
#setup
updateSettings = api_client.settings.get_settings(api_client.project.active_project_id)
from typing import Dict
updateSettings: Dict [str, object] = {
"calculationCommon/Analysis/AnalysisGeneral/Shared/StopAtLimitStrain@01" : True,
"calculationCommon/Checks/Shared/LimitPlasticStrain@01" : 0.05
}
api_client.settings.update_settings(api_client.project.active_project_id, updateSettings)
#Final results database
matrix = []

- Ora si avvia un ciclo modificando le saldature (da t = 8 a 5 mm), il diametro dei bulloni (da M16 a M12) e il numero di file (da 3 a 1). I valori 8, M16 e 3 sono ricavati dal file ideaCon. I risultati progressivi vengono visualizzati sullo schermo e aggiunti all'elenco dei risultati.
#cycling through welds with given rows and bolts
for row in range(rowParameter.value,1, -1):
#print ('Number of bolt rows is', row)
for bolt in range(int(1000*boltParameter.value), 12,-2):
for weld in range(int(1000*weldParameter.value), 5,-1):
par_row = IdeaParameterUpdate() # Create a new instance
par_row.key = rowParameter.key
par_row.expression = str(row)
par_bolt = IdeaParameterUpdate() # Create a new instance
par_bolt.key = boltParameter.key
par_bolt.expression = str(bolt/1000) # Decrement the expression
par_boltAssembly = IdeaParameterUpdate() # Create a new instance
par_boltAssembly.key = boltAssemblyParameter.key
par_boltAssembly.expression = str('M'+ str(bolt) + ' 8.8')
par_weld = IdeaParameterUpdate() # Create a new instance
par_weld.key = weldParameter.key
par_weld.expression = str(weld/1000) # Decrement the expression
updateResponse = api_client.parameter.update(activeProjectId, firstConId, [par_row, par_bolt, par_boltAssembly, par_weld] )
updateResponse.set_to_model
# Check if the parameters were updated successfully
if updateResponse.set_to_model == False:
print('Parameters failed: %s' % ', '.join(updateResponse.failed_validations))
#set the type of analysis
ConCalculationParameter.analysis_type = "stress_strain"
conParameter = ConCalculationParameter()
conParameter.connection_ids = [ firstConId ]
summary = api_client.calculation.calculate(activeProjectId, conParameter.connection_ids)
# Get results after calculation, store it in separate file and print the actual results
results = api_client.calculation.get_results(activeProjectId, conParameter.connection_ids)
CheckResSummary = results[0].check_res_summary
costs = api_client.connection.get_production_cost(api_client.project.active_project_id, firstConId)
api_client.project.download_project(activeProjectId, r'C:\Users\AlexanderSzotkowski\Documents\IDEA\API\Tutorial 04\tutorial 03 with template-updated.ideaCon')
if CheckResSummary[0].check_status == False:
break
if CheckResSummary[0].check_status == True:
print (row,'rows of', bolt, 'bolts', 'and weld size ',par_weld.expression,' results are OK. Costs: ', costs.total_estimated_cost)
values= [row, bolt,par_weld.expression,costs.total_estimated_cost]
#print(values)
matrix.append(values)
else:
print ('Iteration %i failed' % weld)
else:
print ('Iteration %i for weld failed' % weld)
else:
print ('Iteration %i for bolts failed' % bolt)
else:
print ('Iteration %i for rows failed' % row)

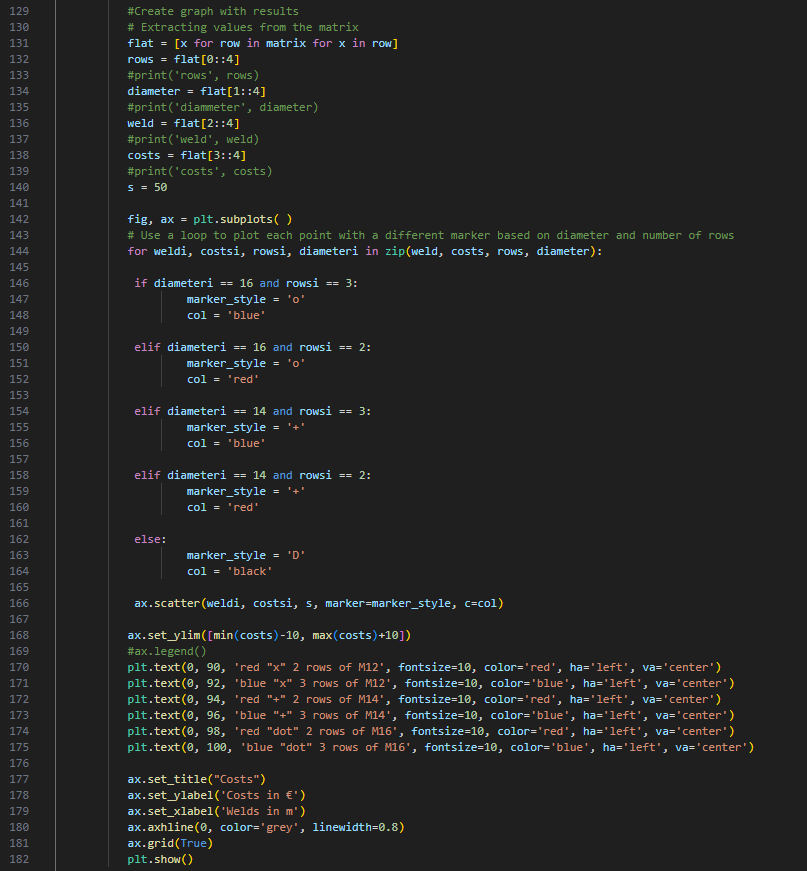
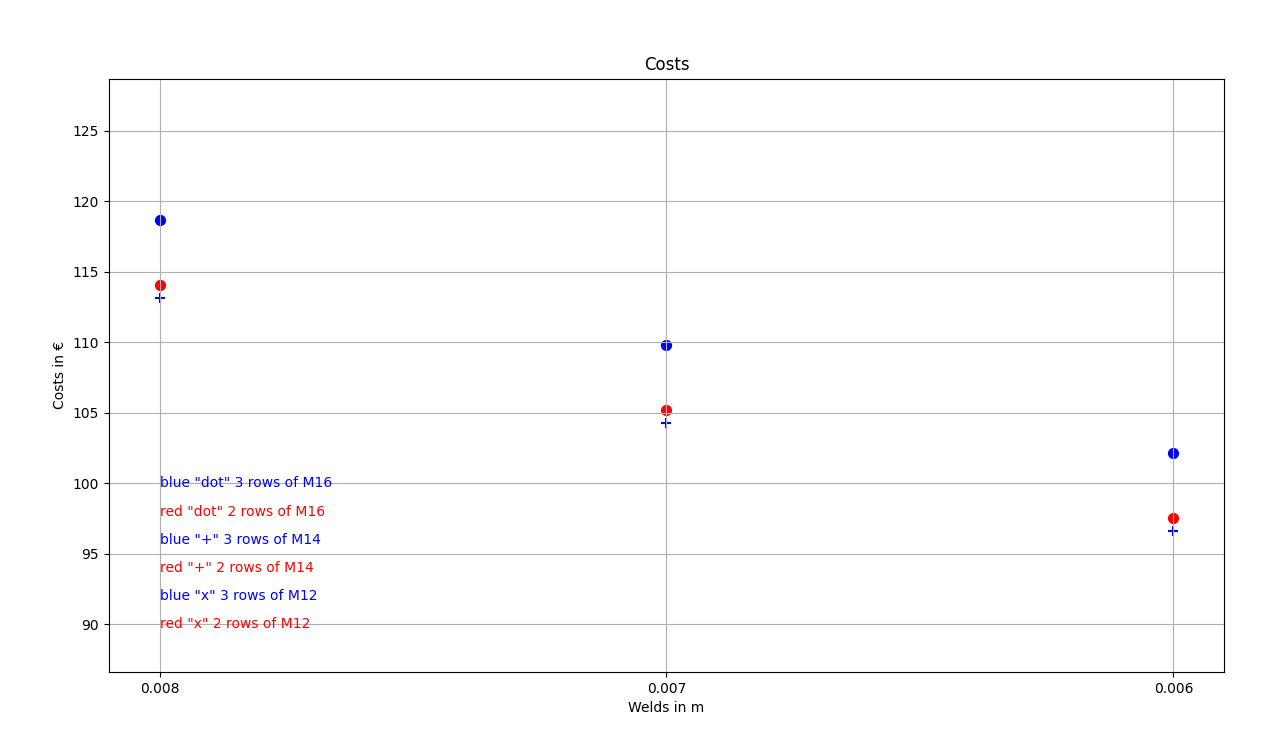
- L'ultima parte riguarda la creazione di un grafico con i risultati ottenuti.
#Create graph with results
# Extracting values from the matrix
flat = [x for row in matrix for x in row]
rows = flat[0::4]
#print('rows', rows)
diameter = flat[1::4]
#print('diammeter', diameter)
weld = flat[2::4]
#print('weld', weld)
costs = flat[3::4]
#print('costs', costs)
s = 50
fig, ax = plt.subplots( )
# Use a loop to plot each point with a different marker based on diameter and number of rows
for weldi, costsi, rowsi, diameteri in zip(weld, costs, rows, diameter):
if diameteri == 16 and rowsi == 3:
marker_style = 'o'
col = 'blue'
elif diameteri == 16 and rowsi == 2:
marker_style = 'o'
col = 'red'
elif diameteri == 14 and rowsi == 3:
marker_style = '+'
col = 'blue'
elif diameteri == 14 and rowsi == 2:
marker_style = '+'
col = 'red'
else:
marker_style = 'D'
col = 'black'
ax.scatter(weldi, costsi, s, marker=marker_style, c=col)
ax.set_ylim([min(costs)-10, max(costs)+10])
#ax.legend()
plt.text(0, 90, 'red "x" 2 rows of M12', fontsize=10, color='red', ha='left', va='center')
plt.text(0, 92, 'blue "x" 3 rows of M12', fontsize=10, color='blue', ha='left', va='center')
plt.text(0, 94, 'red "+" 2 rows of M14', fontsize=10, color='red', ha='left', va='center')
plt.text(0, 96, 'blue "+" 3 rows of M14', fontsize=10, color='blue', ha='left', va='center')
plt.text(0, 98, 'red "dot" 2 rows of M16', fontsize=10, color='red', ha='left', va='center')
plt.text(0, 100, 'blue "dot" 3 rows of M16', fontsize=10, color='blue', ha='left', va='center')
ax.set_title("Costs")
ax.set_ylabel('Costs in €')
ax.set_xlabel('Welds in m')
ax.axhline(0, color='grey', linewidth=0.8)
ax.grid(True)
plt.show()
Come si può osservare, in questo caso specifico, il giunto più economico è quello con una saldatura da 6 mm e tre file di bulloni M14.
Download allegati
- tutorial 04 - 3 optimize bolts and welds.py (PY, 9 kB)
- tutorial 03 with template-new.ideaCon (IDEACON, 59 kB)