
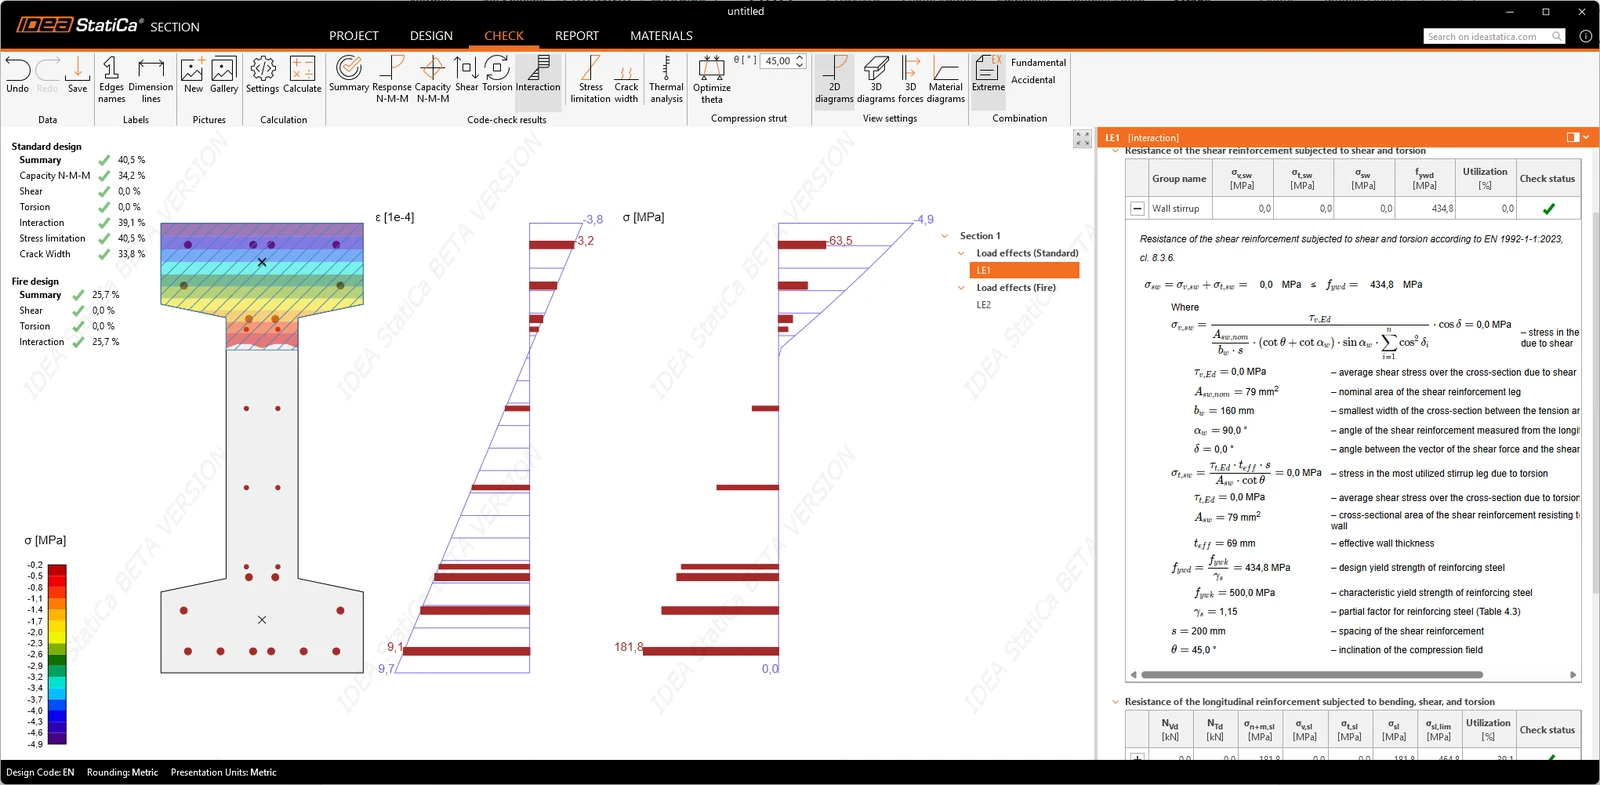


Calculations are based on finite element methods, with configurable element size for each cross-section. This provides a modern computational core rather than a simple spreadsheet-style implementation, supporting accurate, flexible, and high-resolution numerical analysis.
Result organization and presentation for ULS and SLS
Results are structured in a tree containing both sections and individual load extremes. Selecting an extreme displays the corresponding scene and data, while selecting a section shows the governing (worst-case) result from all associated extremes.
The application provides multiple result presentation modes, including scene-based graphical output, tables, and explicit equations. Calculations are not hidden behind summary numbers; every code check is presented as a full equation, showing the formula, input values, intermediate quantities, and relevant code references. This ensures full traceability and allows verification of the calculations directly from the displayed data.
A print preview function is available, displaying the section and all formulas in a pop-up window while maintaining the same transparency as the interactive interface. The values shown in tables correspond exactly to those used in the governing code equations, enabling manual verification and improving clarity for advanced users, support teams, and internal review processes.
Reports are integrated into the project and can include graphical results, tables, detailed equations, and code references. Ultimate and serviceability limit state results are documented side by side in the same document, so the complete design of the section is contained in a single output.
Ultimate Limit State
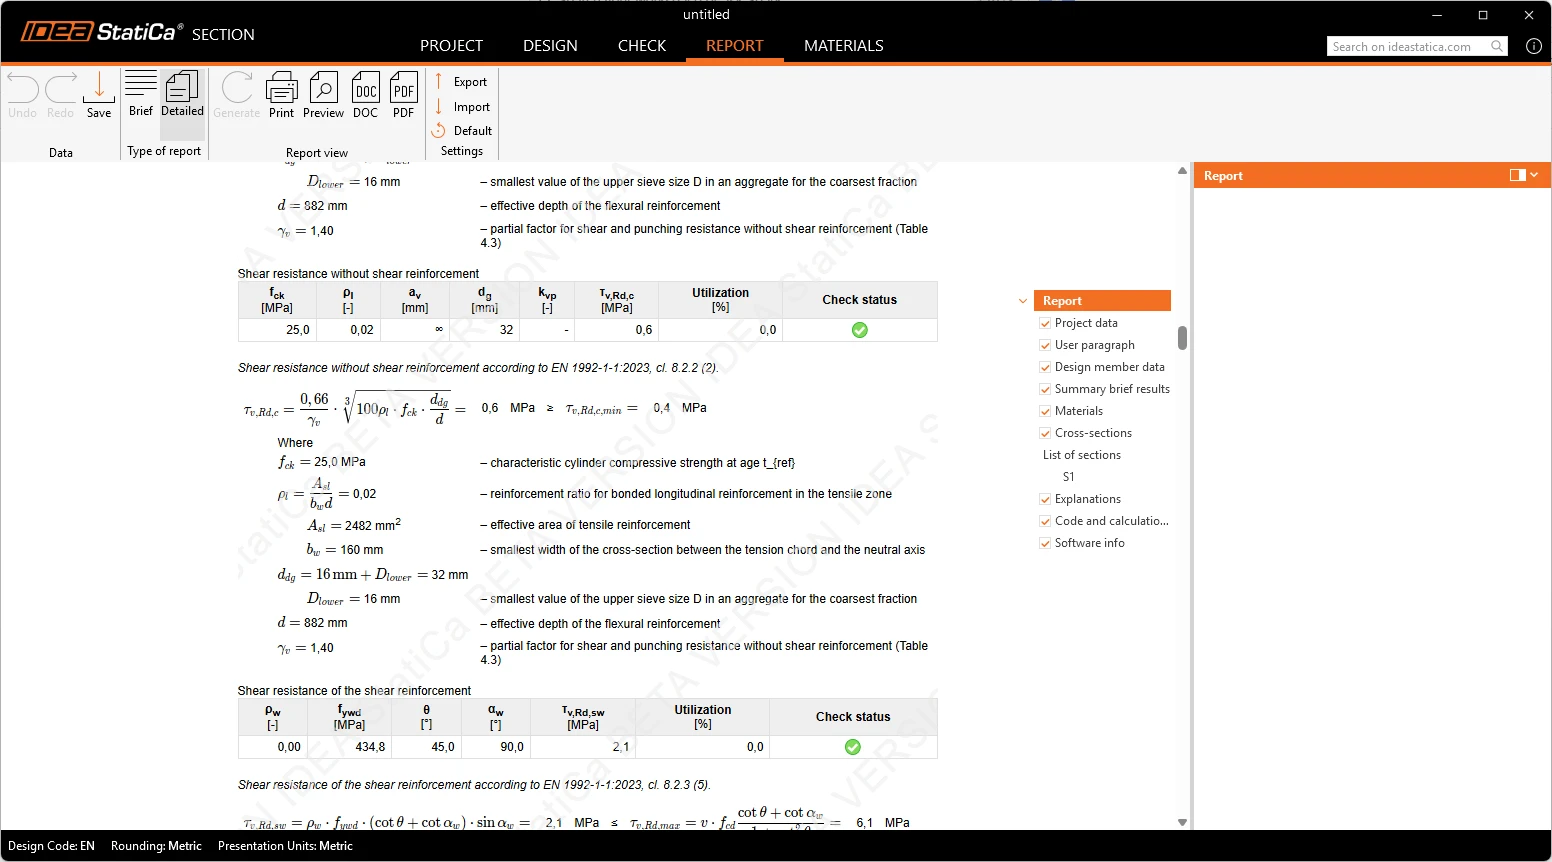
N-My-Mz Response
N-My-Mz Response results show utilization for all components for a given combination, plane of strain, and forces in the cross-section components (concrete and reinforcement in tension and compression), with detailed checks of concrete and reinforcement and details of load effects. In the detail check, the full equation, formula, input values, intermediate quantities, and relevant code references can be easily found and reviewed.
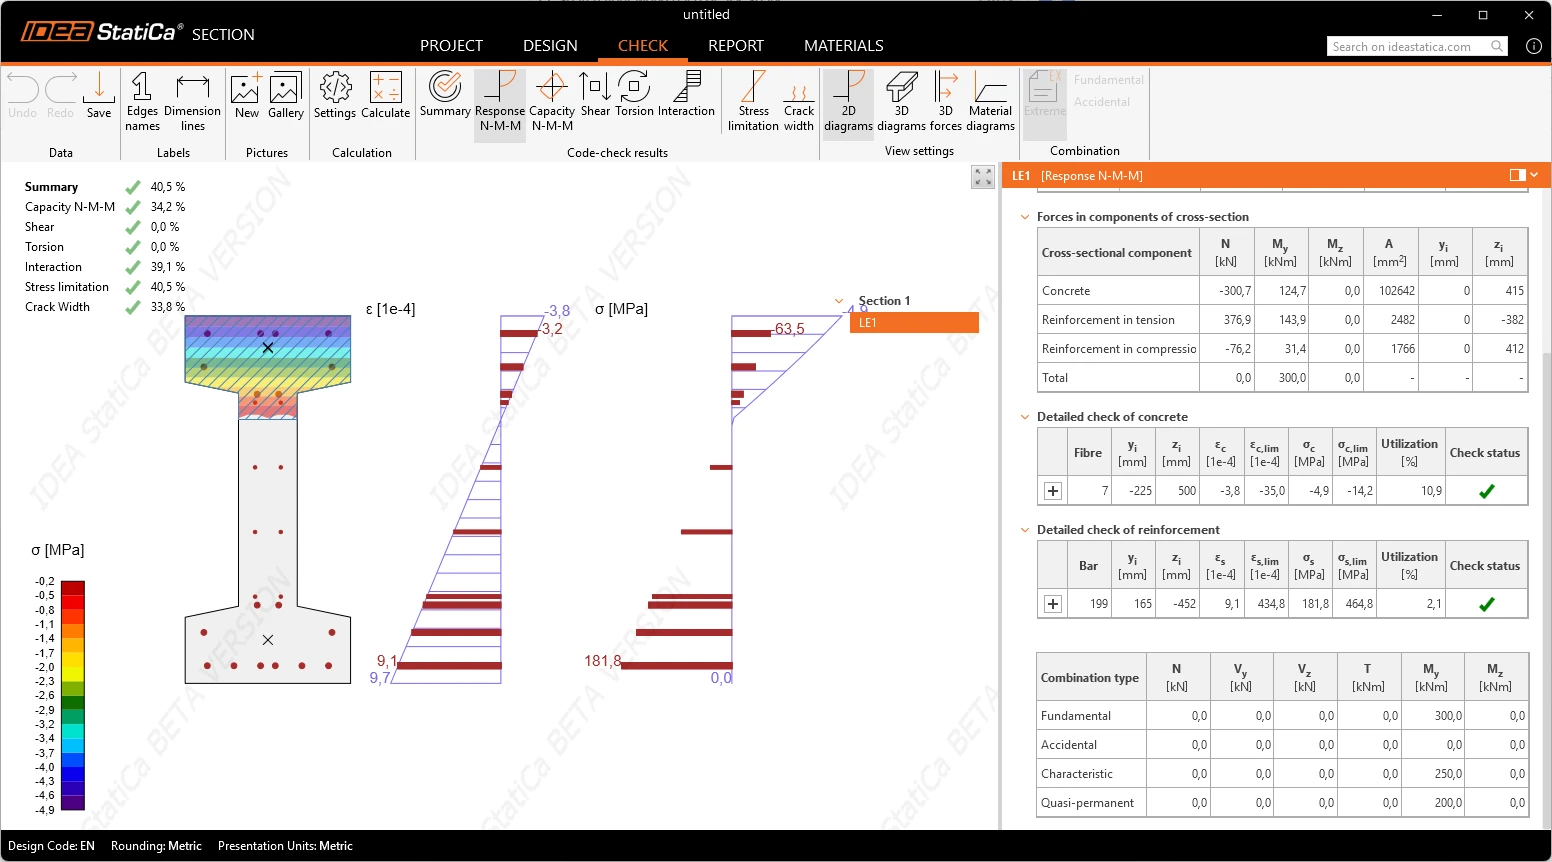
N-My-Mz Capacity
N-My-Mz Capacity results show the section's resistance for the selected combination, the design resistance for the extreme combination, the design resistance for all load effects, and details of the load effect.
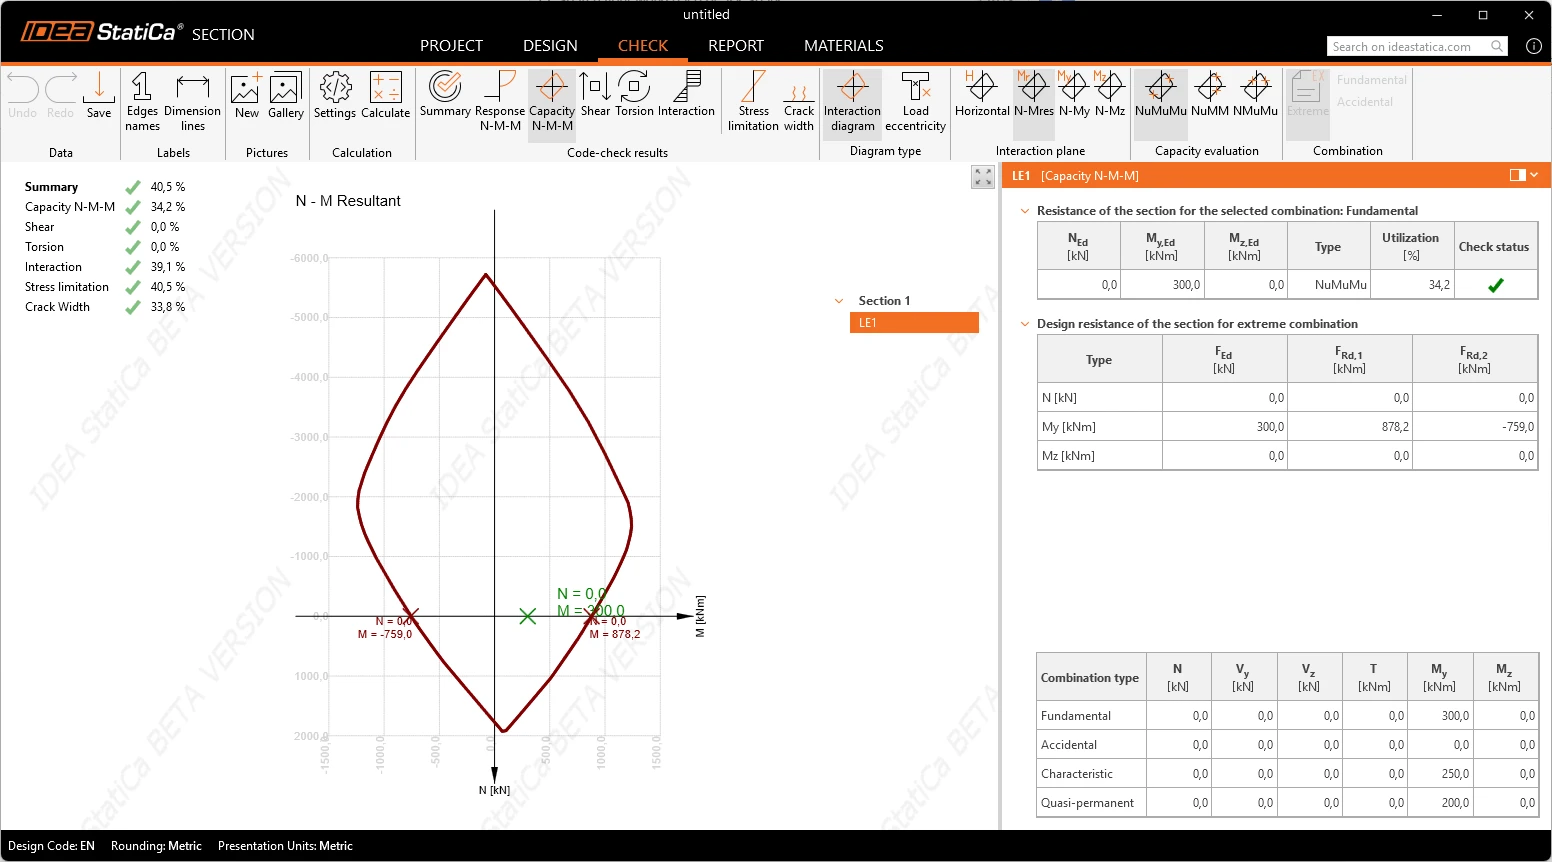
Shear
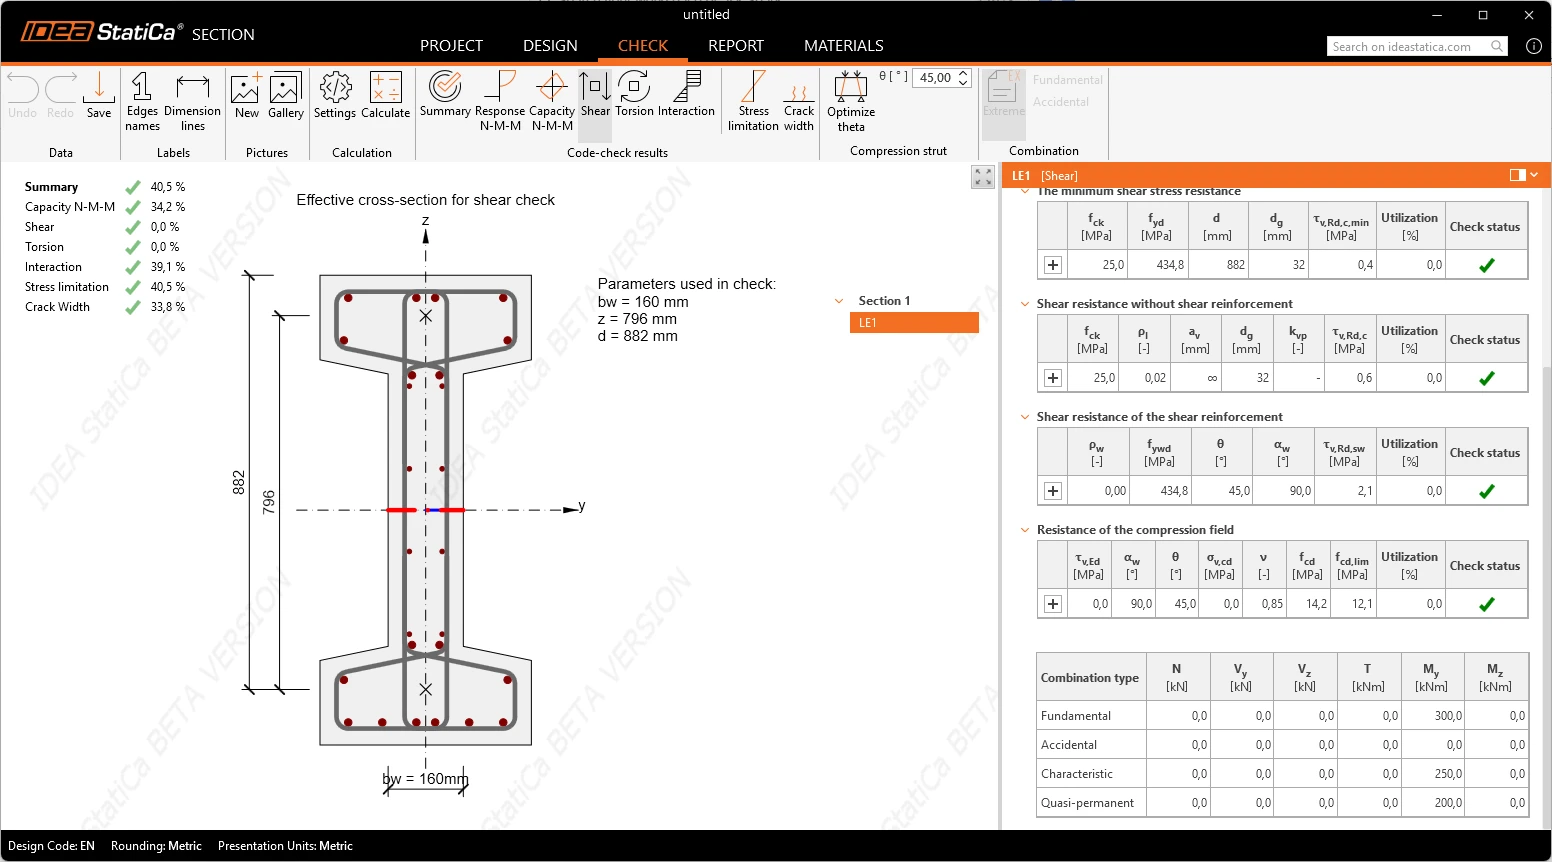
Shear results show shear resistance of the section, average shear stress over the cross section, minimum shear stress resistance, shear resistance without shear reinforcement, shear resistance of the shear reinforcement, resistance of the compression field and details of load effect. In the detail check, the full equation, formula, input values, intermediate quantities, and relevant code references can be easily found and overviewed.
Torsion
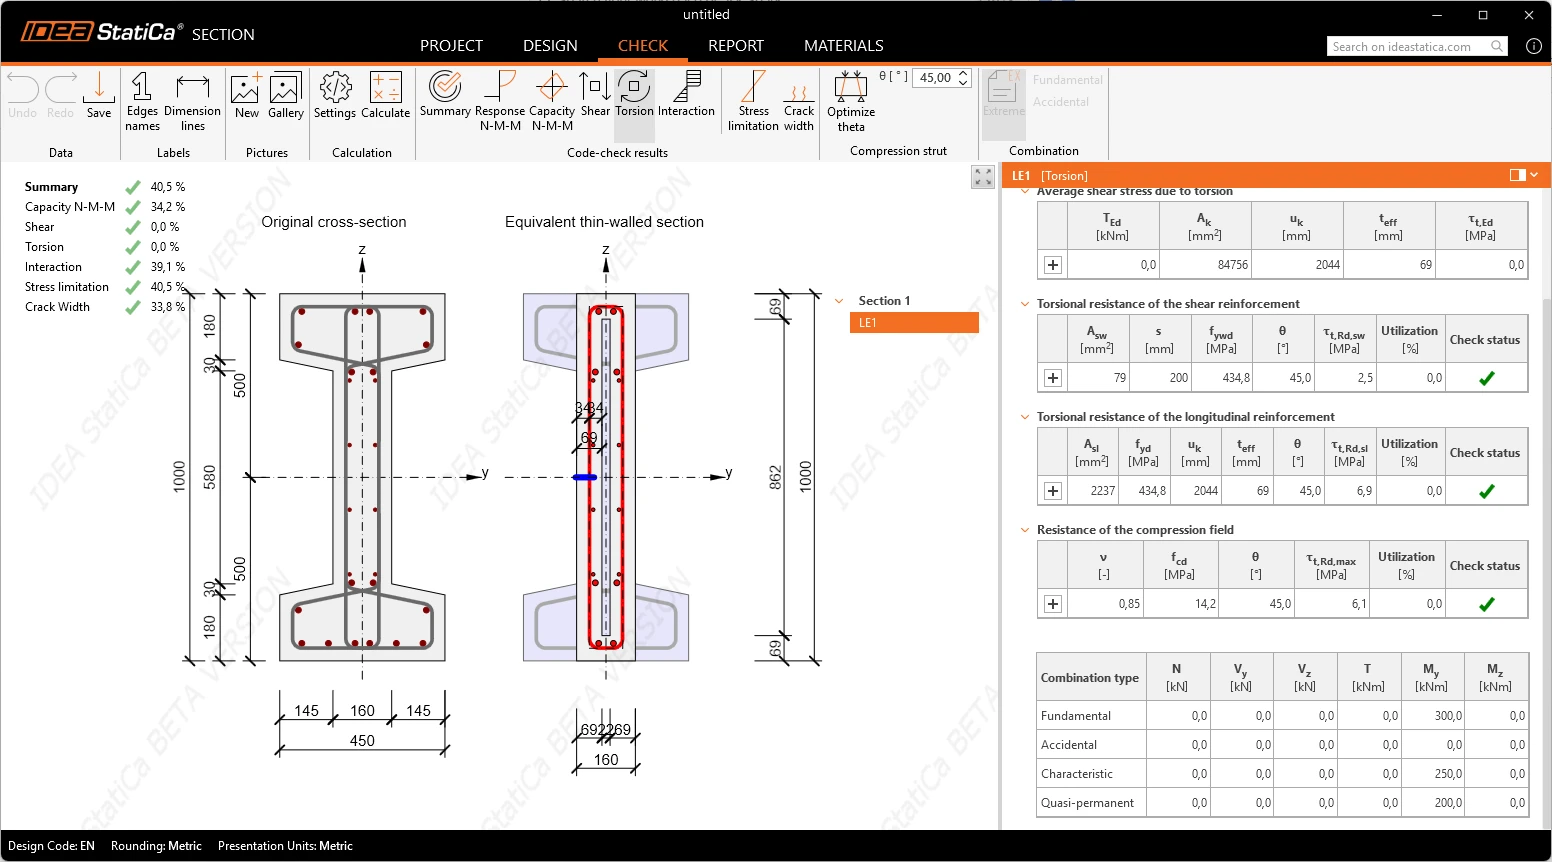
Torsion results show torsional resistance of the section, average shear stress due to torsion, torsional resistance of the shear reinforcement, resistance of the compression field and details of load effect. In the detail check, the full equation, formula, input values, intermediate quantities, and relevant code references can be easily found and overviewed.
Interaction
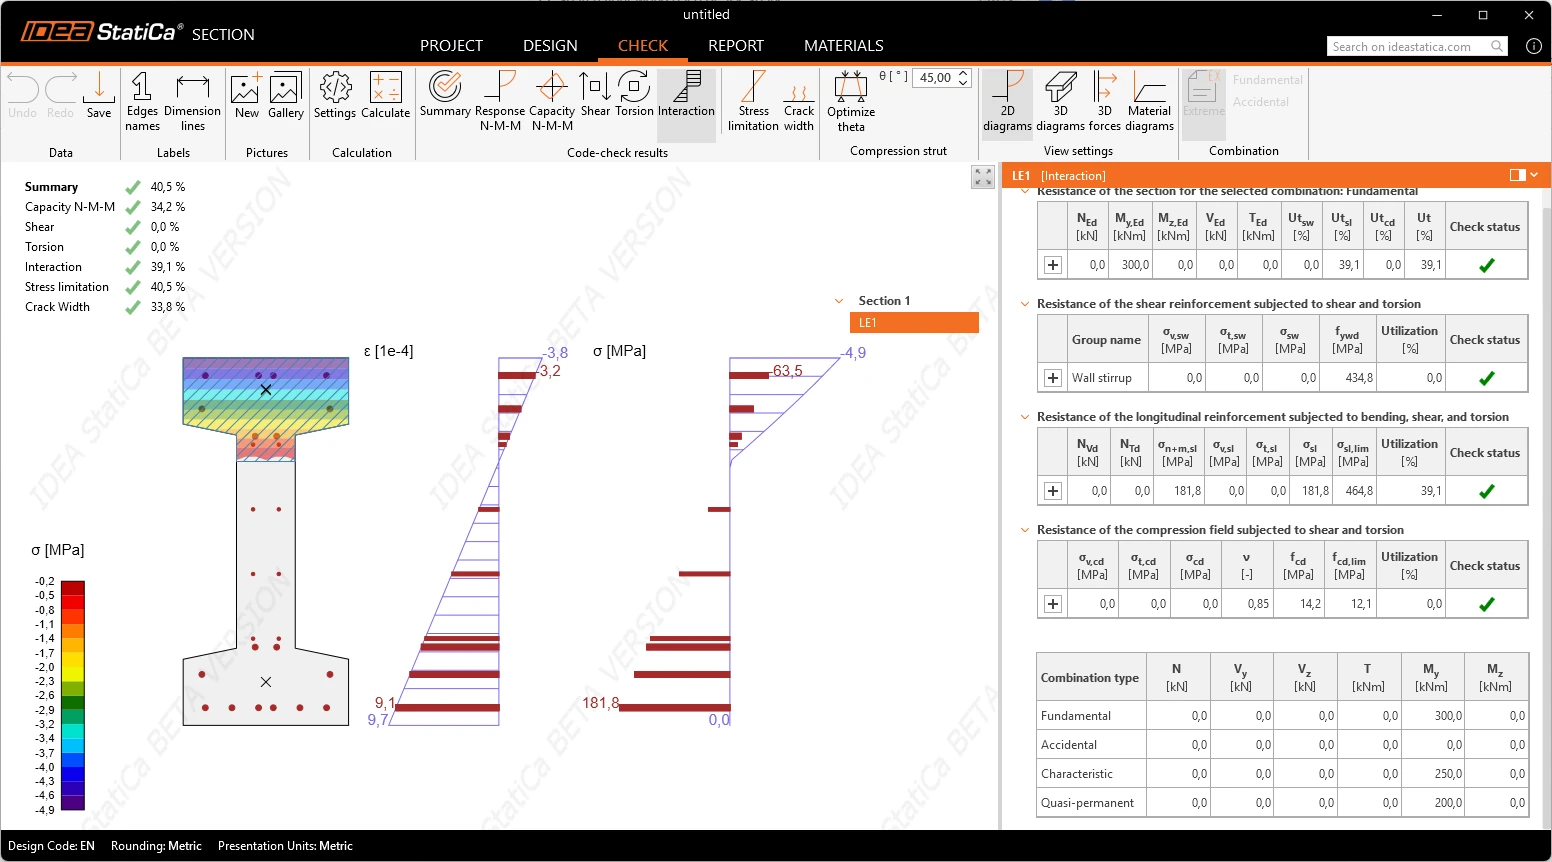
Interaction results show resistance of the section, resistance of the shear reinforcement subjected to shear and torsion, resistance of the longitudinal reinforcement subjected to bending, shear and torsion, resistance of the compression field subjected to shear and torsion and details of the load effect. In the detail check, the full equation, formula, input values, intermediate quantities, and relevant code references can be easily found and overviewed.
Serviceability Limit State
Stress limitation
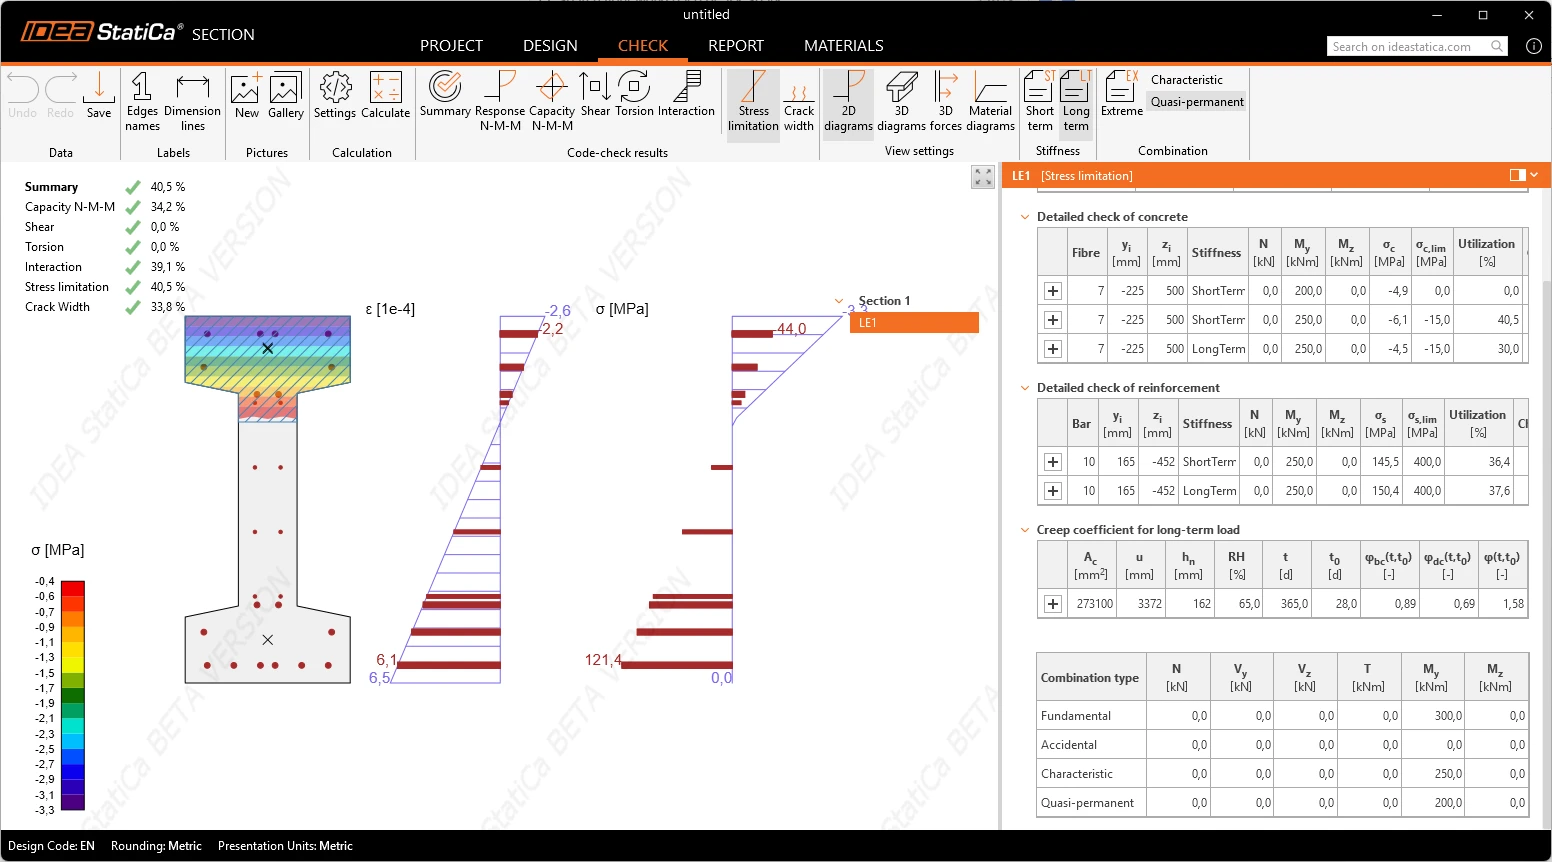
The limit stress in concrete and in reinforcement is checked for the characteristic and the quasi-permanent load combination, per Chapter 9.
The quasi-permanent combination is analysed with a concrete material diagram that carries the effect of creep directly: creep is constant while the compressive stress stays below the code threshold and is treated non-linearly above it, per Annex B. Therefore, there is no need to determine an effective creep factor or rely on workarounds and manual calculations.
The cracked or uncracked state of the concrete is evaluated by the check, not declared beforehand. Once the tensile stress has been exceeded, the section is treated as cracked from then on, evaluated per extreme, per section and per combination.
Crack width
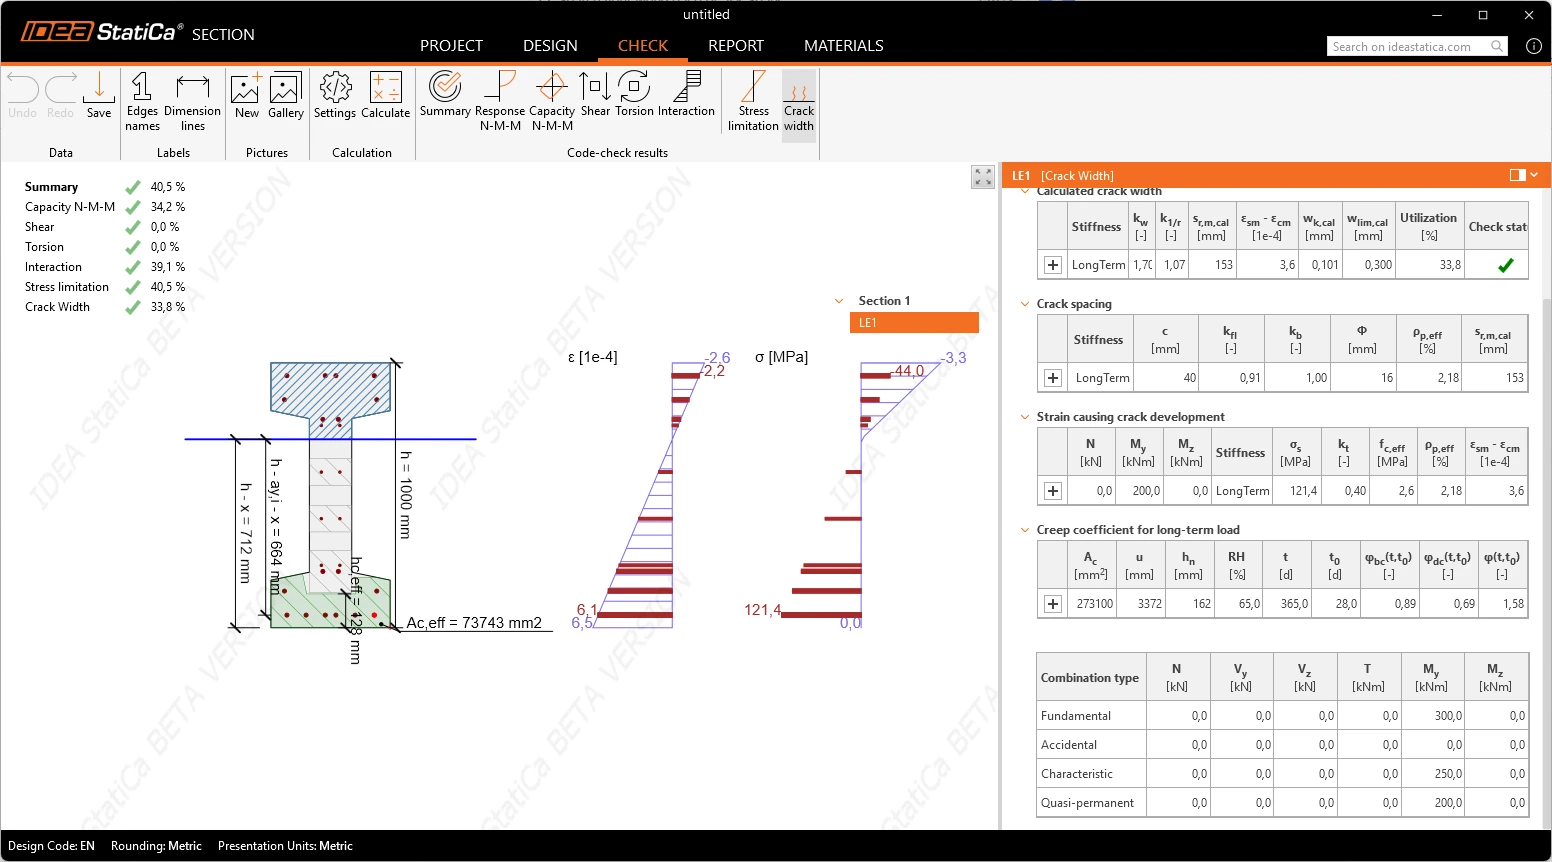
The calculated crack width is verified against its limit on the cracked section. The effective tension area of the concrete is determined by the application, by the algorithm the code prescribes (Figure 9.3). The application resolves geometry for the actual cross-section shape and the actual reinforcement layout, and re-resolves automatically when either changes.
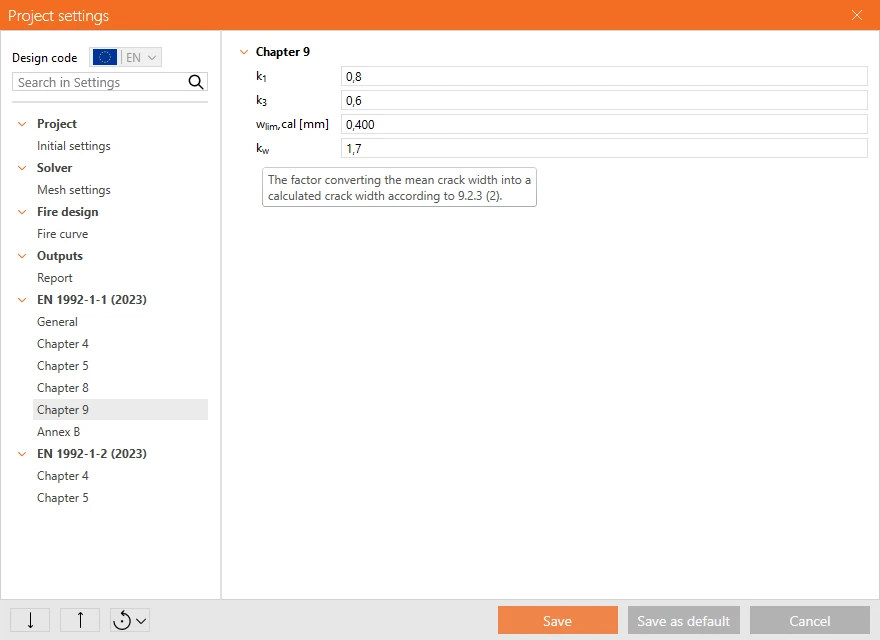
The coefficients that set the serviceability limits are available in the project settings with their code default values. Each coefficient carries a tooltip naming the provision it comes from. All references are to EN 1992-1-1:2023.
For the serviceability checks, the scene shows the stress distribution evaluated with the material model of the check and the effective tension area on the section. The tables in the Check tab give the utilisation against each limit, and every factor, including the creep coefficient, can be expanded down to the individual quantities that entered its calculation.
When comparing with RCS app results – crack width results are not comparable with a check performed according to the EN 1992-1-1:2004. The crack width provisions changed substantially between the two editions, so the difference between the two results comes from the code itself and not from the implementation.
Released in IDEA StatiCa version 26.1.
Take the latest version of IDEA StatiCa for a test drive today
Get 14 days of full access, completely free.
Check out IDEA StatiCa for free