Methoden voor doorsnedecapaciteitscontrole
Twee bekende methoden kunnen worden gebruikt om de uiterste grenstoestand te controleren voor 1D betonnen staven. De eerste geeft ons de doorsnede-uiterste sterkte in de vorm van een interactieoppervlak of een interactiediagram (in het geval van buigmoment in één richting). De doorsnedecapaciteit kan worden bepaald als de verhouding van de werkende inwendige krachten tot de grensstoestandkrachten. De tweede methode is het vinden van evenwicht in een doorsnede, waarbij we kijken naar het werkelijke gedrag van de belaste doorsnede, het gebruik van materialen in termen van spanningen, en inzicht in de kwetsbaarheden van de doorsnede.
Algemene ontwerpveronderstellingen en rekenveronderstellingen voor de Uiterste Grenstoestand
- De rek ε in de wapening en het beton wordt verondersteld rechtstreeks evenredig te zijn met de afstand tot de neutrale lijn (vlakke doorsneden blijven vlak).
- De interactie van de wapening en het beton wordt gewaarborgd door de interactie van beton en wapening zonder glijding (rek ε in de wapening en de aangrenzende betonvezels zijn gelijk).
- De treksterkte van beton wordt verwaarloosd (alle trekspanningen worden overgedragen door de wapening).
- Betondrukspanningen in de drukzone worden berekend op basis van de rek uit spanning-rek diagrammen.
- Wapeningsspanningen worden berekend op basis van de rek uit spanning-rek diagrammen.
- Betondrukrek met een uiterste rekgrens εcu2 (Paraboolvormig-rechthoekig diagram voor beton onder druk) en εcu3 (Bilineaire spanning-rek relatie), [2].
- De drukrek van de wapening is zonder begrenzing in het geval van een horizontale plastische boventak; in het geval van een hellende plastische boventak is de rek begrensd tot εud,[2].
- Een grenstoestand wordt bereikt wanneer de toestand van ten minste één van de materialen de uiterste grensrek overschrijdt (als εu niet begrensd is, is het gedrukte beton maatgevend).
\[ \textsf{\textit{\footnotesize{\qquad Strain stress.}}}\]
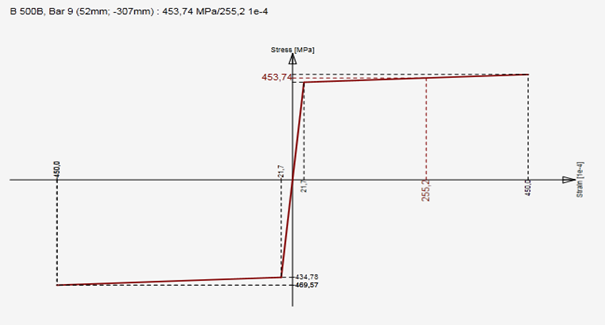
\[ \textsf{\textit{\footnotesize{\qquad Stress-strain design diagram for reinforcing steel with inclined top branch.}}}\]
Interactiediagram
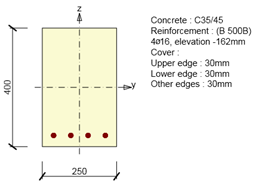
De eerste optie is het controleren van de doorsnede met behulp van een interactieoppervlak (of interactiediagram). Een toelichting wordt gegeven aan de hand van een voorbeeld van het interactieoppervlak voor de gewapende vierkante doorsnede uit het voorbeeld in de onderstaande figuur. Op het interactieoppervlak bevinden zich punten die de uiterste grenstoestand van de onderzochte doorsnede definiëren. Het interactieoppervlak wordt opgebouwd uit punten (N, My, Mz), die worden bepaald door spanningsintegratie in de doorsnede, waarbij de uiterste grensrek in één van de materialen is bereikt. Voor een 3D-interactie kan het oppervlak worden afgeleid uit een 2D-interactiediagram, dat een gesloten curve is, die overeenkomt met de spanning bij een continu gedraaide neutrale lijn.
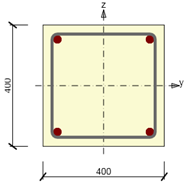
\[ \textsf{\textit{\footnotesize{\qquad Symmetrical reinforced cross-section.}}}\]
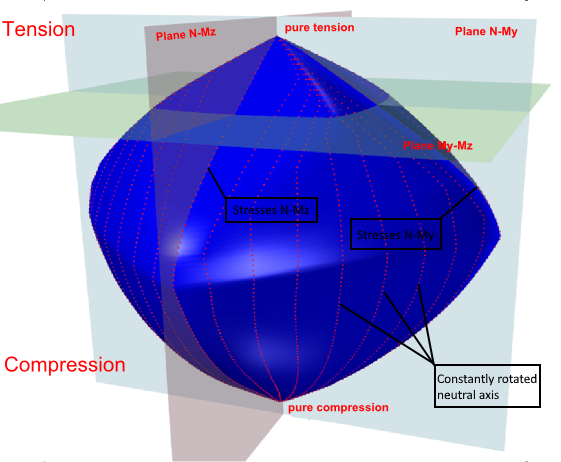
\[ \textsf{\textit{\footnotesize{\qquad Interaction surface shows failure conditions for all load cases of normal force and bending moments.}}}\]
Voor het geval van een doorsnede die symmetrisch is ten opzichte van de y-as, is het interactiediagram symmetrisch rond het vlak N-My. Op dezelfde wijze is voor het geval van een doorsnede die symmetrisch is ten opzichte van de z-as, het interactiediagram symmetrisch rond het vlak N-Mz. De eenzijdig gewapende doorsnede introduceert een afgeplatte vorm van het interactiediagram.
\[ \textsf{\textit{\footnotesize{\qquad Single symmetrical reinforced cross-section.}}}\]
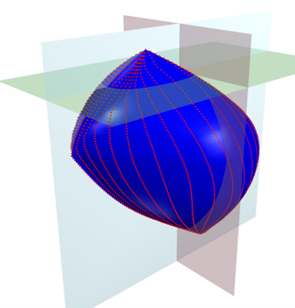
\[ \textsf{\textit{\footnotesize{\qquad Interaction surface for cross-section with single symmetric reinforcement.}}}\]
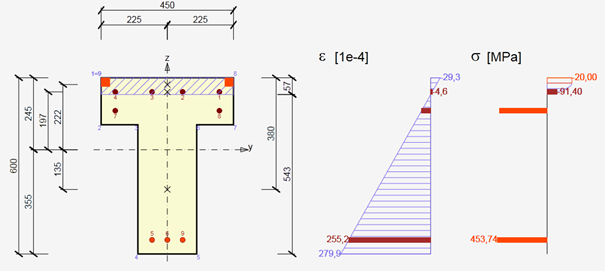
De punten die de uiterste grenstoestand definiëren worden verkregen uit spanningsintegratie. De onderstaande figuur toont de rek bij de uiterste grenstoestand.
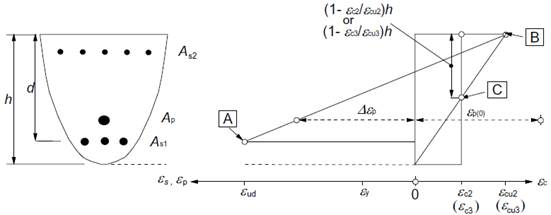
Rekverdelingen bij de uiterste grenstoestand (overgenomen uit [2]).
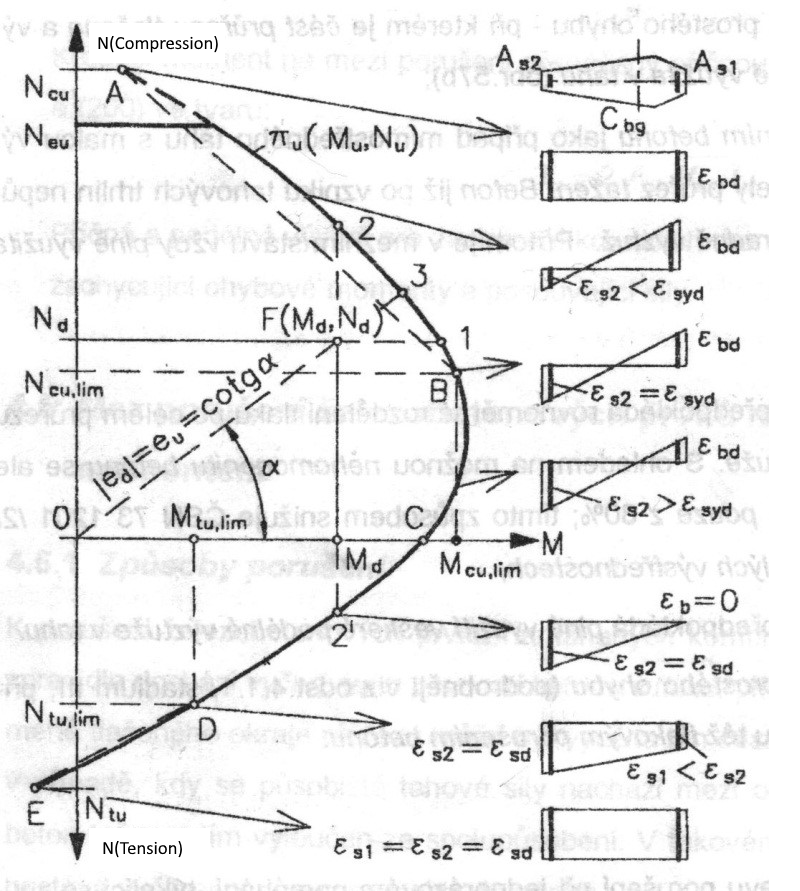
Het interactiediagram toont het bezwijken van de doorsnede onder normaalkracht en buigmomenten. [1]
Met betrekking tot het 2D-diagramprobleem (gesloten curve liggend op het interactieoppervlak) kunnen we vaststellen dat het rekvlak door de neutrale lijn en het kritieke punt [y, z, ε] gaat, dat wordt beschouwd als kritiek punt R. Punt [y, z] definieert een punt in de doorsnede met de waarde van rek ε bij de uiterste grenstoestand. De hellingshoek van de neutrale lijn is constant voor alle punten van het 2D-diagram.
Indien de drukspanning in het beton maatgevend is voor het ontwerp, valt punt R samen met de verst verwijderde gedrukte betonvezel of met het begrenzingspunt C. Dit is echter alleen van toepassing als de doorsnede is opgebouwd uit één type beton - niet zoals bij een gemengde doorsnede.
In het geval dat de trekspanning in de wapening maatgevend is voor het ontwerp (rek εud wordt overschreden bij de uiterste grenstoestand voor één of meer staven), moet worden voldaan aan de voorwaarde dat voor het gegeven rekvlak de waarde εud niet wordt overschreden in enige andere staaf.
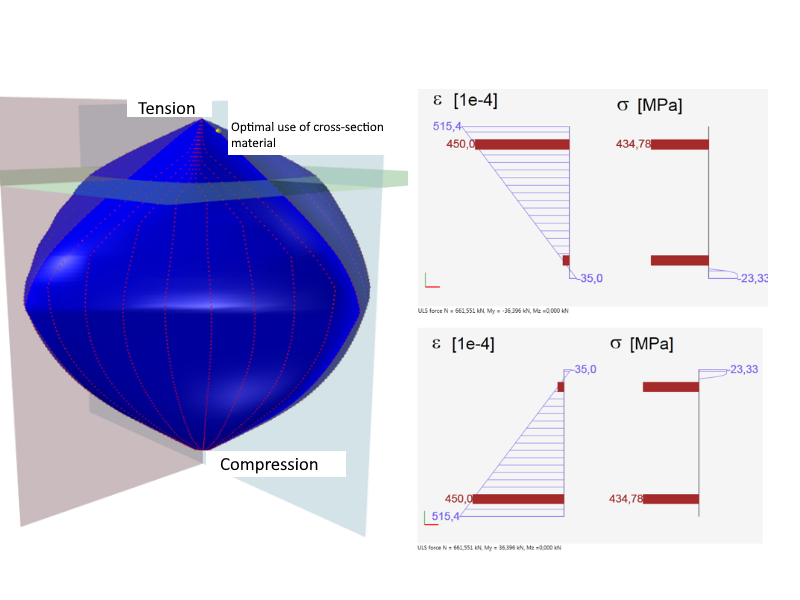
\[ \textsf{\textit{\footnotesize{\qquad Optimal use of cross-section material.}}}\]
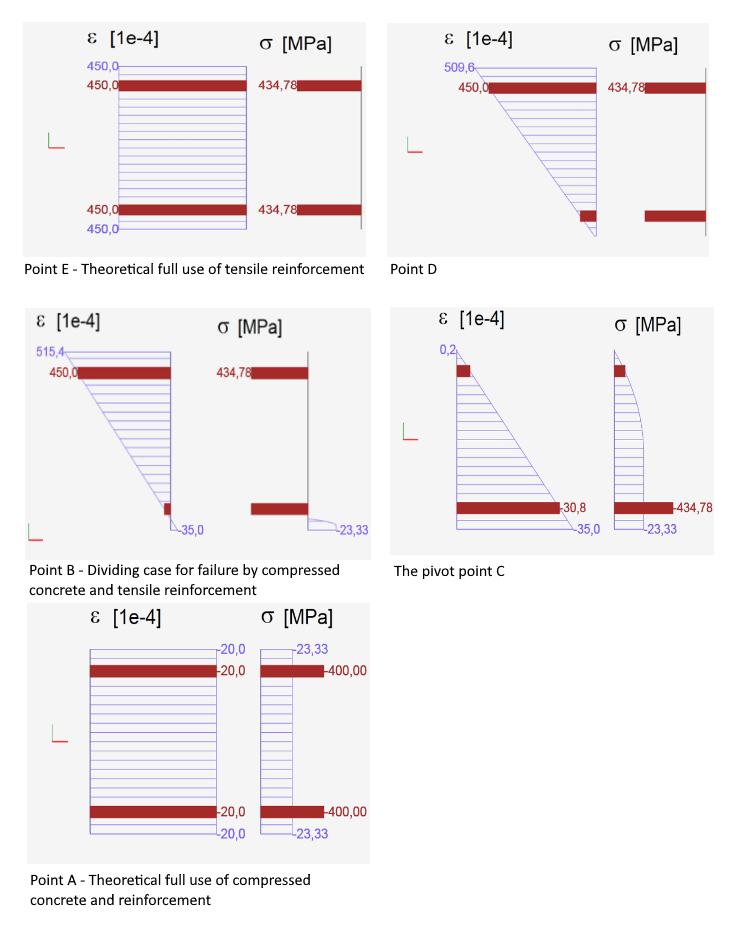
\[ \textsf{\textit{\footnotesize{\qquad Characteristic strain plane positions calculated for purpose of interaction diagram.}}}\]
De bovenstaande figuur toont dat het diagram kan worden onderverdeeld in twee delen: het deel waarbij het bezwijken wordt veroorzaakt door een trek kracht en het deel dat bezwijkt door een druk kracht. De grenstoestandpunten komen overeen met het geval hierboven, waarbij ook de extreme hellingshoek van het rekvlak zichtbaar is. Bij het tekenen van een interactiediagram verandert de vlakke rekhelling van een doorsnede in dit interval, terwijl we zoeken naar het punt R (zie boven). Op basis van dat gedefinieerde vlak voeren we de integratie uit om de spanning bij de uiterste grenstoestand te verkrijgen.
Doorsnede onderworpen aan normaalkracht en buigmoment - controle
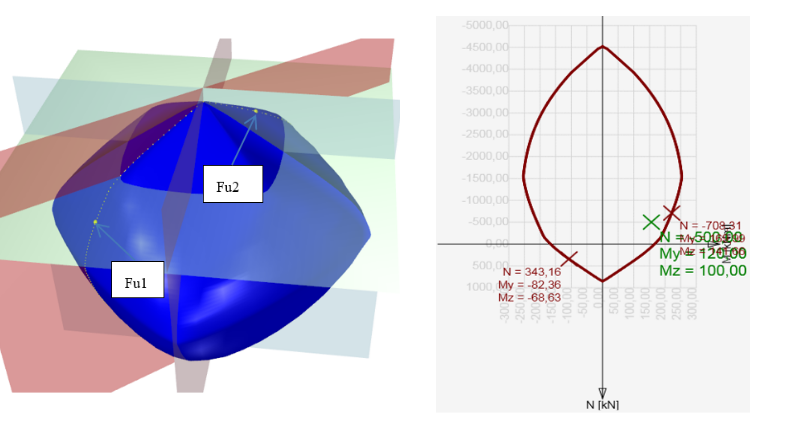
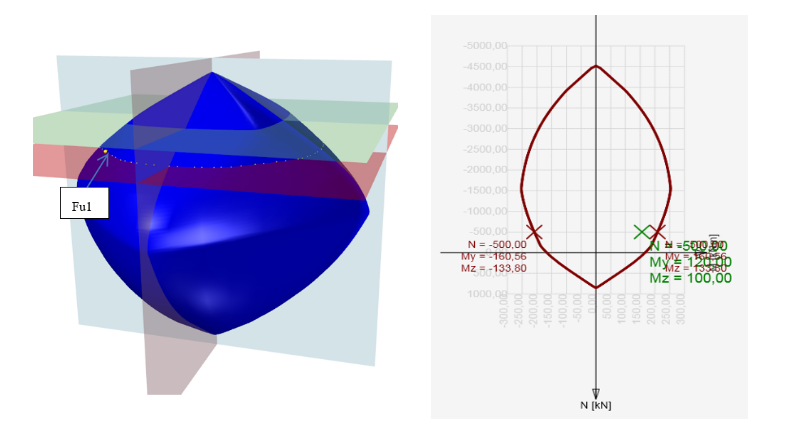
De controle van een doorsnede onderworpen aan normaalkracht en buigmoment berust op het aantonen dat de gecontroleerde spanningen (combinatie Nd, Myd, Mzd) zich binnen of op het interactieoppervlak bevinden. Verschillende methoden kunnen dit uitvoeren. Het volgende voorbeeld demonstreert de controle van een rechthoekige doorsnede onderworpen aan krachten Nd = -500 kN, Myd = 120 kNm, Mzd = 100 kNm.
Methode NuMuMu
Om de weerstand van een doorsnede te bepalen, veronderstellen we proportionele veranderingen in alle componenten van de inwendige krachten (de excentriciteit van de normaalkracht blijft constant) totdat het interactieoppervlak is bereikt. De verandering van de betrokken inwendige krachten kan worden geïnterpreteerd als een beweging langs een lijn die het beginpunt van het coördinatenstelsel (0,0,0) verbindt met het punt gedefinieerd door de inwendige krachten (NEd, MEd,y, MEd,z). De twee snijpunten van deze lijn met het interactieoppervlak, die kunnen worden gevonden, vertegenwoordigen twee sets van krachten bij de uiterste grenstoestand. Bij elk snijpunt bepaalt het programma drie krachten bij de grenstoestand: de rekenwaarde van de normaalkrachtweerstand NRd en de bijbehorende rekenwaarden van de buigmomentweerstand MRdy, MRdz.
Methode NuMM
Om de weerstand van de doorsnede te bepalen, veronderstellen we een constante normaalkracht (gelijk aan de werkende rekenwaarde van de normaalkracht) en proportionele veranderingen in buigmomenten totdat het interactieoppervlak is bereikt. De verandering van de betrokken inwendige krachten kan worden geïnterpreteerd als een beweging in een horizontaal vlak langs de lijn die het punt (NEd,0,0) verbindt met het punt gedefinieerd door de werkende inwendige krachten (NEd, MEd,y, MEd,z). De twee snijpunten van deze lijn met het interactieoppervlak, die kunnen worden gevonden, vertegenwoordigen twee sets van krachten bij de uiterste grenstoestand. Bij elk snijpunt bepaalt het programma drie krachten bij de grenstoestand: de rekenwaarden van de weerstandsmomenten MRdy, MRdz en de (bijbehorende) werkende rekenwaarde van de normaalkracht NEd.
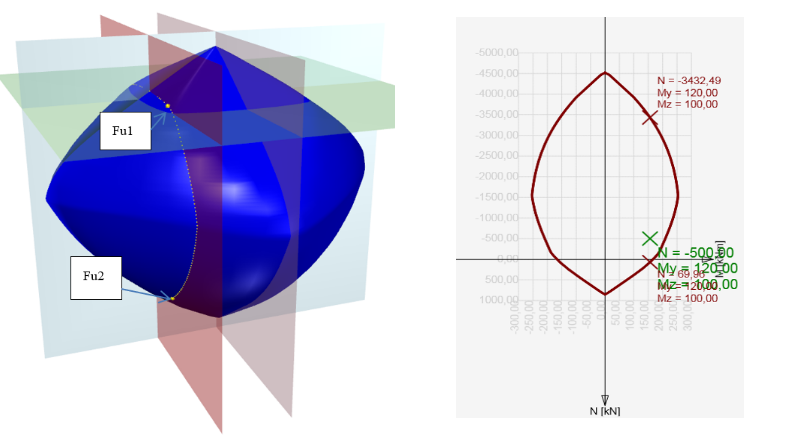
Methode NMuMu
Om de weerstand van de doorsnede te bepalen, veronderstellen we een constante normaalkracht (gelijk aan de werkende rekenwaarde van de normaalkracht) en proportionele veranderingen in buigmomenten totdat het interactieoppervlak is bereikt. De verandering van de betrokken inwendige krachten kan worden geïnterpreteerd als een beweging in een horizontaal vlak langs de lijn die het punt (NEd,0,0) verbindt met het punt gedefinieerd door de werkende inwendige krachten (NEd, MEd,y, MEd,z). De twee snijpunten van deze lijn met het interactieoppervlak, die kunnen worden gevonden, vertegenwoordigen twee sets van krachten bij de uiterste grenstoestand. Bij elk snijpunt bepaalt het programma drie krachten bij de grenstoestand: de rekenwaarden van de weerstandsmomenten MRdy, MRdz, en de (bijbehorende) werkende rekenwaarde van de normaalkracht NEd.
Bepaling van de doorsnederespons
Een andere mogelijkheid om de doorsnede te controleren is het bepalen van de doorsnederespons (d.w.z. rek- en spanningsverdeling op basis van de werkende inwendige krachten). Deze methode is ook bekend als de methode van de grensvervorming. Het niveau van de werkende spanningen in elke vezel (in het geval van vlakke buiging in elke laag) in elke wapeningsstang wordt berekend afhankelijk van de rek uit het spanning-rek diagram van het materiaal.
De bepaling van de doorsnederespons wordt berekend met behulp van de numerieke methode gespecificeerd in [6]. Het principe bestaat uit de geleidelijke belastingstoename van de doorsnede door de onevenwichtige componenten van niet-overgedragen krachten. Deze worden verkregen door integratie van de spanning over de doorsnede met behulp van spanning-rek diagrammen. Als de spanningswaarde kan worden gevonden voor de rek in het spanning-rek diagram, zie figuur hieronder (a), is de berekende spanning correct uitgaande van lineair elastisch materiaal. In gevallen (b) en (c) bereikt de spanning voor een lineaire berekening onrealistische waarden, en een deel (b) of de volledige waarde (c) kan niet worden overgedragen door het materiaal. Door integratie van niet-overgedragen spanningen verkrijgen we niet-overgedragen inwendige krachten, en hun resultanten moeten worden opgeteld bij de inwendige krachten van variabele belastingen.
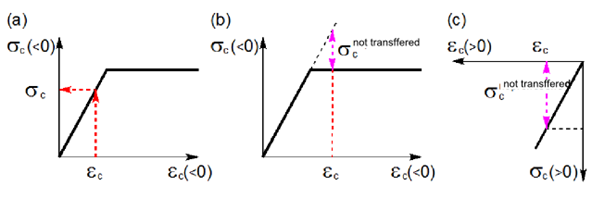
Niet-overgedragen spanningen in spanning-rek diagrammen. [4]
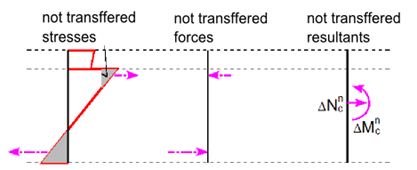
Niet-overgedragen inwendige krachten. [4]
Deze rekenmethode vereist het gebruik van numerieke methoden voor de integratie van de spanning over het doorsnede-oppervlak en voor de niet-lineaire analyse van evenwichtsvergelijkingen in de doorsnede. De iteratie wordt beëindigd op het moment dat aan de convergentiecriteria is voldaan.
\[\frac{{{F_e} - {F_i}}}{{{F_e}}} \le max\left\{ {e,d} \right\}\]
waarbij
Fe is de doorsnedelast,
Fi is de doorsnederespons (inwendige krachten berekend op basis van het rekvlak).
Als a de benaderde (geïnterpoleerde) waarde is en b de exacte (ware) waarde, dan wordt de absolute afwijking gegeven door de volgende vergelijking.
\[e = \left| {b - a} \right|\]
De relatieve afwijking wordt gegeven door de volgende formule:
\[d = \left| {\frac{{b - a}}{b}} \right|\]
In de meeste programma's kunt u deze convergentiecriteria instellen (standaardwaarden zijn 1% als relatieve fout, 100 N, 100 Nm als de absolute fout van normaalkracht en momenten).
Als we de invoer hebben van N = 0 kN, My = 100 kNm, Mz = 0 kNm en geïntegreerde krachten na iteratie N = - 0,07 kN, My = 100,5 kNm, Mz = 0,02 kNm, is de beoordeling als volgt. Met inachtneming van N en Mz gelijk aan 0, kan een vergelijking met absolute afwijking worden gemaakt:
De waarde van de normaalkracht 100N> | 70 | N
De waarde van het buigmoment Mz 100Nm> | 20 | Nm
De waarde van het buigmoment My
\[d = \left| {\frac{{b - a}}{b}} \right| = \frac{{100 - 100,5}}{{100}} = 0,005\; < 0,01\]
Doorsnede controle via de respons
In het geval van het vinden van een evenwicht in de doorsnede is het vlakke rek bekend. Uit het vlakke rek kunnen we de rek berekenen op elke willekeurige plaats in de doorsnede, vervolgens de spanning of inwendige krachten in wapeningsstaven, de doorsnede of delen daarvan met behulp van de spanning-rek diagrammen van de materialen. De berekende spanning- en rekwaarden vergelijken we met de grensrekwaarde uit de spanning-rek diagrammen van de gebruikte materialen.
Het voordeel van deze methode is dat we een volledig beeld krijgen van de spanning- en rekwaarden in de doorsnede van de inwendige krachten die op de doorsnede inwerken.