Verifica unitaria: Ancoraggio
Introduzione
In questo articolo, presentiamo uno studio di verifica unitaria finalizzato alla verifica del CSFM 3D del comportamento di sfilamento degli ancoraggi in calcestruzzo attraverso un confronto diretto con risultati sperimentali[1]. L'obiettivo della nostra indagine consiste nel valutare le capacità predittive dei modelli numerici nel cogliere gli aspetti chiave del comportamento degli ancoraggi, incluse le modalità di rottura e la capacità ultima. Il nostro studio comprende una gamma diversificata di diametri degli ancoraggi, da 10 mm fino a 32 mm, riflettendo la variabilità riscontrata negli scenari ingegneristici pratici. Ciò ci consente di individuare eventuali tendenze dipendenti dal diametro e di valutare la robustezza del CSFM 3D a diverse scale. È opportuno sottolineare che tutte le simulazioni sono condotte nell'ambito del CSFM 3D, un metodo implementato in IDEA StatiCa Detail, utilizzando le impostazioni predefinite per tutti i parametri.
Definizione delle modalità di rottura
Per valutare le prestazioni del CSFM 3D nella modellazione degli ancoraggi post-installati incollati, è necessario considerare due modalità di rottura: sfilamento, in cui la tensione di aderenza (τb) è uguale alla tensione di aderenza di progetto (τbd), e snervamento dell'ancoraggio stesso, ovvero il raggiungimento della deformazione plastica limite.

Configurazione della verifica unitaria
In questo studio, gli ancoraggi Hilti HIT-RE500 - SD Injectable Mortar with Reinforcement (500B) sono stati modellati in IDEA StatiCa Detail e i risultati sono stati confrontati con i dati sperimentali[1].
Le dimensioni dei blocchi in calcestruzzo e la loro armatura sono state attentamente considerate per mitigare qualsiasi potenziale effetto sul comportamento di sfilamento, garantendo così la validità dei risultati sperimentali[1]. Per tutte le verifiche unitarie degli ancoraggi è stata utilizzata una dimensione di blocco in calcestruzzo (1,0x1,0x0,5 m; LxPxH). Il blocco è armato con barre di acciaio B 500B e diametro da 8 a 14 mm. 8 strati di barre attorno a ciascuna superficie (ad eccezione della superficie inferiore, le barre sono modellate come continue attraverso il supporto inferiore) con distanza tra gli strati di 135,0 mm. Tutti i coefficienti di sicurezza prescritti dalle normative di riferimento sono stati rigorosamente rispettati, con un valore pari a 1,0 impiegato in tutti i calcoli. La dimensione del foro dell'ancoraggio rispetto al diametro dell'ancoraggio stesso non è stata esplicitamente considerata nel modello di calcolo.
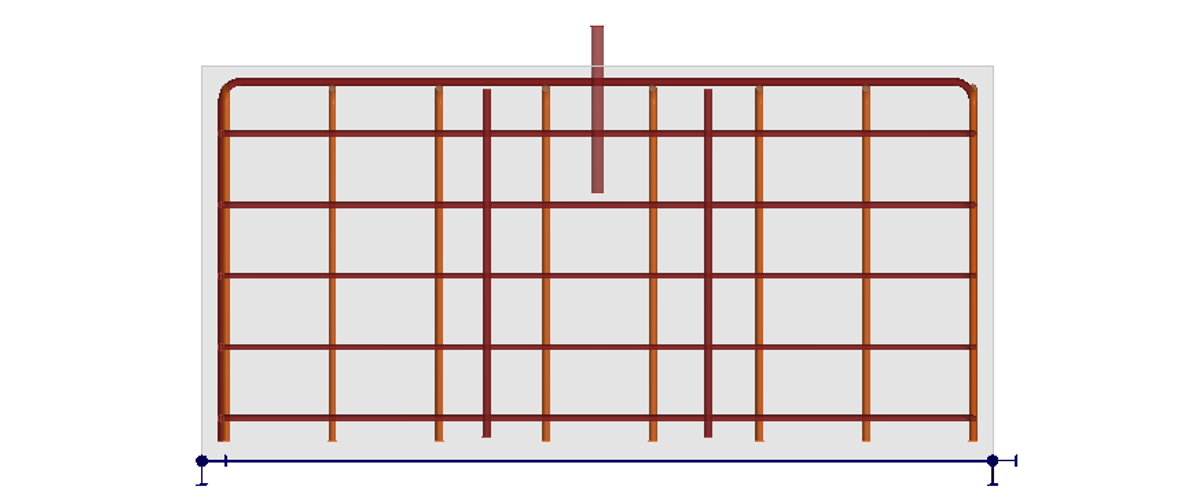
\[ \textsf{\textit{\footnotesize{Fig. 1.1 Side view of a reinforced concrete block with glued in anchor}}}\]
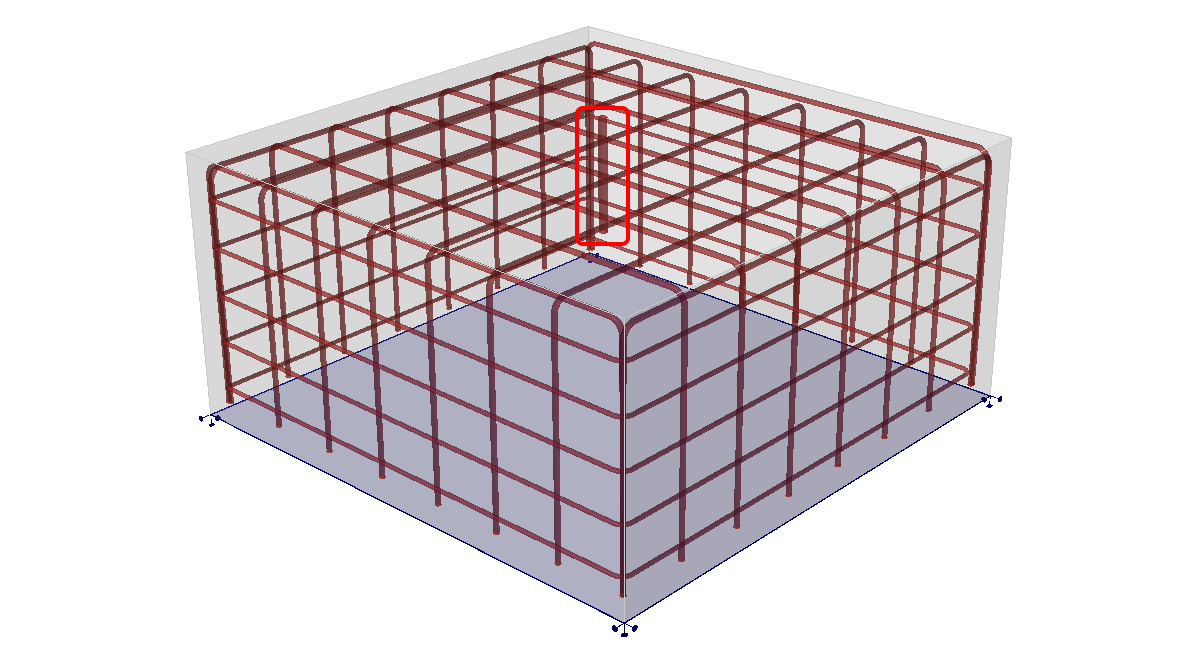
\[ \textsf{\textit{\footnotesize{Fig. 1.2 View of a reinforced concrete block with highligted anchor. Diameter of anchor equals to 16 mm }}}\]
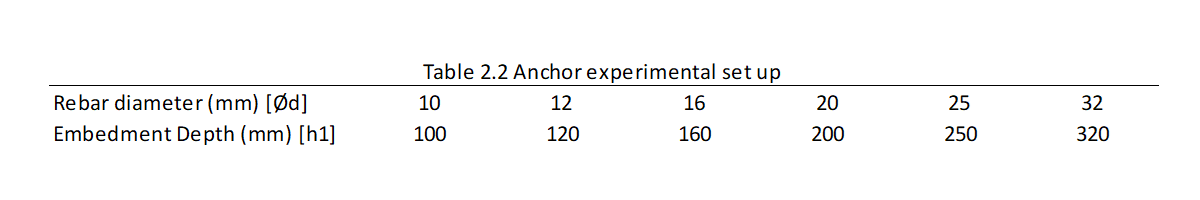
La resistenza di aderenza dell'ancoraggio, parametro critico nella progettazione degli ancoraggi, è stata determinata pari a 15,4 MPa in base alle considerazioni sperimentali[1], e 12,0 MPa per il secondo modello di verifica. Analogamente, in accordo con l'esperimento, la lunghezza di ancoraggio nel blocco in calcestruzzo è stata determinata in modo coerente. Nel modello è stata considerata la lunghezza aggiuntiva di 50 mm dell'ancoraggio al di sopra del blocco in calcestruzzo, alla quale è stata applicata la forza di trazione assiale. In questa prova, ancoraggi con diametro di 10 mm, 12 mm, 16 mm, 20 mm, 25 mm, 32 mm sono stati confrontati con i risultati sperimentali. Le configurazioni sperimentali sono riassunte nella Tabella 2.2.
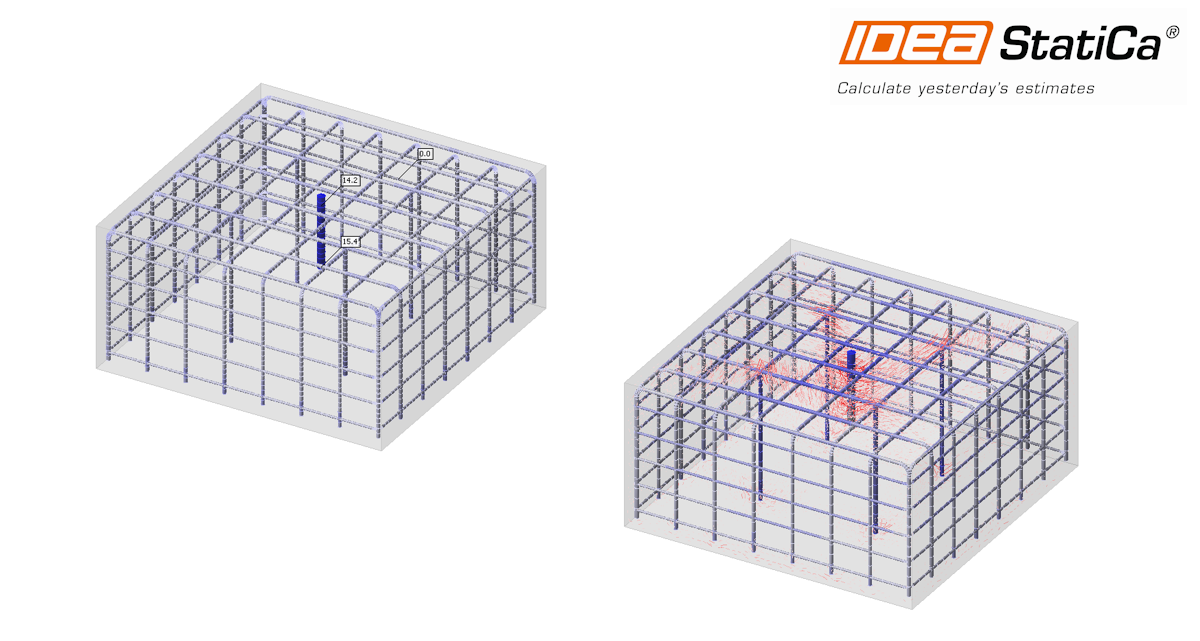
Utilizzando un modello a blocco solido CSFM 3D, l'analisi comprende un esame approfondito di vari aspetti, tra cui le caratteristiche di sfilamento dell'ancoraggio, la determinazione delle soglie di carico critiche e la previsione dettagliata delle modalità di rottura.
Proprietà dei materiali
Le proprietà dei materiali del calcestruzzo, dell'armatura e dell'ancoraggio utilizzati nell'analisi CSFM sono riassunte nella Tabella 2.2. La tensione di snervamento (\(f_{yk}\)) e la tensione ultima (\(k \times f_{yk}\)) dell'armatura, nonché la resistenza a compressione (\(f_{ck}\)), la deformazione plastica (\(\epsilon_{c2}\)) e la deformazione plastica limite (\(\epsilon_{cu2}\)) del calcestruzzo, sono state selezionate in base alle condizioni indicate nelle note dell'esperimento. La resistenza di aderenza è inoltre specificata dal produttore nel prospetto fornito.

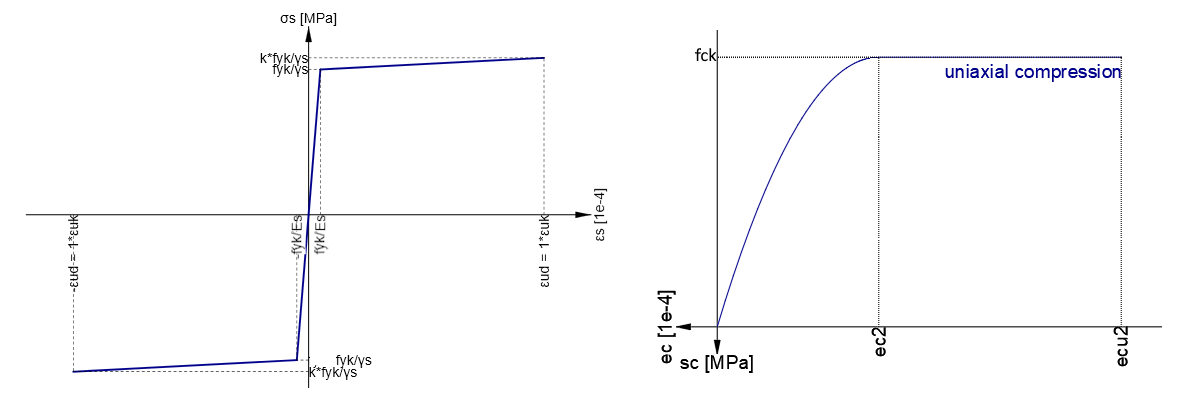
\[ \textsf{\textit{\footnotesize{Fig. 1.3 Stress strain diagrams of materials: (a) Stress-strain diagram of reinforcement B 500B, (b) Stress-strain diagram of concrete C30/37 }}}\]
Confronto con i risultati sperimentali
Questa sezione confronta i risultati sperimentali del produttore con i carichi ultimi e le modalità di rottura previsti dal CSFM 3D. Sei valori di carico ultimo di sfilamento, corrispondenti a vari diametri di ancoraggio, sono stati confrontati con i risultati del CSFM 3D. Inoltre, per ciascun diametro di ancoraggio è stata determinata una specifica modalità di rottura.
Modalità di rottura e carichi ultimi
La Tabella 2.4 presenta un riepilogo completo dei carichi ultimi registrati nelle prove sperimentali (Pu,exp) e di quelli previsti dal CSFM 3D (Pu,3D-CSFM), insieme alle corrispondenti modalità di rottura. Rapporti superiori all'unità indicano che le previsioni del modello sono cautelativamente superiori ai valori misurati. Come evidenziato nella Tabella 2.4, le modalità di rottura principali previste da tutte le analisi CSFM 3D sono coerenti con i risultati sperimentali, sebbene si riscontrino alcune discrepanze in specifici sottotipi di rottura per i diametri maggiori. Le previsioni del CSFM 3D sono generalmente accurate, con tendenze leggermente conservative indicate da rapporti superiori al 100% per i diametri maggiori.
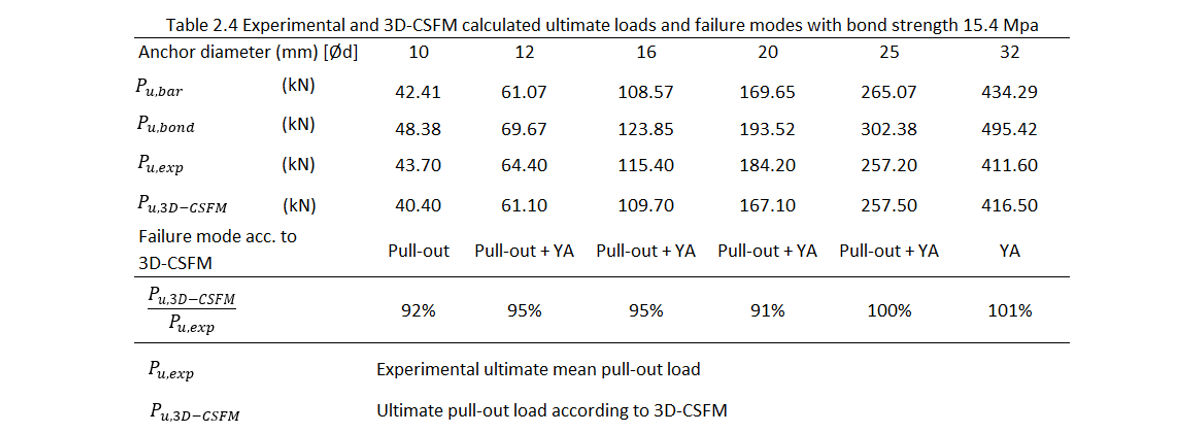
Inoltre i valori di (\(P_{u,bar}\)) e (\(P_{u,bond}\)) sono stati calcolati e aggiunti alla tabella.
\(P_{u,bar}=A_{bar}\cdot k \cdot f_{yk}\)
\(P_{u,bond}=C_{bar}\cdot l_{bar} \cdot \tau_{bd}\)
Dove (\(A_{bar}\)) è l'area dell'ancoraggio, (\(C_{bar}\)) è la circonferenza dell'ancoraggio e (\(l_{bar}\)) è la lunghezza dell'ancoraggio nel calcestruzzo.
Dai valori presentati sopra si evince che l'esperimento è impostato per dimostrare che il solutore è in grado di calcolare correttamente le modalità di rottura combinate per sfilamento e snervamento dell'ancoraggio (YA).
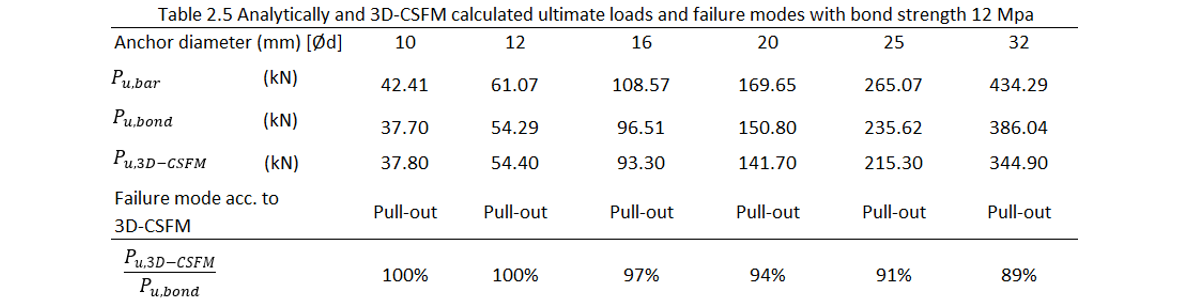
Inoltre, gli stessi modelli con resistenza di aderenza pari a (\(\tau_{bd} = 12.0 MPa\)) sono stati calcolati e confrontati con i valori determinati analiticamente di (\(P_{u,bond}\)).
La Figura 1.4 corrobora i risultati indicati nella Tabella 2.4, mostrando che viene raggiunta la piena capacità della tensione di aderenza nonché la deformazione limite, il che porta di conseguenza all'identificazione della modalità di rottura come sfilamento e snervamento dell'ancoraggio (YA).
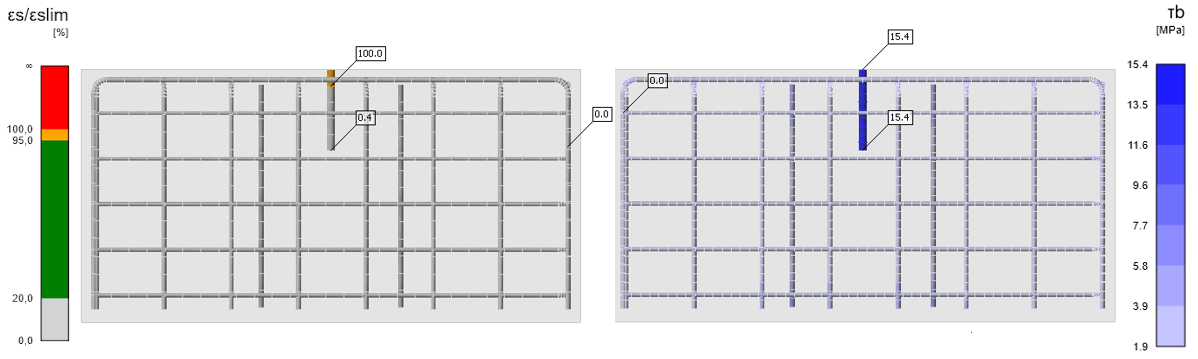
\[ \textsf{\textit{\footnotesize{Fig. 1.4 Anchor 16 mm: Strain check value (left) and Bond stress (right) }}}\]
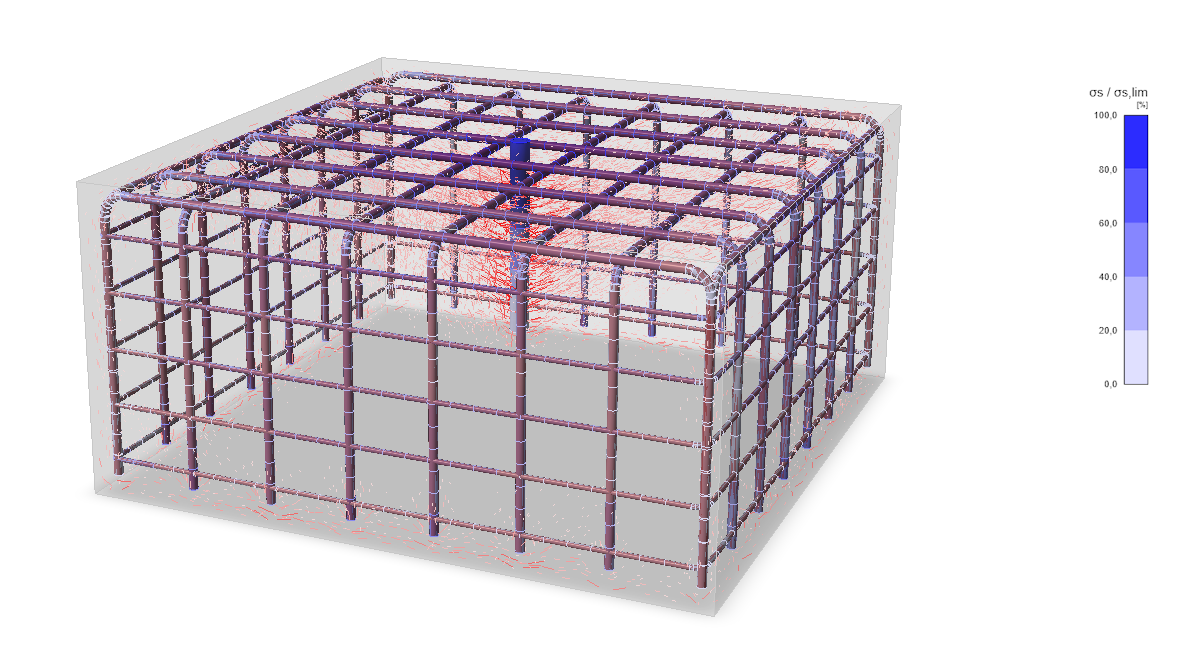
\[ \textsf{\textit{\footnotesize{Fig. 1.5 Anchor 32 mm: Stress flow view }}}\]
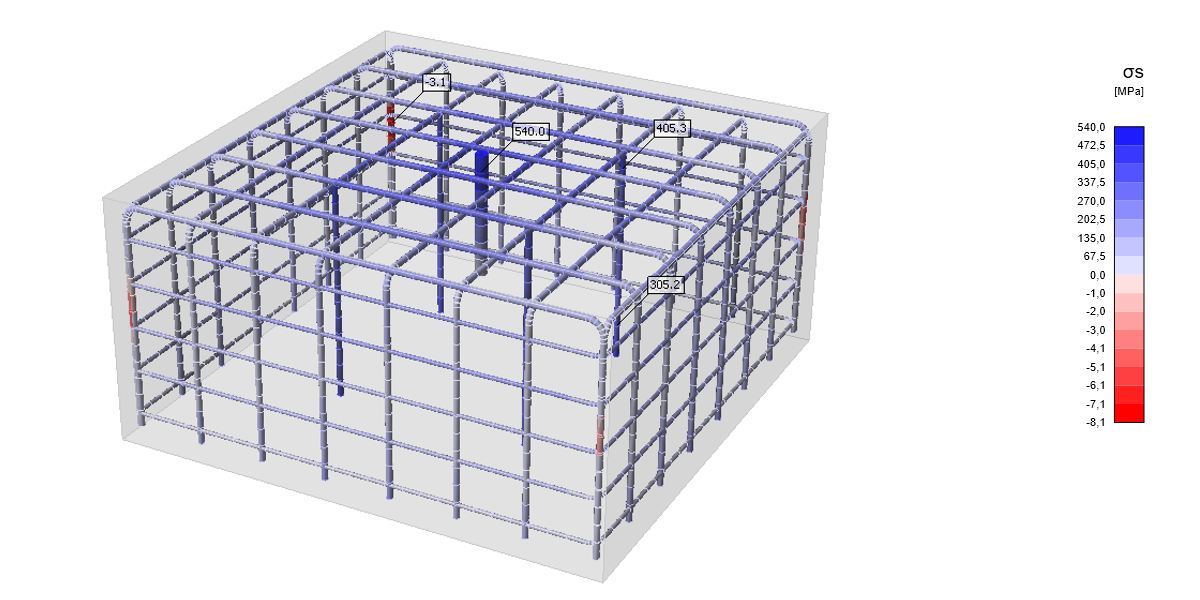
\[ \textsf{\textit{\footnotesize{Fig. 1.6 Anchor 25 mm: Stress in the reinforcement }}}\]
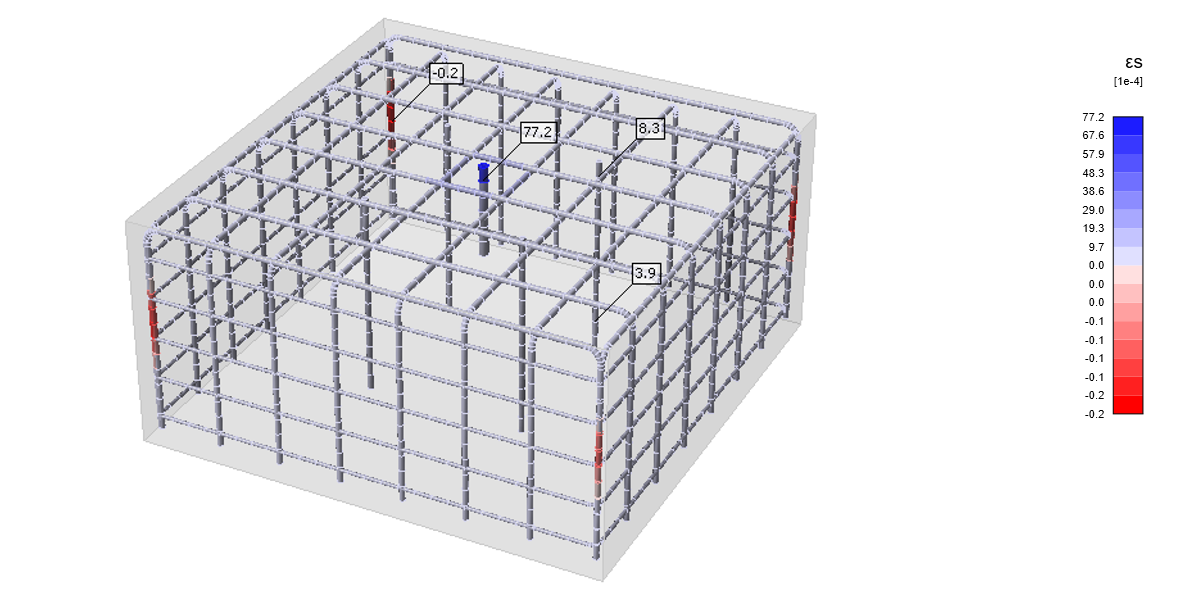
\[ \textsf{\textit{\footnotesize{Fig. 1.7 Anchor 20 mm: Strain in the reinforcement }}}\]
Conclusione
Il confronto tra i dati sperimentali[1] e la versione beta del CSFM 3D indica una correlazione soddisfacente. I principali risultati di questa valutazione preliminare includono:
- È stata stabilita una forte correlazione per tutti gli ancoraggi, evidente nelle modalità di rottura osservate nei modelli e nei valori dei carichi ultimi.
- Sebbene il CSFM 3D sia ancora in fase beta, la sua coerenza con i risultati sperimentali ne evidenzia il potenziale utilizzo. Questo accordo fornisce una certa validazione dell'efficacia dello strumento, sebbene debba essere interpretato con cautela dato il suo stadio di sviluppo.
Riferimenti
[1] - HILTI. Hilti HIT - RE500 - SD Injectable Mortar with Rebar (500B). HILTI CORPORATION. Https://www.hilti.com.hk/ [online]. 2016 [cit. 2024-04-22]. Disponibile da: https://www.hilti.com.hk/medias/sys_master/documents/h86/h89/9485674512414/Submittal-ASSET-DOC-LOC-8336225.pdf