Piastra a sezione cava circolare
Metodo delle modalità di rottura
I giunti T uniplanari saldati piastra-sezione cava circolare (CHS) previsti dal CBFEM sono verificati rispetto all'FMM in questo capitolo. Nel CBFEM, la resistenza di progetto è limitata dal raggiungimento del 5 % di deformazione o da una forza corrispondente al 3 % di deformazione del giunto d0, dove d0 è il diametro del corrente. L'FMM si basa sul limite di carico di picco o sul limite di deformazione del 3 % d0; si veda Lu et al. (1994). Le saldature, progettate secondo EN 1993‑1‑8:2006, non sono i componenti più deboli del giunto.
Plastificazione del corrente
La resistenza di progetto della faccia del corrente CHS è determinata utilizzando il metodo fornito dal modello FMM nel Cap. 9 di prEN 1993-1-8:2020 e in ISO/FDIS 14346; si veda Fig. 7.3.1. La resistenza di progetto del giunto piastra-CHS saldato con carico assiale è:
Giunto T
Trasversale
\[ N_{1,Rd} = 2.5 \cdot C_f f_{y0} t_0^2 (1+3 \beta^2) \gamma^{0.35} Q_f / \gamma_{M5} \]
Longitudinale
\[ N_{1,Rd} = 7.1 \cdot C_f f_{y0} t_0^2 (1+0.4 \eta) Q_f / \gamma_{M5} \]
Giunto X
Trasversale
\[ N_{1,Rd} = 2.1 \cdotC_f f_{y0} t_0^2 (1+3 \beta^2) \gamma^{0.25} Q_f / \gamma_{M5} \]
Longitudinale
\[ N_{1,Rd} = 3.5 \cdotC_f f_{y0} t_0^2 (1+0.4 \eta^2) \gamma^{0.1} Q_f / \gamma_{M5} \]
dove:
- fy,i – resistenza allo snervamento dell'elemento i (i = 0,1,2 o 3)
- ti – spessore della parete dell'elemento CHS i (i = 0,1,2 o 3)
- \(\beta\) – rapporto tra il diametro medio o la larghezza degli elementi di corrente secondario e quello del corrente principale
- \(\eta\) – rapporto tra l'altezza dell'elemento di corrente secondario e il diametro o la larghezza del corrente principale
- \(\gamma\) – rapporto tra la larghezza o il diametro del corrente principale e il doppio del suo spessore di parete
- Qf – fattore di tensione del corrente
- Cf – fattore di materiale
- \(\gamma_{M5}\) – coefficiente parziale per la resistenza dei giunti nelle travi reticolari a sezione cava
- Ni,Rd – resistenza di progetto di un giunto espressa in termini di forza assiale interna nell'elemento i (i = 0,1,2 o 3)
\[ \textsf{\textit{\footnotesize{Fig. 7.3.1 Examined failure mode - chord plastification}}}\]
Campo di validità
Il CBFEM è stato verificato per giunti tipici di sezioni cave circolari saldate. Il campo di validità per questi giunti è definito nella Tabella 7.8 di prEN 1993-1-8:2020; si veda Tab. 7.3.1. Lo stesso campo di validità è applicato al modello CBFEM. Al di fuori del campo di validità dell'FMM, è necessario predisporre un esperimento per la validazione o eseguire una verifica secondo un modello di ricerca validato.
Tab. 7.3.1 Campo di validità per il metodo delle modalità di rottura
| Generale | \(0.2 \le \frac{d_i}{d_0} \le 1.0 \) | \( \theta_i \ge 30^{\circ} \) | \(-0.55 \le \frac{e}{d_0} \le 0.25 \) |
| \(g \ge t_1+t_2 \) | \(f_{yi} \le f_{y0} \) | \( t_i \le t_0 \) |
| Corrente | Compressione | Classe 1 o 2 e \(10 \le d_0 / t_0 \le 50 \) (ma per giunti X: \( d_0/t_0 \le 40 \)) |
| Trazione | \(10 \le d_0 / t_0 \le 50 \) (ma per giunti X: \( d_0/t_0 \le 40 \)) | |
| Piastra trasversale | \(0.25\le\beta=b_1/d_0\le1\) | |
| Piastra longitudinale | \(0.6\le\eta=h_1/d_0\le4 \) |
Validazione
In questo capitolo, il CBFEM è validato rispetto ai modelli FMM di giunti T piastra-CHS descritti in prEN 1993-1-8:2020. I modelli sono confrontati con i dati delle prove meccaniche nelle Tab. 7.3.2–7.3.3 con la resistenza basata sul limite di deformazione. Le proprietà materiali e geometriche delle prove numeriche sono descritte in (Voth A.P. e Packer A.J., 2010). Gli esperimenti al di fuori del campo di validità sono contrassegnati nelle tabelle con un asterisco * e nel grafico sono indicati per mostrare la qualità delle condizioni al contorno.
Tab. 7.3.2 Proprietà geometriche, proprietà materiali e resistenze dei collegamenti da esperimenti e modelli FMM per giunto T trasversale
| ID | Riferimento | d0 [mm] | t0 [mm] | h1 [mm] | h1/d0 [-] | d0/t0 [-] | fy0 [MPa] |
| TPT 1 | Washio et al. (1970) | 165,2 | 5,2 | 115,6 | 0,7 | 31,8 | 308,0 |
| TPT 2 | Washio et al. (1970) | 165,2 | 5,2 | 148,7 | 0,9 | 31,8 | 308,0 |
| TPT 3 | Washio et al. (1970) | 139,8 | 3,5 | 125,8 | 0,9 | 39,9 | 343,0 |
| TPT 4 | Voth et al. (2012) | 219,2 | 4,5 | 100,3 | 0,5 | 48,8 | 388,8 |
| ID | Nu,exp [kN] | Tipo di corrente secondario | Nu,exp/(t02·fy0) | N1,prEN/(t02·fy0) | Nu,exp/N1,prEN |
| TPT 1 | 169,4 | Compressione | 20,34 | 16,25 | 1,25 |
| TPT 2 | 250,5 | Compressione | 30,08 | 22,58 | 1,33 |
| TPT 3 | 184,8 | Compressione | 43,98 | 24,45 | 1,80 |
| TPT 4 | 282,5 | Trazione | 36,04 | 12,45 | 2,89 |
Tab. 7.3.3 Proprietà geometriche, proprietà materiali e resistenze dei collegamenti da esperimenti e modelli FMM per giunto T longitudinale
| ID | Riferimento | d0 [mm] | t0 [mm] | h1 [mm] | h1/d0 [-] | d0/t0 [-] | fy0 [MPa] |
| TPL 1 | Washio et al. (1970) | 165,2 | 5,2 | 165,2 | 1,0 | 31,8 | 308,0 |
| TPL 2 | Washio et al. (1970) | 165,2 | 5,2 | 330,4 | 2,0 | 31,8 | 308,0 |
| *TPL 3 | Voth et al. (2012) | 219,2 | 4,5 | 99,9 | 0,5 | 48,8 | 388,8 |
| ID | Nu,exp [kN] | Tipo di corrente secondario | Nu,exp/(t02·fy0) | N1,prEN/(t02·fy0) | Nu,exp/N1,prEN |
| TPL 1 | 107,6 | Compressione | 12,92 | 10,36 | 1,25 |
| TPL 2 | 127,4 | Compressione | 15,30 | 13,32 | 1,15 |
| *TPL 3 | 160,6 | Trazione | 20,49 | 8,75 | 2,34 |
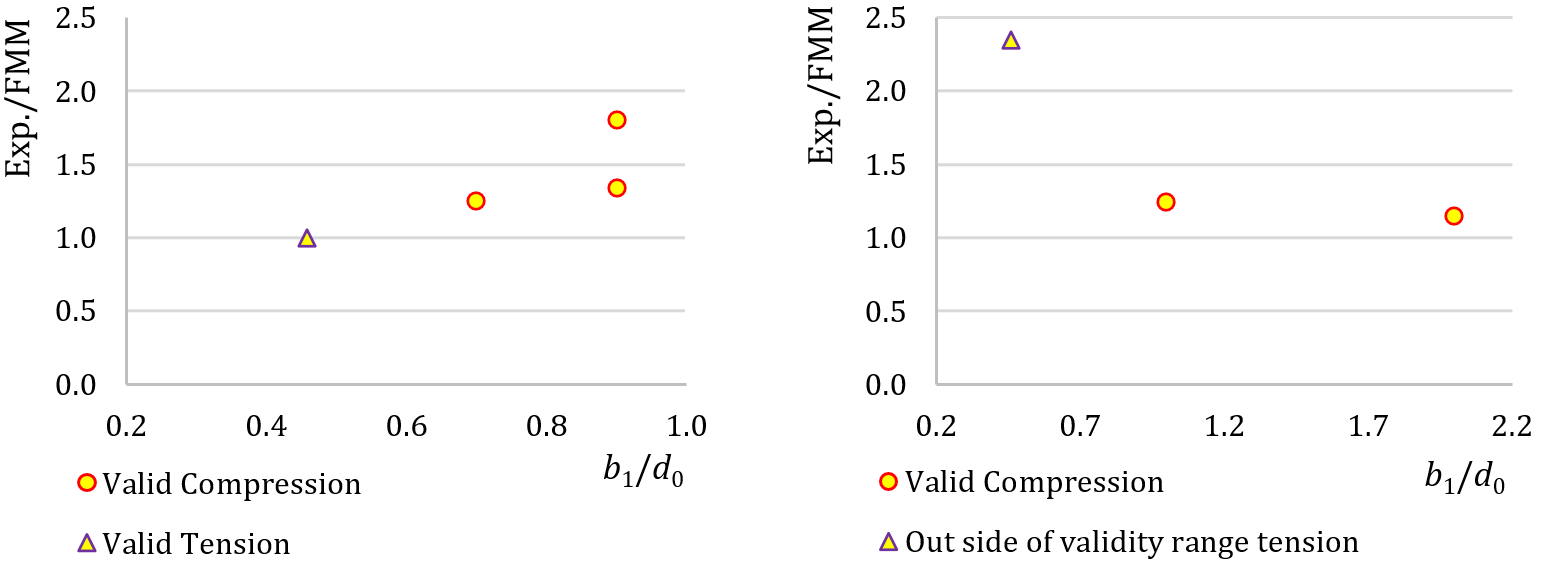
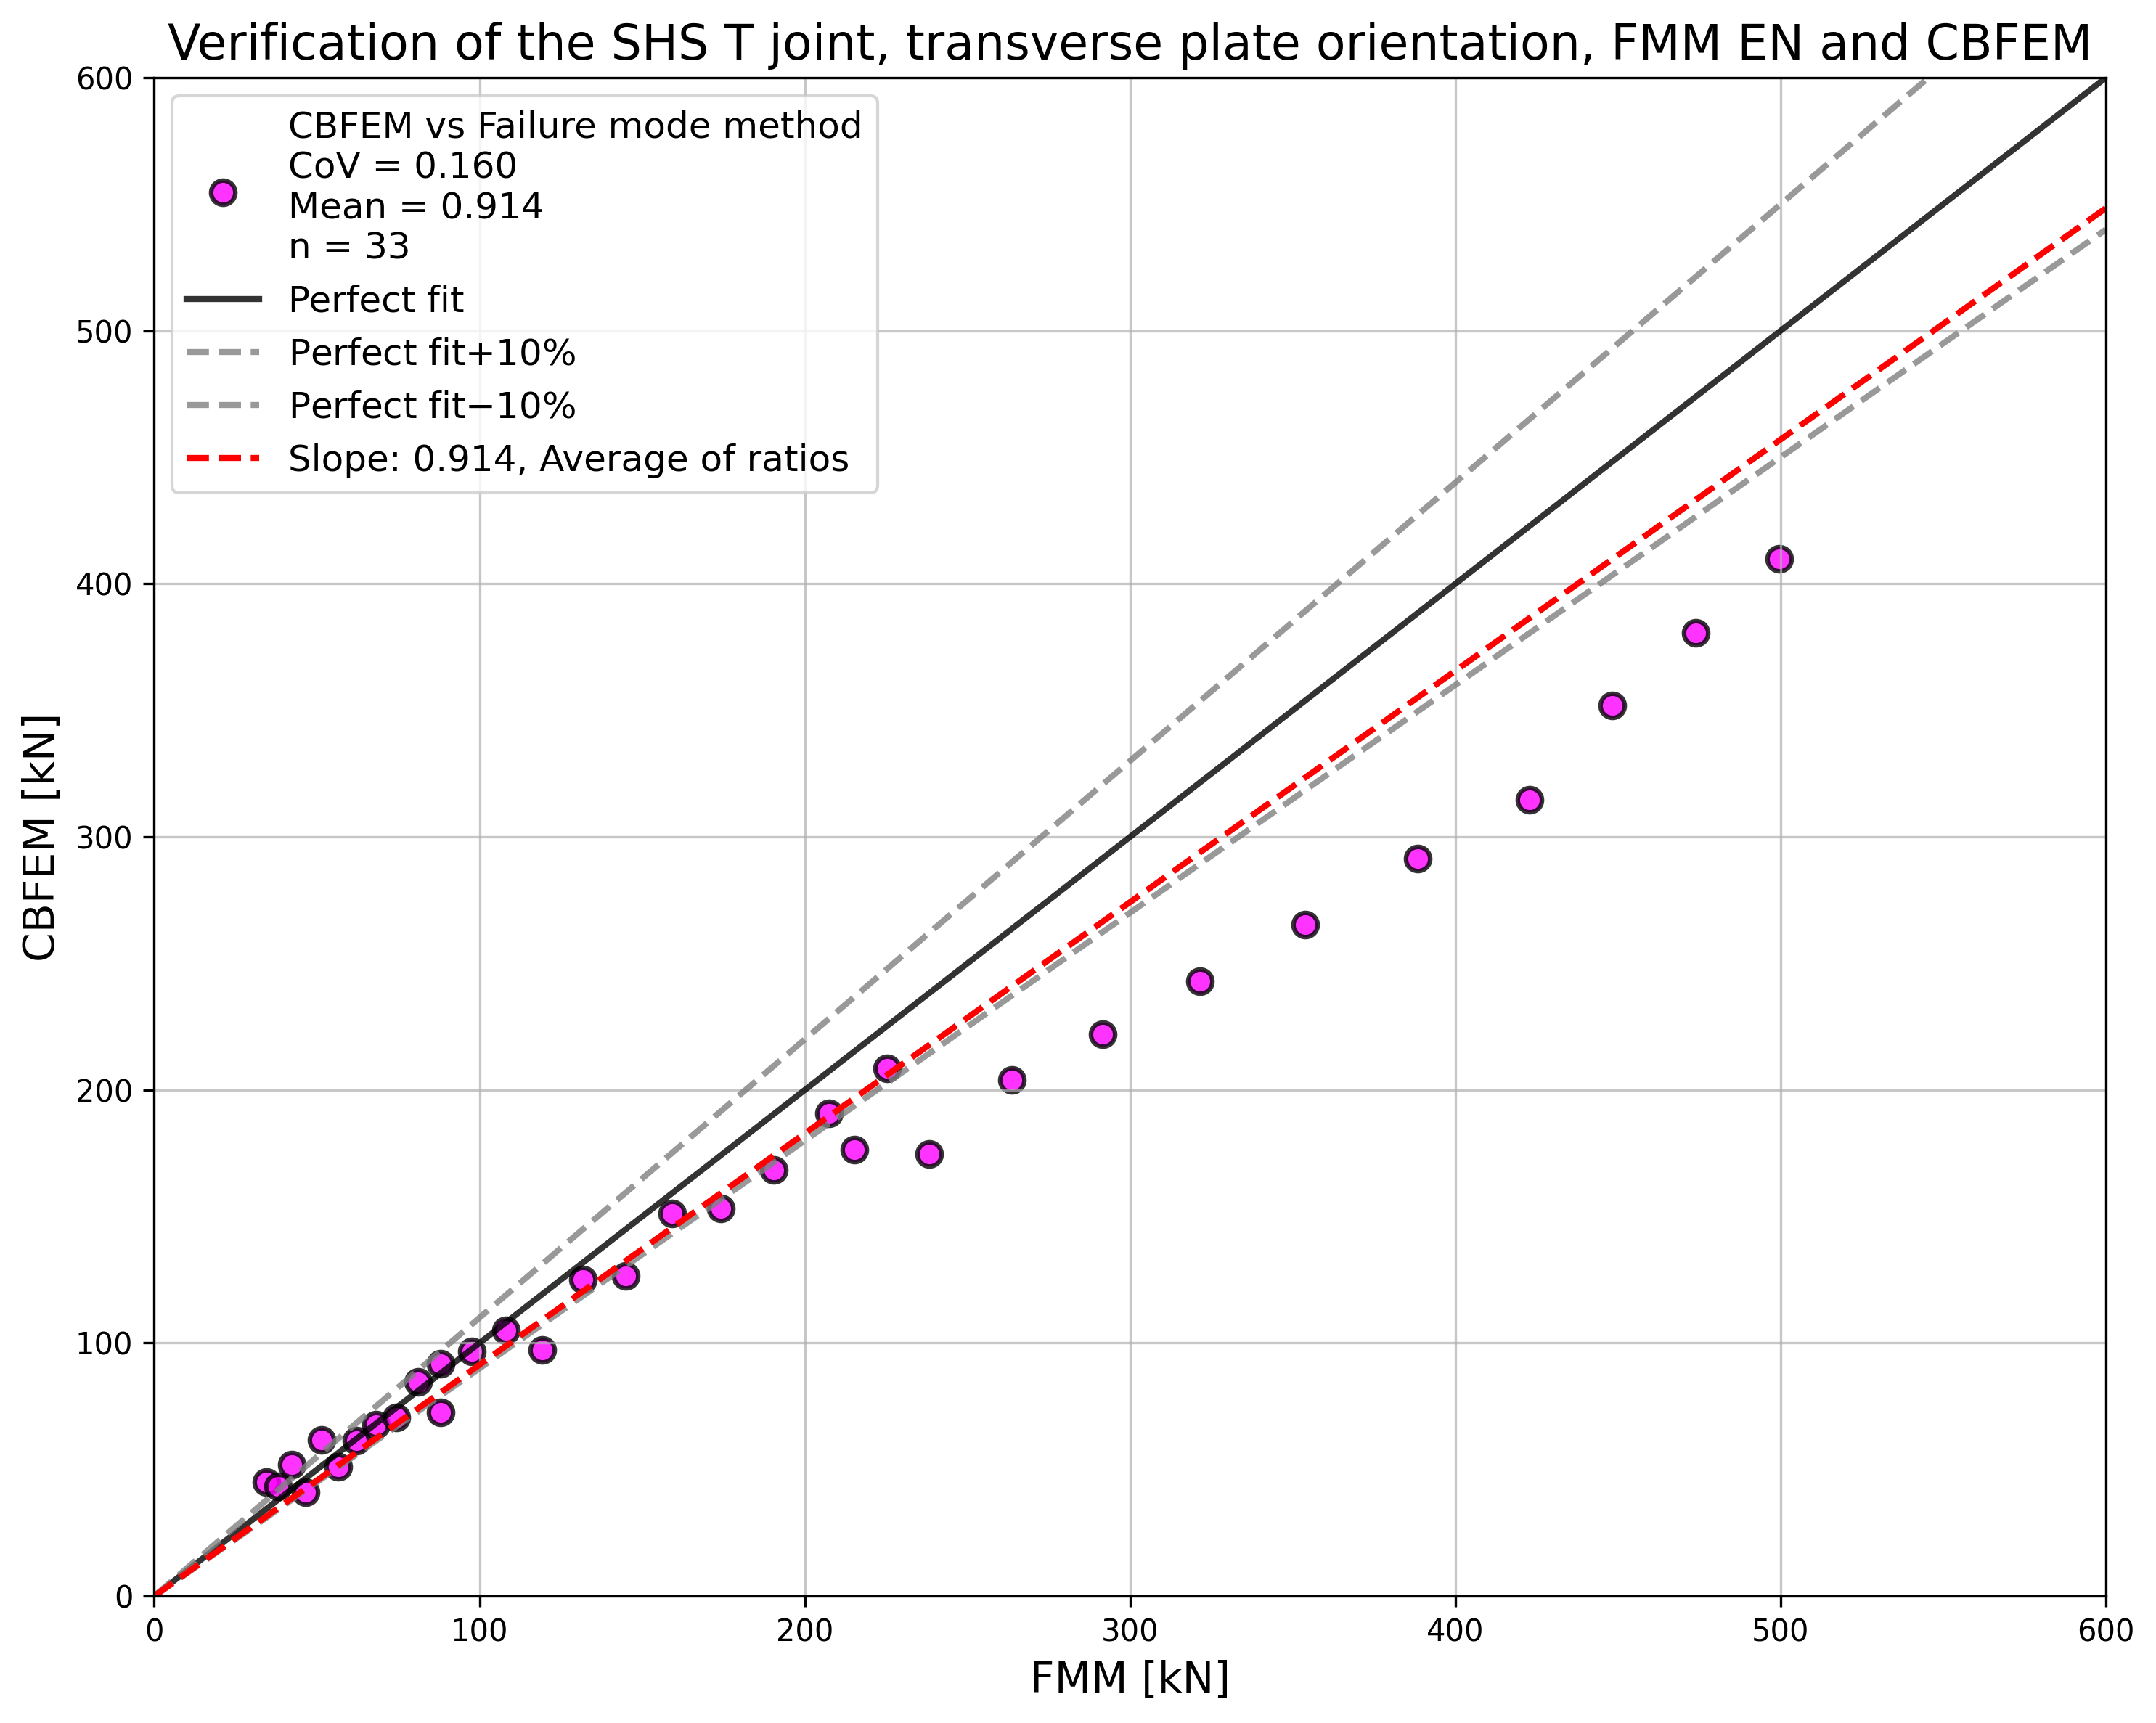
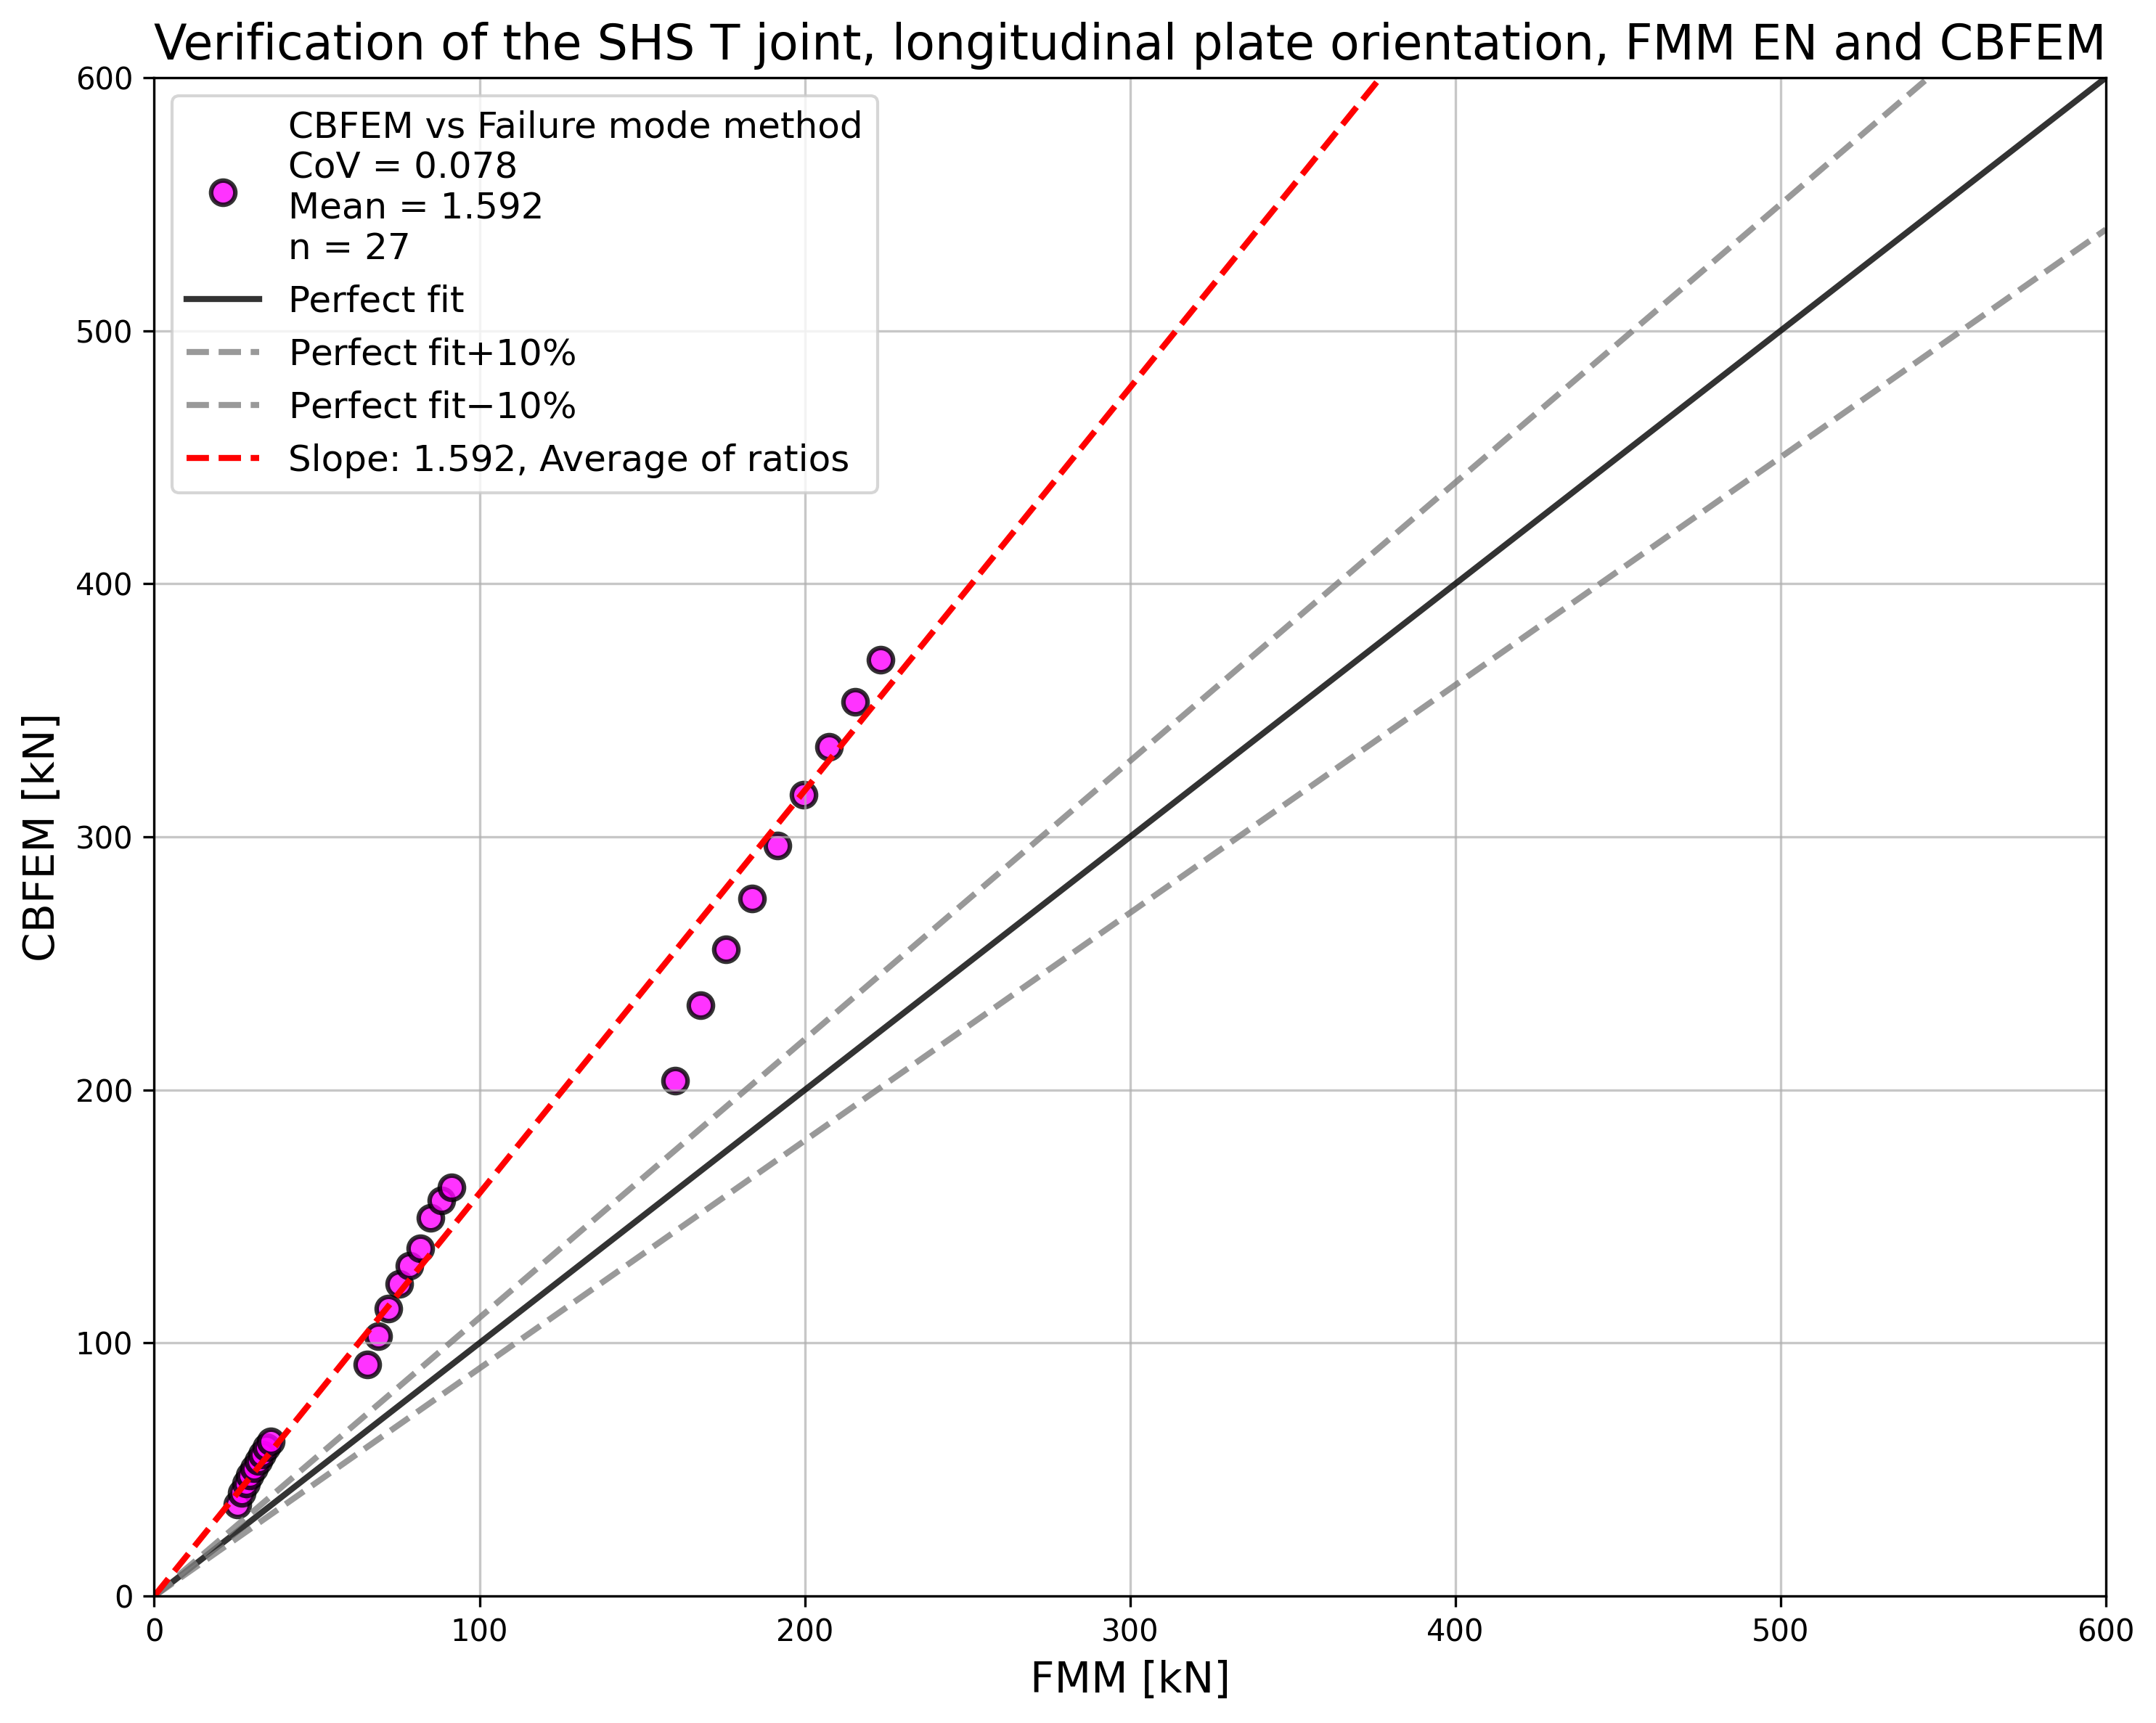
\[ \textsf{\textit{\footnotesize{ Fig. 7.3.2 Validation of FMM to mechanical experiments for transverse T-type plate-to-CHS connections (left) and to longitudinal T-type plate-to-CHS connections (right)}}}\]
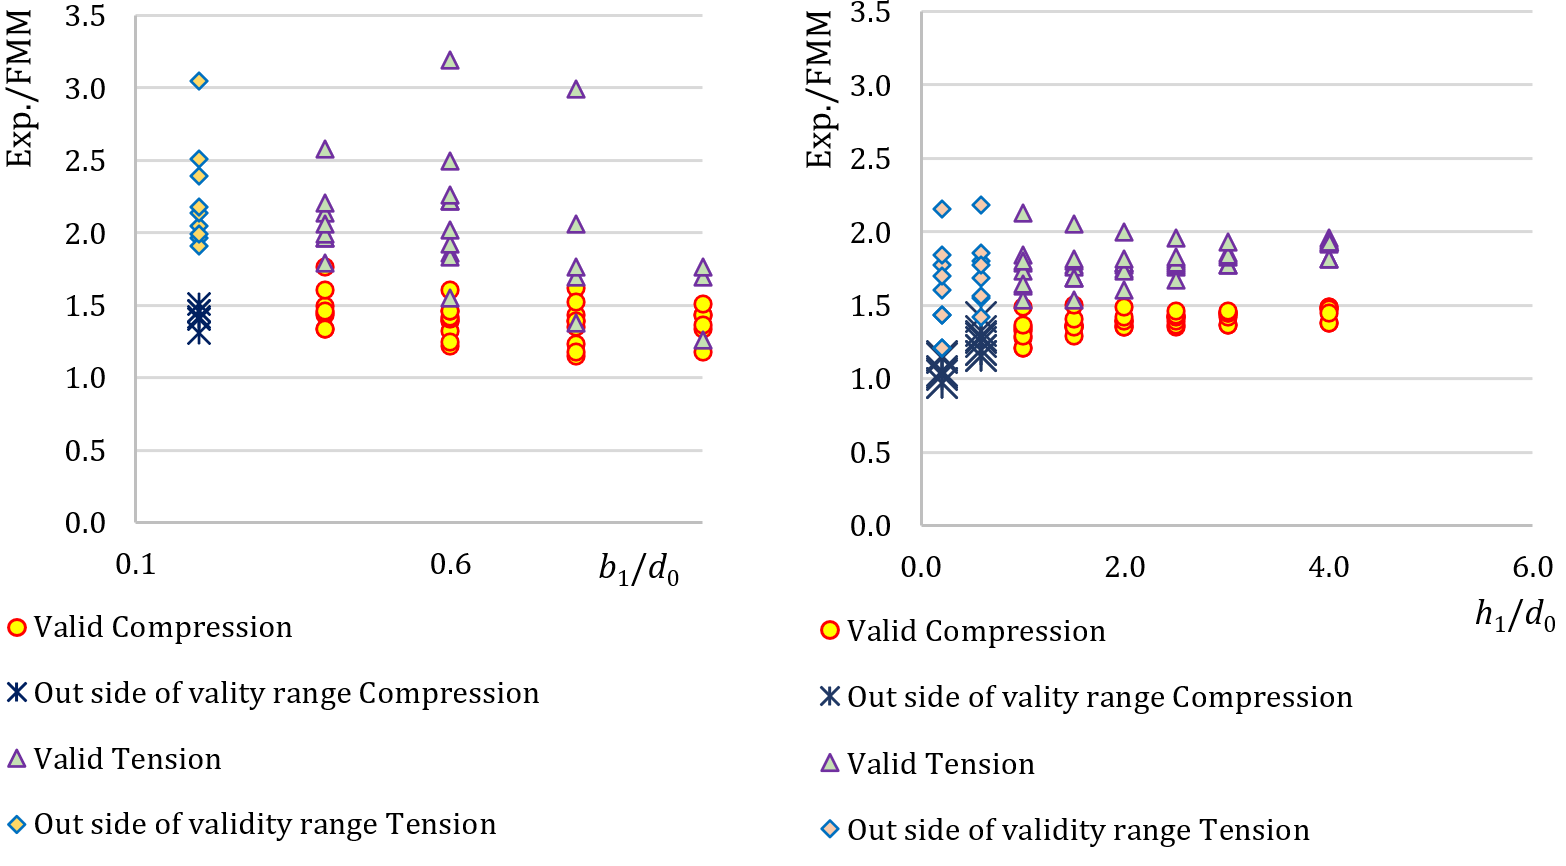
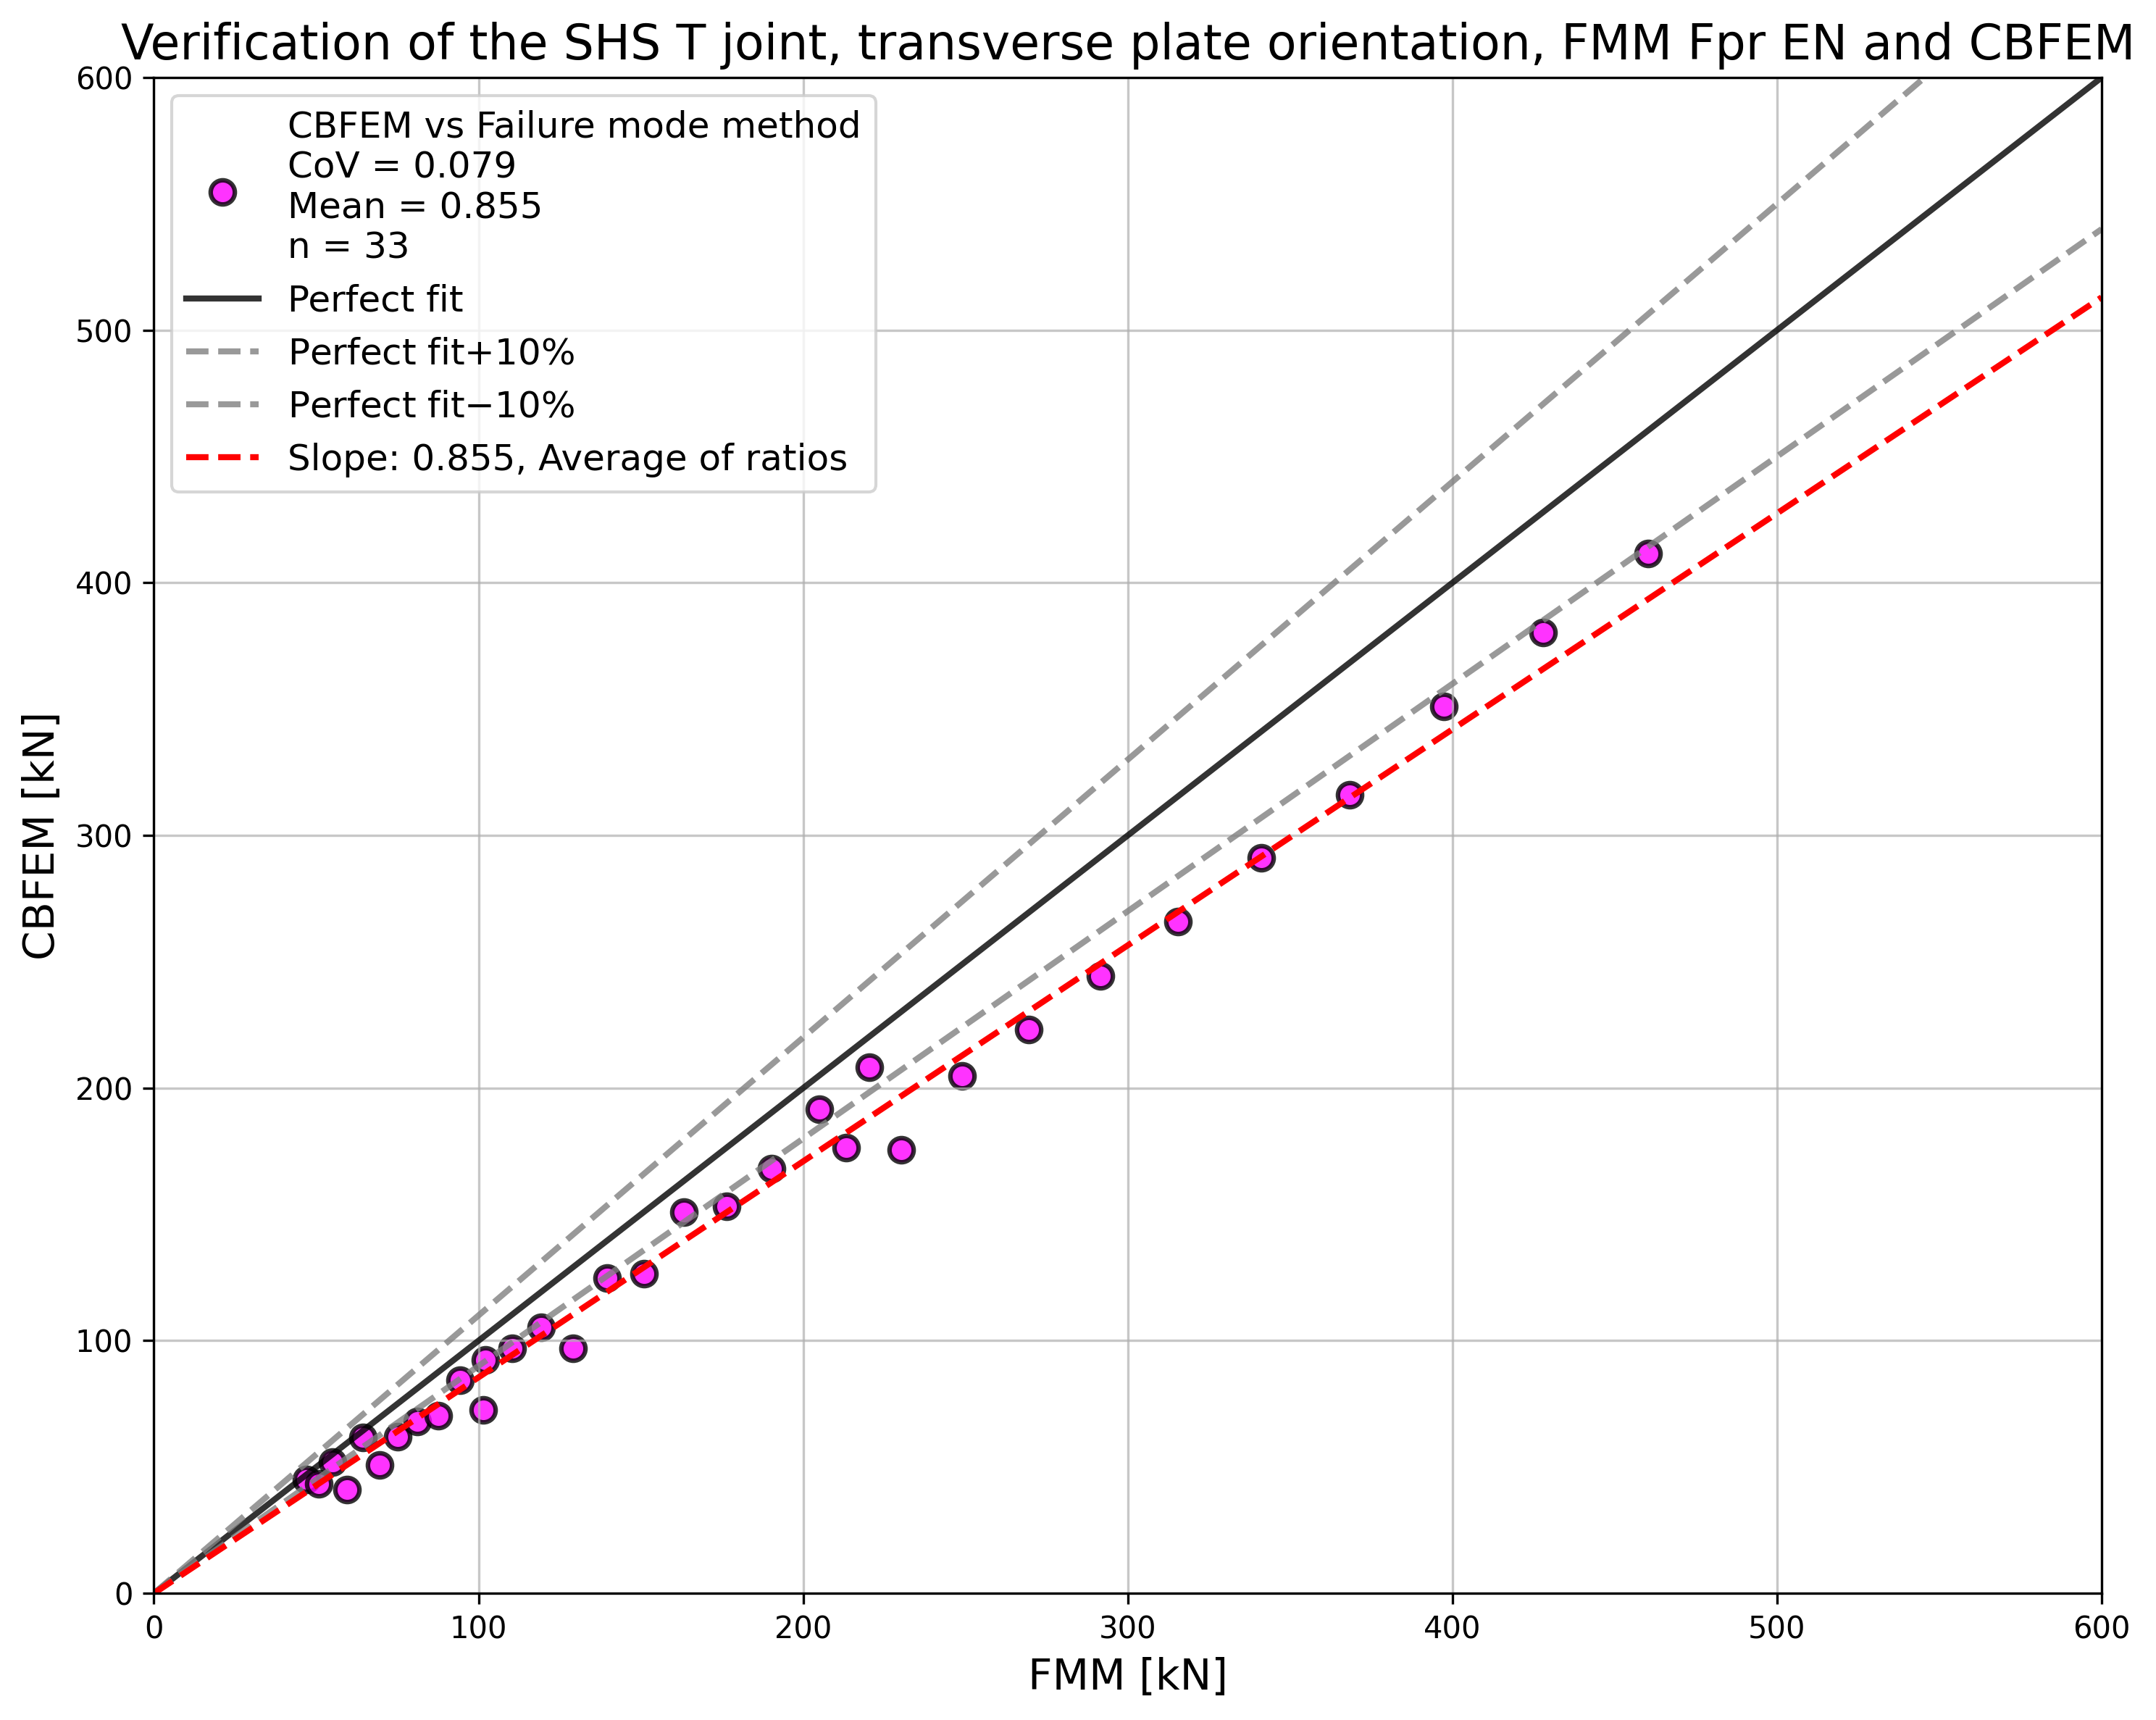
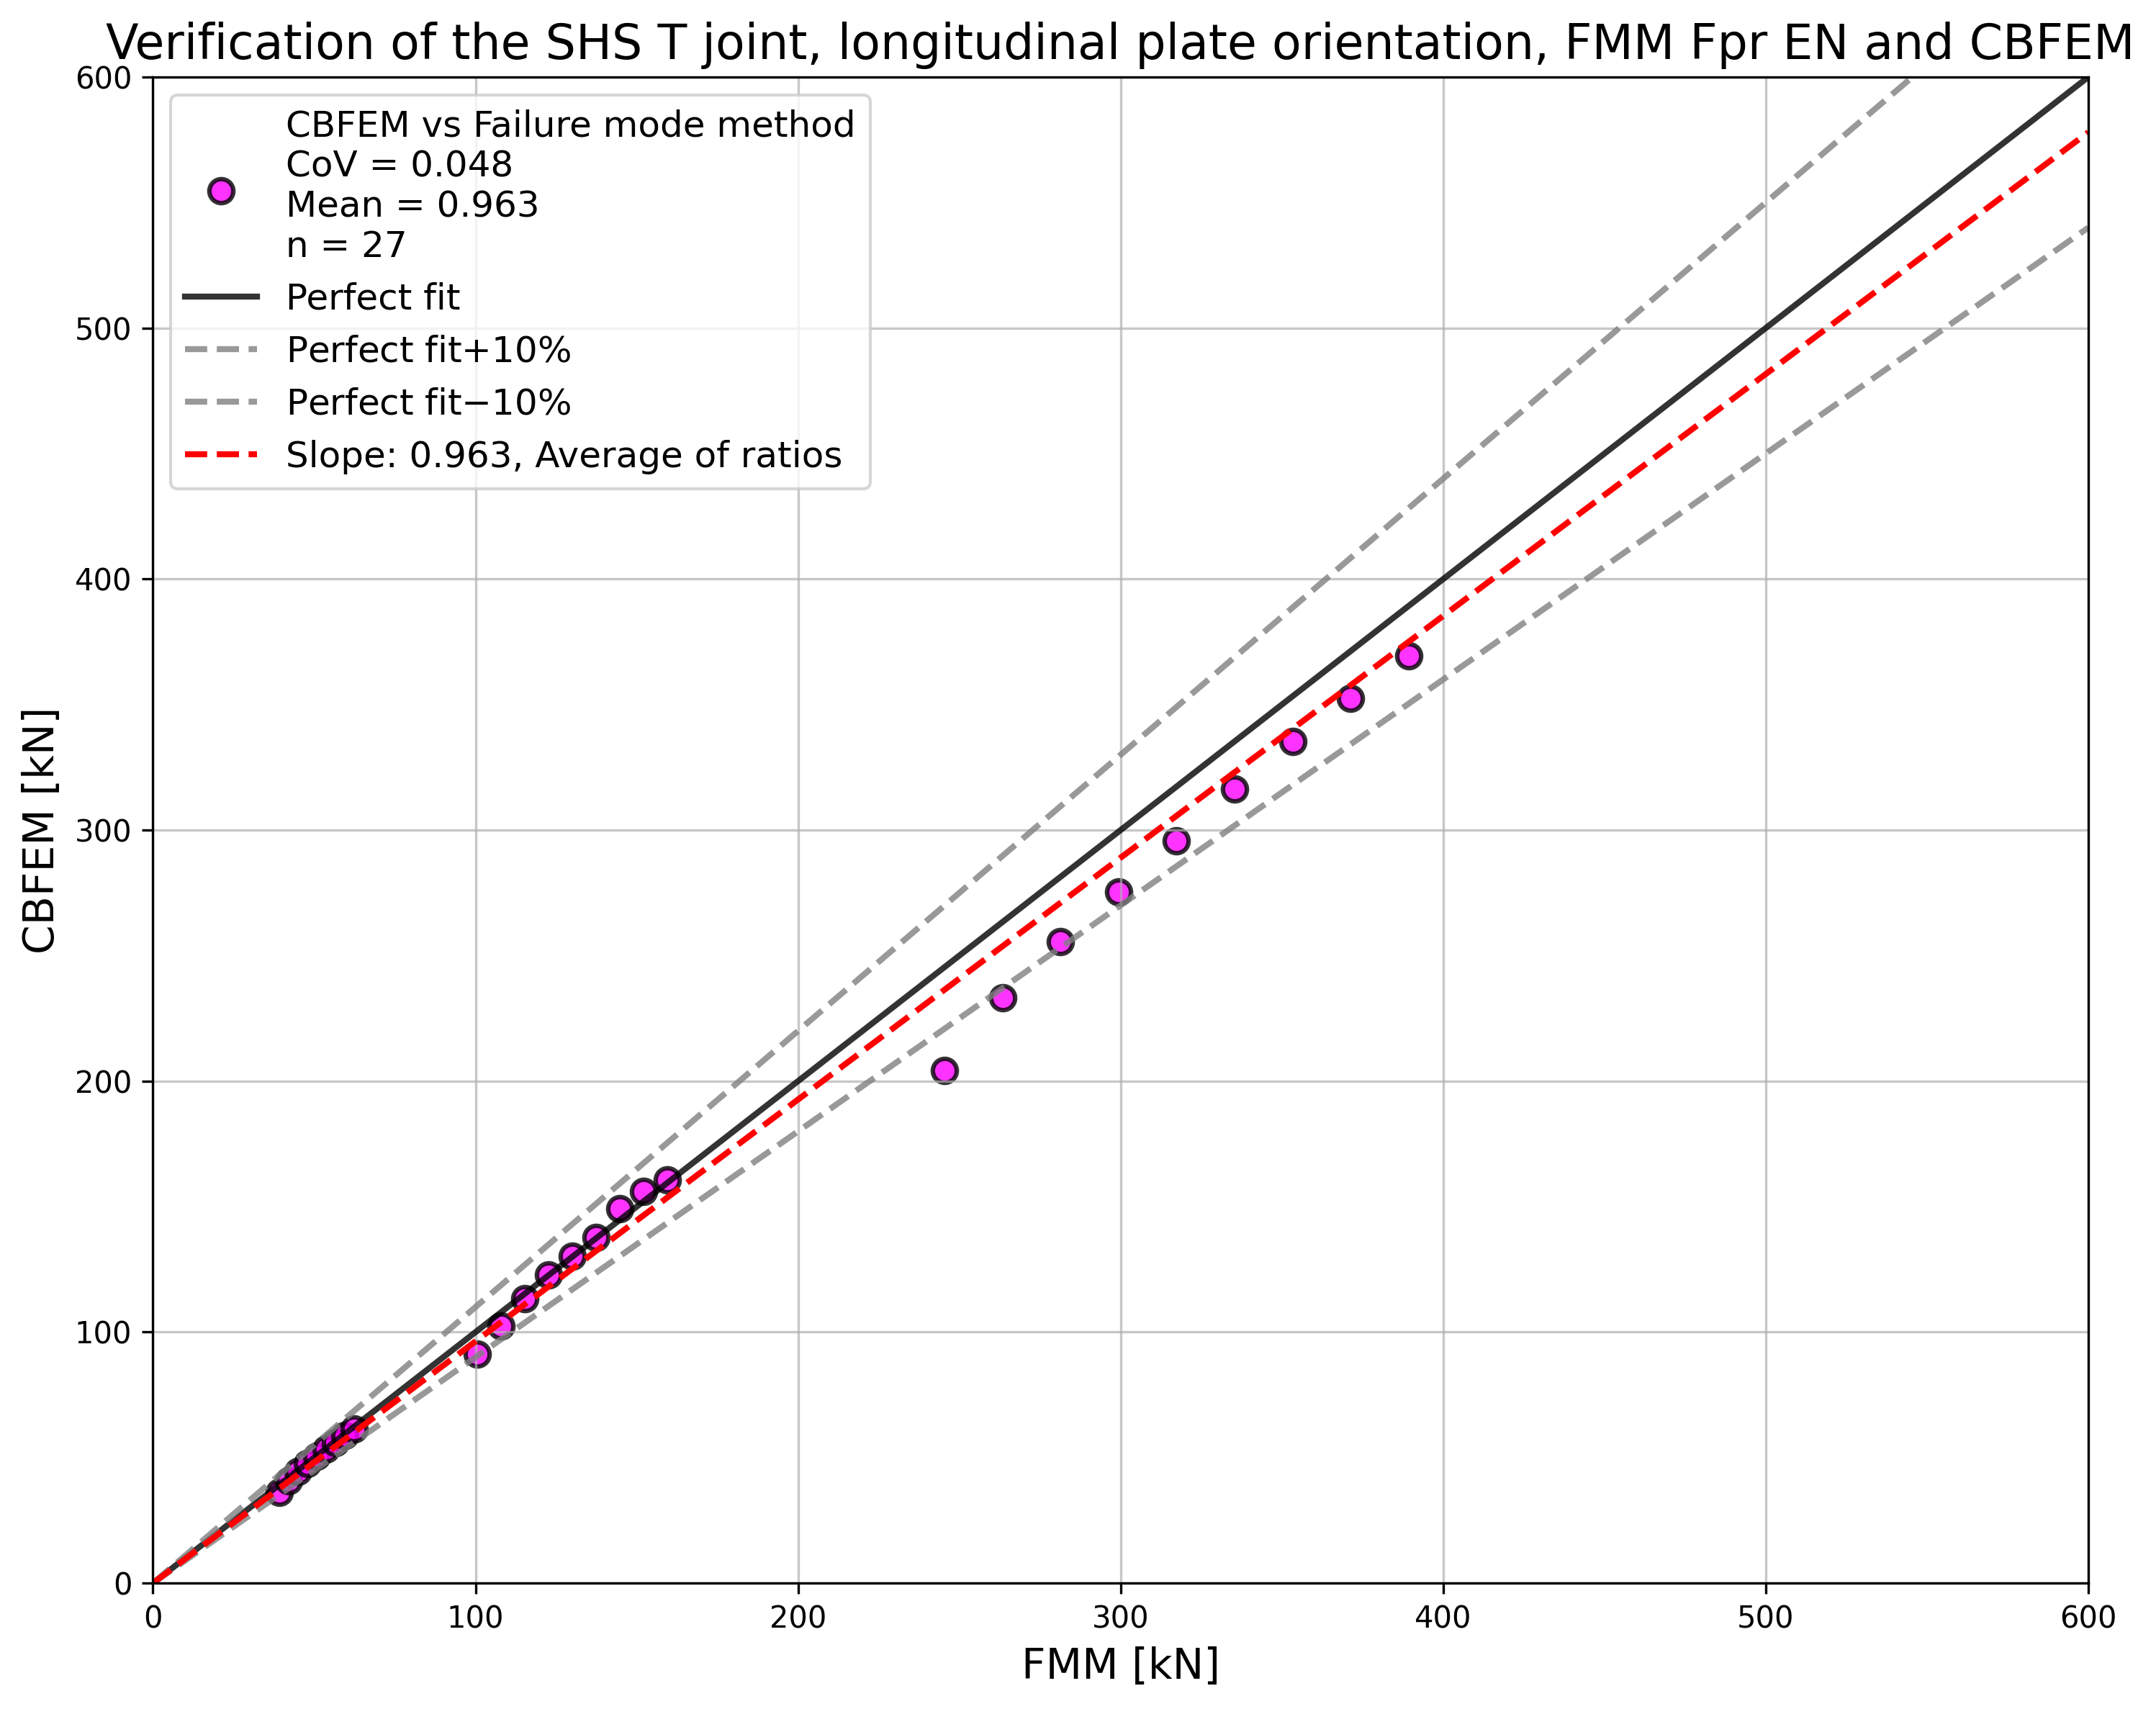
\[ \textsf{\textit{\footnotesize{Fig. 7.3.3 Validation of FMM to mechanical experiments for transverse T-type plate-to-CHS connections (left) and longitudinal T-type plate-to-CHS connections (right)}}}\]
La validazione mostrata nelle Fig. 7.3.2 e 7.3.3 dimostra che le differenze rispetto agli esperimenti sono almeno del 15 % generalmente a favore della sicurezza. Gli esperimenti al di fuori del campo di validità sono inclusi e contrassegnati. I risultati indicano la buona qualità delle condizioni al contorno scelte.
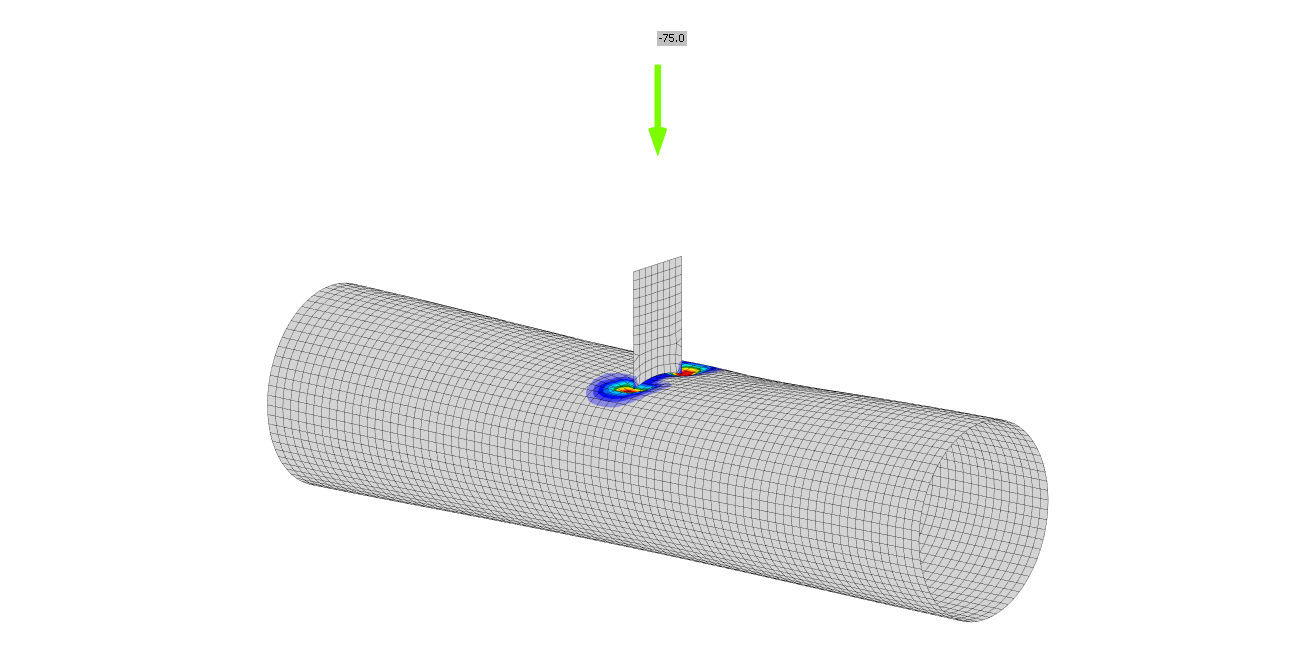
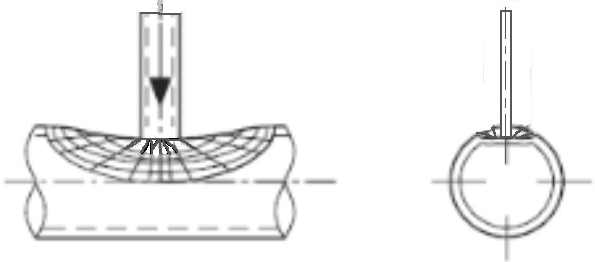
Giunto T uniplanare piastra
Una panoramica degli esempi considerati nello studio è fornita nella Tab. 7.3.4. I casi selezionati coprono un ampio intervallo di rapporti geometrici del giunto. La geometria dei giunti con le dimensioni è mostrata nella Fig. 7.3.4. Lo spessore della piastra è di 15 mm in tutti i casi trattati in questo studio.
Tab. 7.3.4 Panoramica degli esempi

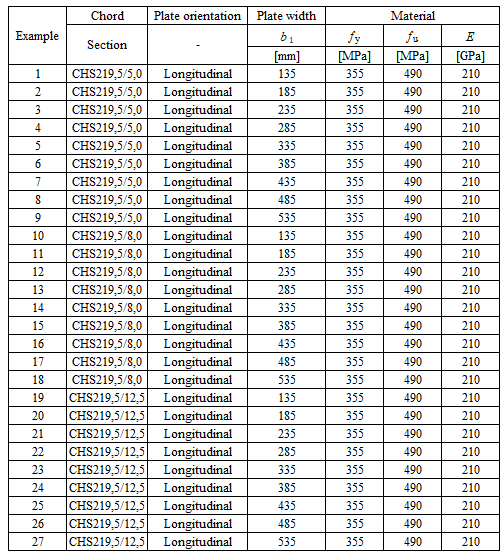
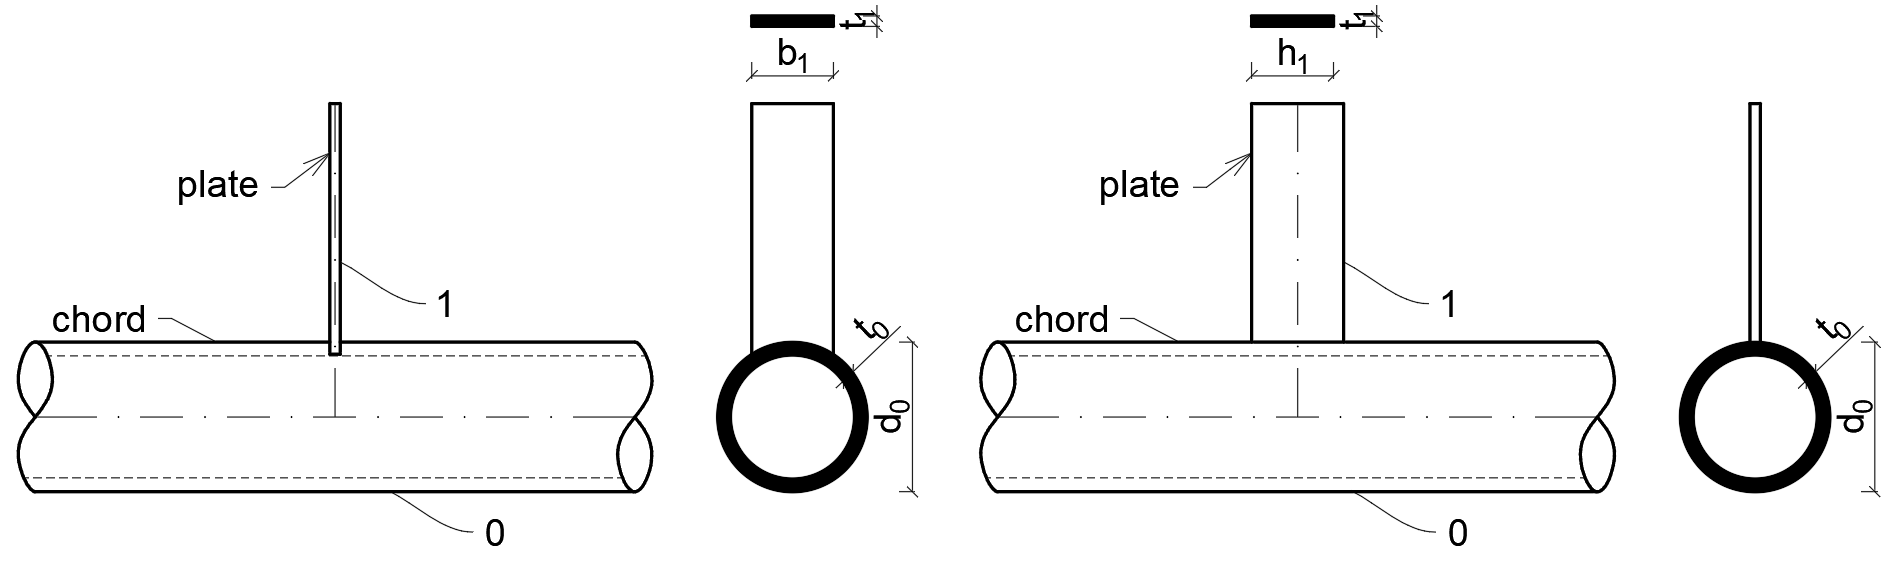
\[ \textsf{\textit{\footnotesize{Fig. 7.3.4 Dimensions of plate to CHS T joint, transverse (left) and longitudinal (right)}}}\]
Verifica
I risultati della resistenza e della modalità di rottura di progetto dell'FMM sono confrontati con i risultati del CBFEM nella Tab. 7.3.5 e nella Fig. 7.3.5.
Tab. 7.3.5 Verifica della previsione delle resistenze tramite CBFEM sull'FMM a) orientamento trasversale b) orientamento longitudinale
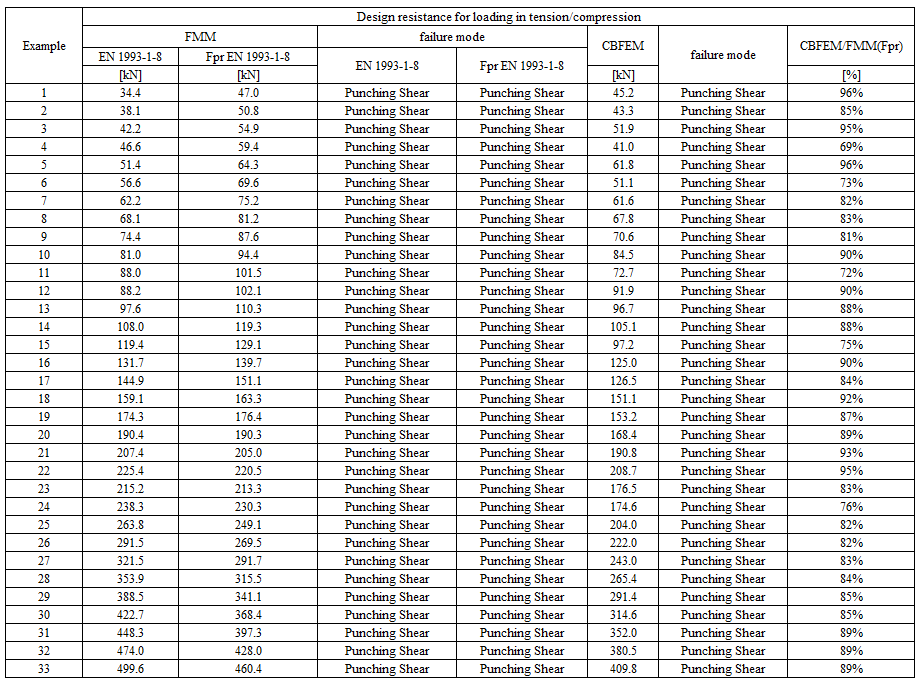
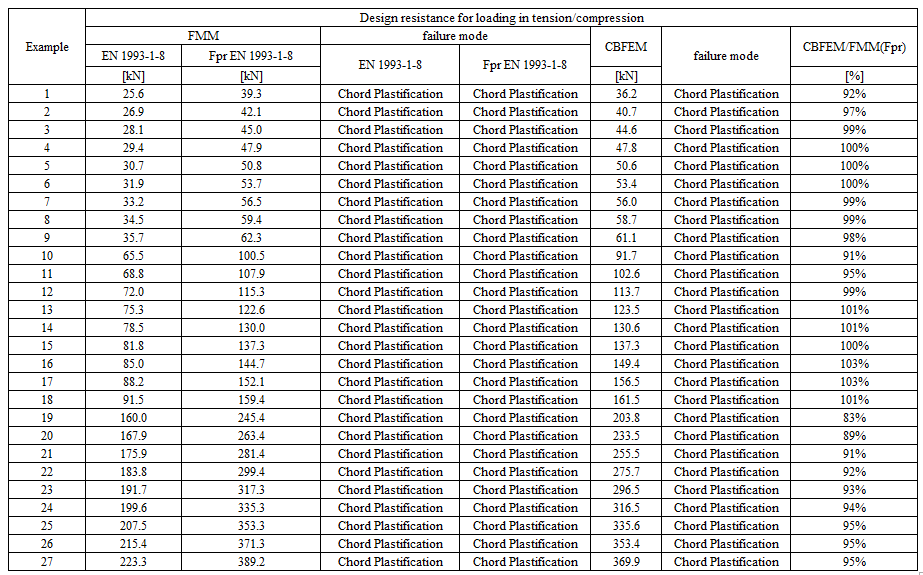
Lo studio mostra una buona concordanza per i casi di carico applicati. I risultati sono riassunti in diagrammi che confrontano le resistenze di progetto del CBFEM e dell'FMM; si veda Fig. 7.3.5. I risultati mostrano che la differenza tra i due metodi di calcolo è in tutti i casi inferiore al 7 %.
\[ \textsf{\textit{\footnotesize{Fig. 7.3.5 Verification of CBFEM to FMM for the uniplanar Plate to CHS T-joint}}}\]
Esempio di riferimento
Dati di input
Corrente principale
- Acciaio S355
- Sezione CHS219.1/5,0
Corrente secondario
- Acciaio S355
- Piastra 95/15 mm
- Angolo tra il corrente secondario e il corrente principale 90° (trasversale)
Saldatura
- Saldatura di testa attorno al corrente secondario
Carico applicato
- Forza sul corrente secondario in compressione
Dimensione della rete
- 64 elementi lungo la superficie dell'elemento cavo circolare
Risultati
- La resistenza di progetto a compressione è NRd = 45,2 kN
- La modalità di rottura di progetto è il punzonamento
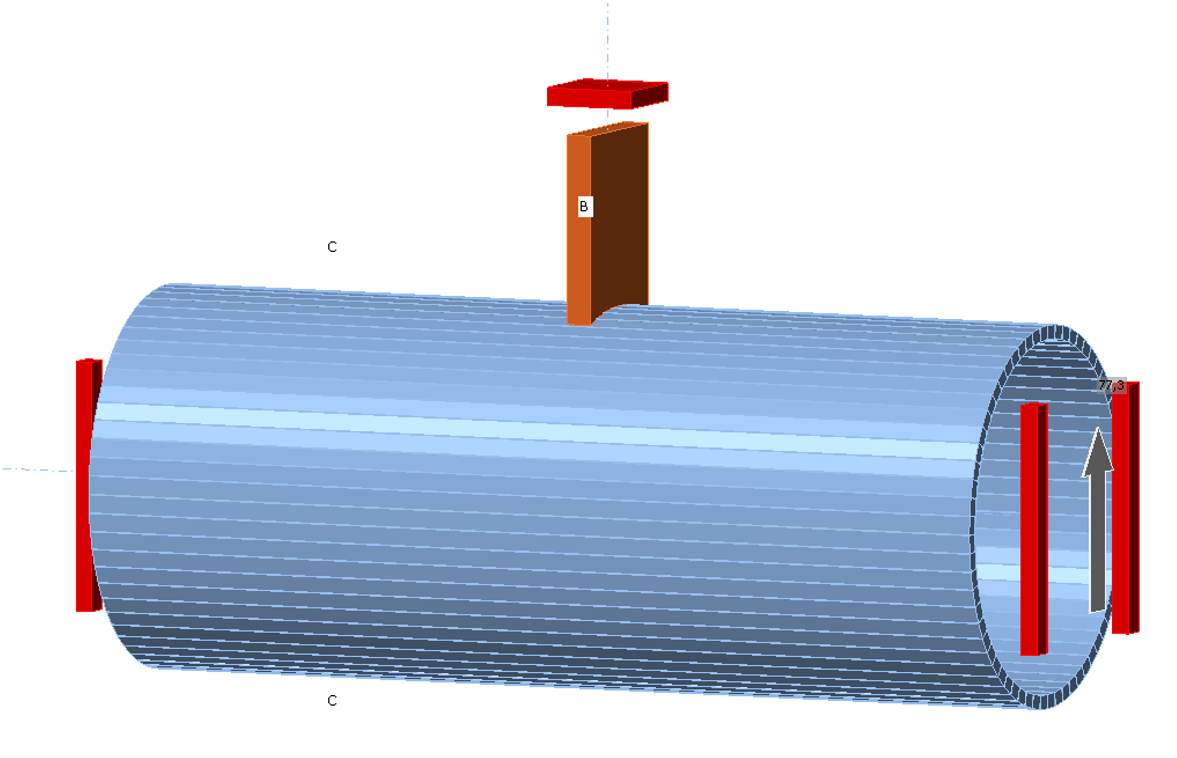
\[ \textsf{\textit{\footnotesize{Fig. 7.3.6 Boundary conditions for the uniplanar Plate to CHS T-joint}}}\]