
Effet d'adoucissement en compression - Semelles sur pieux planes 2D
Introduction :
Cette investigation expérimentale présente les résultats et une discussion sur une série de deux semelles sur pieux en béton armé avec et sans armature inclinée, de dimensions 400 × 400 × 1000 mm, testées sous chargement concentrique. La série d'étude a été réalisée à partir de béton ayant une résistance à la compression de 25,8 MPa et d'armatures de diamètres 5, 10 et 12,5 mm. La vérification a été conduite dans une solution EF - ABAQUS utilisant des éléments volumiques 3D et IDEA StatiCa 2D Detail basé sur le CSFM (Méthode du Champ de Contraintes Compatible) avec l'hypothèse préalable de contraintes planes 2D. Les armatures principales en traction et les bielles comprimées dans la semelle sur pieux ont été dimensionnées sur la base des travaux expérimentaux précédemment développés par Blévot et Frémy [4]. L'objectif de la vérification était de mener une série de simulations numériques pour comparer la capacité portante des solutions avec les essais réels et d'orienter les conclusions sur l'impact de l'adoucissement en compression pour les régions de discontinuité telles que les semelles sur pieux planes, où la rupture par cisaillement constitue le dommage principal et peut conduire à une catastrophe si elle est sous-estimée.
Dispositif expérimental
L'expérience a été conduite par l'équipe composée d'Aaron Nzambi, Lana Gomes, Cledinei Amanajás, Francisco Silva et Dênilo Oliveira [1], avec l'ambition d'étudier les effets des fibres d'acier et des armatures de cisaillement inclinées sur la capacité portante de la semelle sur pieux.
Tous les échantillons ont été soumis à un chargement centré appliqué sur la face du poteau à l'aide d'un vérin hydraulique sur une plaque d'acier pour une distribution uniforme. La poutre en acier avec des raidisseurs rigides a été utilisée comme appui pendant le chargement. Le capteur a été fixé sur la surface inférieure du corps de la semelle sur pieux, directement entre les deux pieux, où la déformation finale a été mesurée et évaluée. D'autres capteurs ont été utilisés sur les surfaces du ferraillage — des informations complémentaires peuvent être trouvées dans l'article [1]. Le chargement a été quasi-statique et de courte durée afin d'éviter les effets du comportement dépendant de la vitesse — effets rhéologiques.
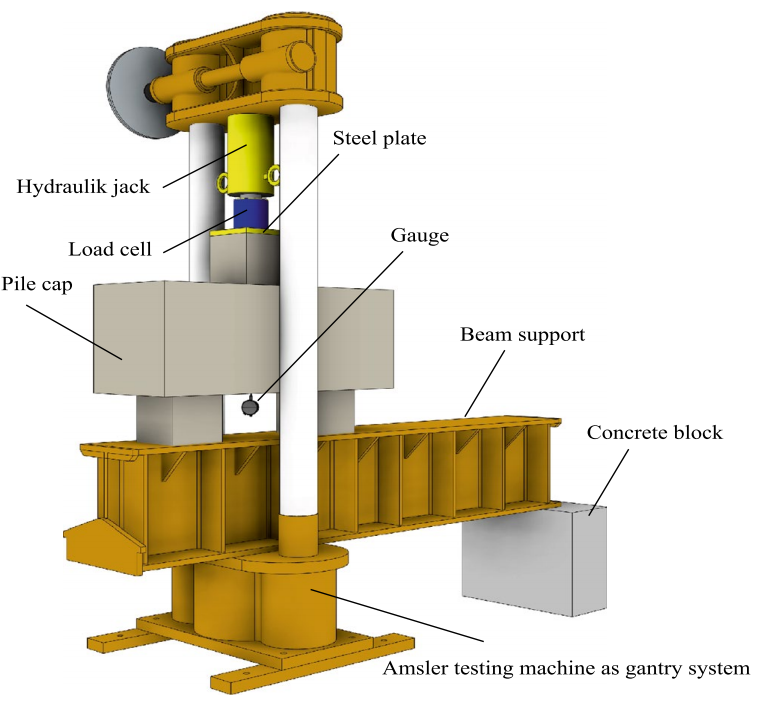
\[ \textsf{\textit{\footnotesize{Fig. 1\qquad Test assembly and gauges - installed strain gauges(left), deflectometer position (right)}}}\]
Géométrie et ferraillage
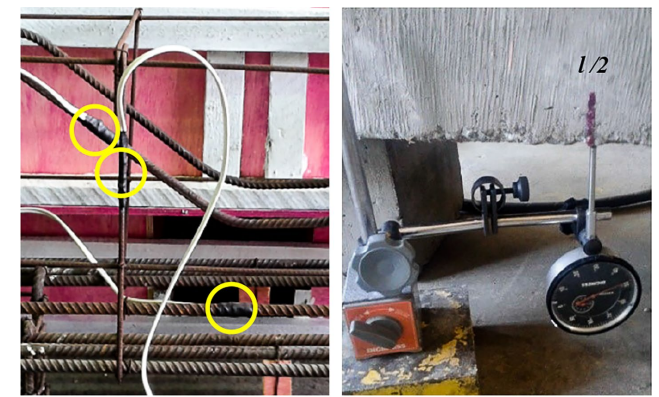
En conservant la désignation des éprouvettes telle qu'indiquée dans l'article [1], les échantillons testés, PC01REF et PC04IR, ont été soumis à des fins de vérification. Les dimensions des éprouvettes sont identiques ; cependant, les différences de contraste sont dues à la disposition du ferraillage. Dans le cas de l'éprouvette PC04IR, une barre inclinée est incluse pour capter les déformations de traction transversales dans le béton et pour renforcer cette zone.
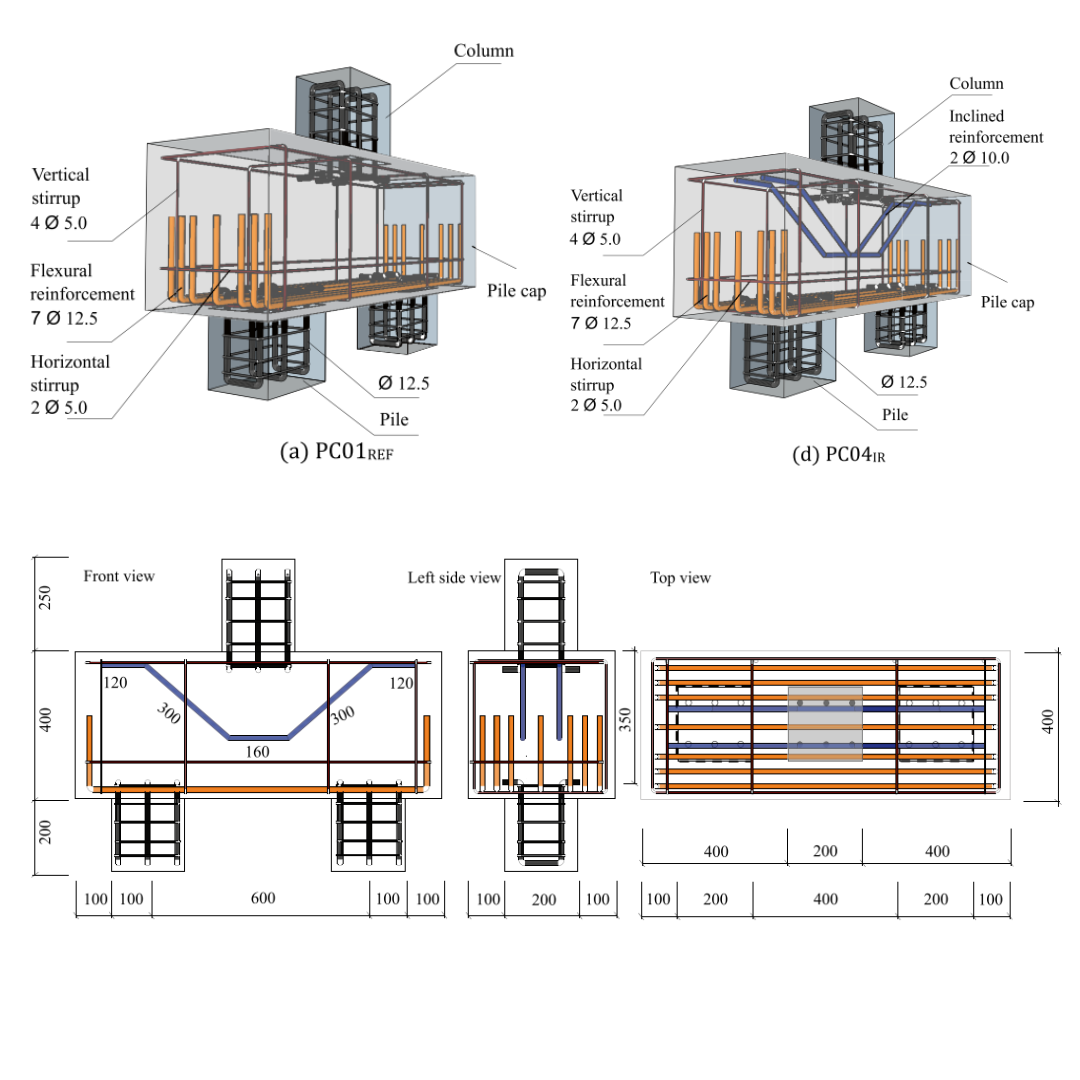
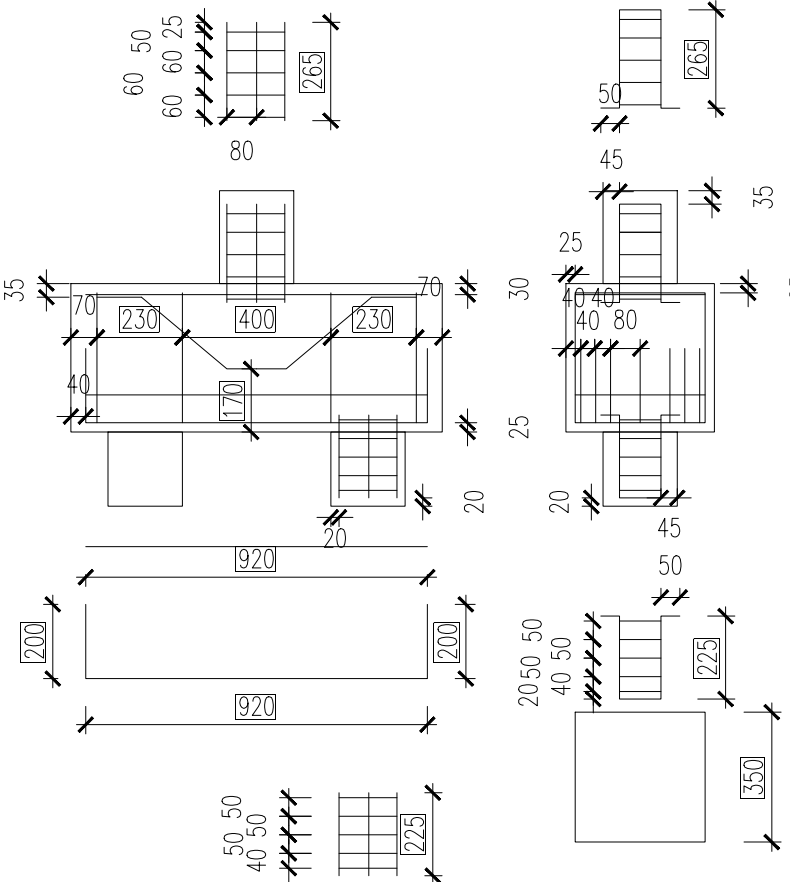
\[ \textsf{\textit{\footnotesize{Fig. 2\qquad Reinforcement setup and dimensions}}}\]
Propriétés matérielles et physiques
Le ciment, le granulat grossier, le granulat fin et le rapport eau/ciment (e/c) ont été mélangés dans une proportion de 1:2,90:2,10:0,55. Un adjuvant superplastifiant a été utilisé pour maintenir une ouvrabilité constante du béton. Les éprouvettes en béton ont été moulées et curées pendant 28 jours en laboratoire avec une humidité relative de 85 %. Le tableau présente les résultats des essais de caractérisation à 7, 14 et 28 jours. Les valeurs moyennes retenues sont : 25,8 MPa, 1,9 MPa et 28,4 GPa, respectivement pour la résistance à la compression (fc), la résistance à la traction (fct) et le module d'élasticité (Ec). Les barres d'acier utilisées dans les essais ont été classifiées conformément à la norme NBR 748015. Leurs propriétés mécaniques ont été déterminées par des essais de traction axiale, suivant les recommandations de la norme NBR ISO 6892-116 [6]. Trois échantillons ont été utilisés dans l'essai de traction ; les barres d'essai mesuraient 5,0 mm, 10,0 mm et 12,5 mm de diamètre et ont été utilisées respectivement dans les étriers, le ferraillage de cisaillement incliné et le ferraillage de flexion.
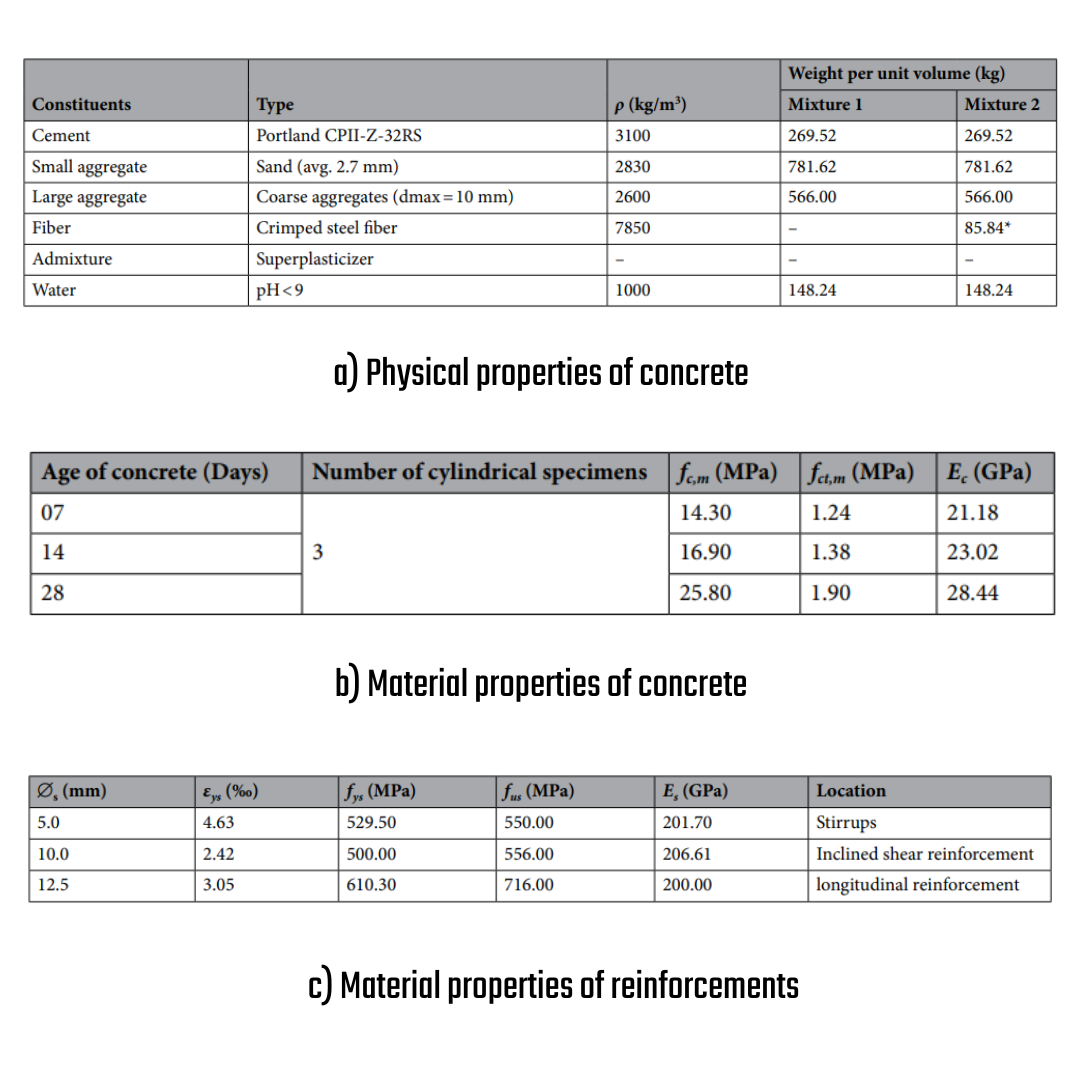
\[ \textsf{\textit{\footnotesize{Fig. 3\qquad Material and physical properties}}}\]
IDEA StatiCa 2D Detail - CSFM
La Méthode du Champ de Contraintes Compatible (CSFM) est une méthode d'analyse par champ de contraintes continue basée sur les éléments finis, dans laquelle les solutions classiques par champ de contraintes sont complétées par des considérations cinématiques, c'est-à-dire que l'état de déformation est évalué dans l'ensemble de la structure. Ainsi, la résistance effective à la compression du béton peut être calculée automatiquement en fonction de l'état de déformation transversale, de manière similaire aux analyses par champ de compression qui tiennent compte de l'adoucissement en compression (Vecchio et Collins 1986 ; Kaufmann et Marti 1998) et à la méthode EPSF (Fernández Ruiz et Muttoni 2007). De plus, le CSFM prend en compte le raidissement en traction, fournissant des rigidités réalistes aux éléments, et couvre toutes les prescriptions des codes de calcul (y compris les aspects de serviceabilité et de capacité de déformation) non traités de manière cohérente par les approches précédentes. Le béton en traction est entièrement négligé et le CSFM utilise les lois de comportement uniaxiales courantes fournies par les normes de calcul pour le béton et le ferraillage. Celles-ci sont connues au stade du dimensionnement, ce qui permet d'utiliser la méthode des coefficients partiels de sécurité. Ainsi, les concepteurs n'ont pas à fournir des propriétés matérielles supplémentaires, souvent arbitraires, telles qu'elles sont généralement requises pour les analyses EF non linéaires, rendant la méthode parfaitement adaptée à la pratique de l'ingénierie.
De plus amples informations sur la méthode sont présentées dans le contexte théorique.
Assemblage du modèle
Le modèle est composé de quatre blocs en béton représentant le corps de la semelle sur pieux, les pieux et le poteau. Les dimensions et les épaisseurs ont été déterminées sur la base du dispositif expérimental. Ce modèle est simplement appuyé ; l'appui gauche bloque les translations horizontale et verticale, tandis que l'appui droit ne bloque que la translation verticale. Des appuis ponctuels avec des plaques d'appui en acier sont utilisés pour assurer la stabilité. Ces plaques d'appui sont artificiellement épaisses — 80 mm — afin d'assurer une distribution uniforme des contraintes. Étant donné que la structure se comporte comme une poutre simplement appuyée, la hauteur des plaques d'appui n'affecte pas significativement les résultats.
Un matériau acier personnalisé avec un module d'élasticité intentionnellement élevé a été utilisé pour modéliser les plaques d'appui. En raison de la géométrie de la structure et des conditions de chargement, les contraintes de compression les plus élevées se produisent aux bords inférieurs du poteau, là où le poteau est coulé dans le corps du pieu. Bien que ces contraintes de compression dépassent la résistance à la compression du béton, la structure n'a pas perdu son intégrité et sa résistance en raison de l'effet de confinement. Étant donné que le modèle 2D ne peut pas capturer les effets de la triaxialité des contraintes, un matériau personnalisé avec une résistance à la compression augmentée a été utilisé pour modéliser les éléments de pieux et de poteau. Tous les coefficients partiels de sécurité des matériaux sont fixés à 1,0 en raison de la comparaison avec le dispositif expérimental.
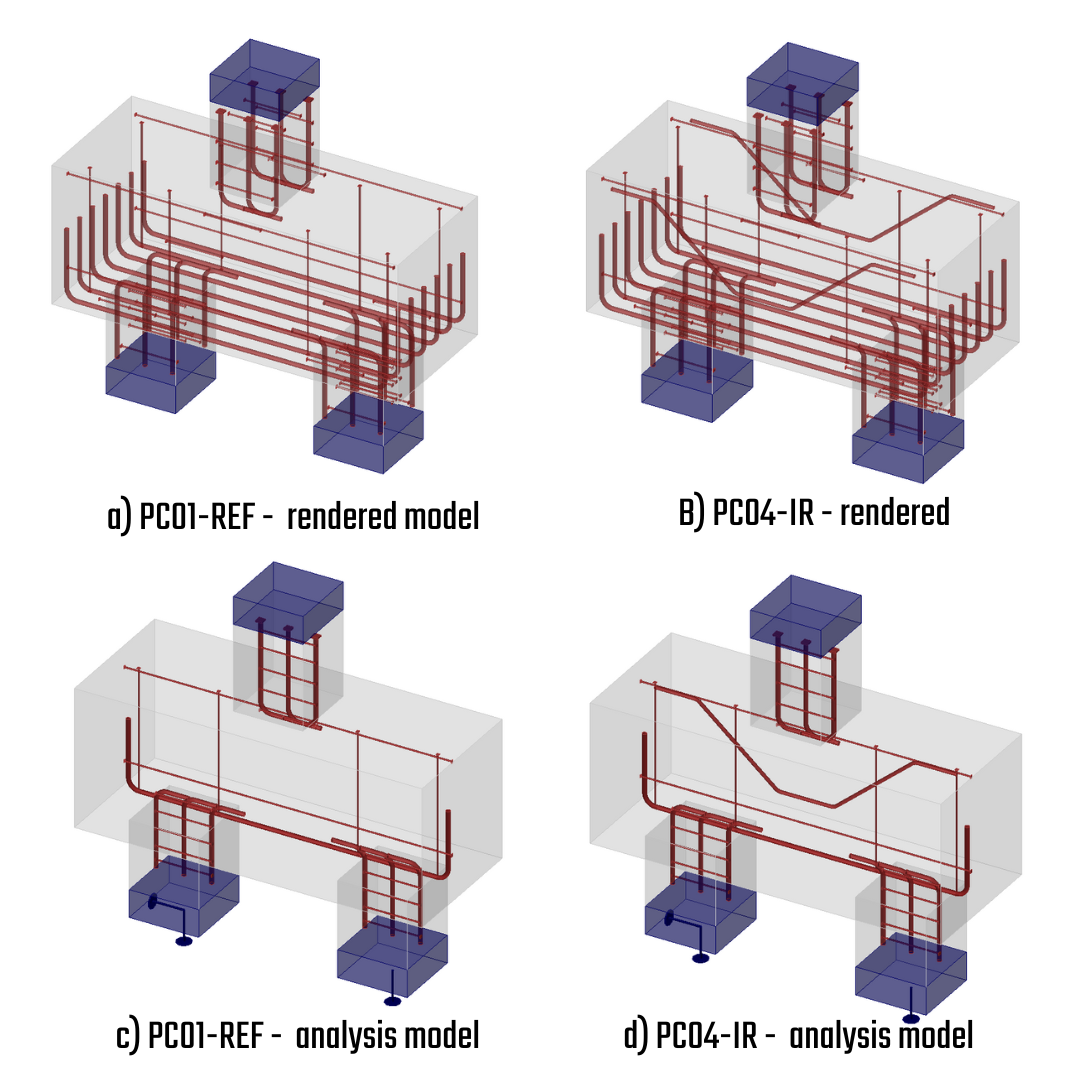
\[ \textsf{\textit{\footnotesize{Fig. 4\qquad Reinforcements rendering, analysis model}}}\]
Charges
Une force concentrée est appliquée par l'intermédiaire d'une plaque avec un module d'élasticité augmenté afin d'assurer une distribution uniforme des contraintes sur la surface supérieure du poteau. Dans l'analyse non linéaire (analyse NR), la force maximale est atteinte une fois que les critères d'arrêt sont satisfaits. En conséquence, le modèle peut devenir surchargé, entraînant l'arrêt de l'analyse avant que la charge appliquée n'atteigne 100 %. Cette approche est optimale pour atteindre la force critique.
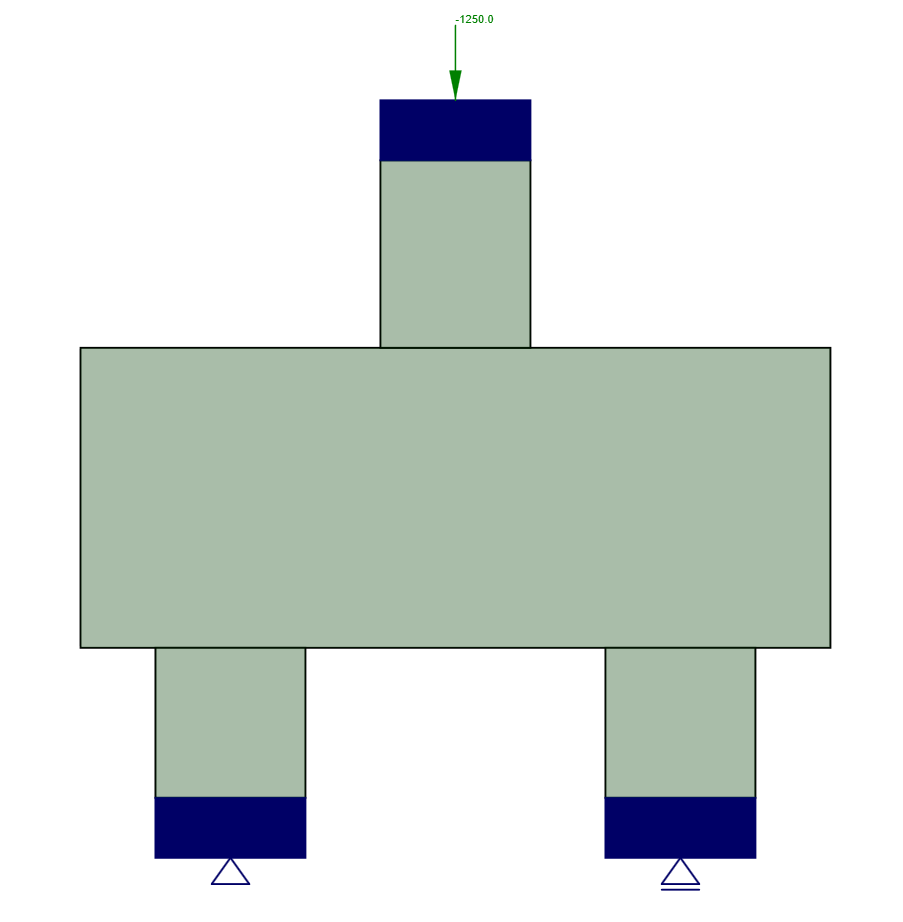
\[ \textsf{\textit{\footnotesize{Fig. 5\qquad Concentrated force on the top plate}}}\]
Adoucissement en compression
L'adoucissement en compression dans les structures en béton désigne une réduction de la résistance à la compression et de la rigidité du béton due à la présence de fissures ou de déformations de traction transversales, notamment dans les éléments en béton armé soumis à des contraintes combinées.
Qu'est-ce que l'adoucissement en compression ?
L'adoucissement en compression est un phénomène de dégradation mécanique dans lequel :
- Le béton soumis à la compression présente une capacité réduite lorsqu'il est simultanément fissuré en traction ou soumis à des déformations de cisaillement.
- Ce phénomène est particulièrement observé dans le béton fissuré soumis à la compression, comme dans les voiles de cisaillement, les bielles comprimées ou les éléments d'âme des poutres.
Pourquoi ce phénomène se produit-il ?
Le béton est un matériau fragile. Lorsque des fissures se forment (sous l'effet de la traction, de la flexion ou du cisaillement), la distribution des contraintes à l'intérieur du matériau change :
- Les fissures permettent une expansion latérale (déformation transversale) du béton.
- Sous compression, le béton fissuré ne peut pas résister aux charges aussi efficacement.
- Il en résulte une réduction de sa résistance à la compression apparente — d'où le terme adoucissement.
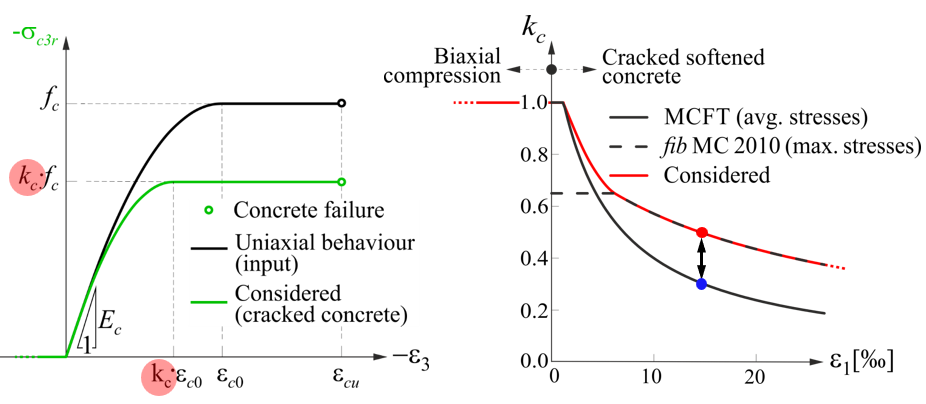
\[ \textsf{\textit{\footnotesize{Fig. 6\qquad Compression softening representation in 2D Detail}}}\]
Sensibilité au maillage
Cette analyse évalue comment les résultats d'une simulation numérique varient en fonction de la taille du maillage. Elle permet de déterminer le maillage optimal qui équilibre précision et coût de calcul. Un maillage plus fin donne généralement des résultats plus précis, mais au prix d'un coût de calcul plus élevé. L'objectif est de s'assurer que les résultats sont indépendants de la taille du maillage, ce qui indique la stabilité numérique et la fiabilité du modèle.
Sur la base de ce qui précède, nous avons effectué des simulations avec différentes tailles de maillage afin de déterminer l'optimum en termes de précision. Deux séries d'analyses de sensibilité pour l'adoucissement en compression, activé et désactivé, ont été réalisées pour les modèles PC01REF et PC04IR. L'effet d'adoucissement en compression est codé en dur et pris en compte par défaut.
Le seuil expérimental révèle la charge maximale que nos éprouvettes peuvent supporter ! De manière significative, tous les modèles ont abouti à une rupture par cisaillement dans le corps de la semelle sur pieux, fournissant des informations précieuses !
PC01REF adoucissement en compression - activé
Lorsque l'adoucissement en compression est activé, l'écart entre le seuil expérimental et les différents multiplicateurs de maillage varie de 0 % à 18 %. Les meilleurs résultats sont obtenus avec un multiplicateur de maillage de 0,5, où l'on obtient une capacité portante qui correspond aux résultats expérimentaux. En revanche, l'utilisation du multiplicateur de maillage par défaut de 1 surestime légèrement la capacité portante du modèle numérique.
\[ \textsf{\textit{\footnotesize{Fig. 7\qquad Mesh sensitivity compression softening on}}}\]
PC01REF adoucissement en compression - désactivé
Lorsque l'adoucissement en compression est désactivé, l'écart entre le seuil expérimental et les différents multiplicateurs de maillage varie de 16 % à 42 %. Cet écart indique une erreur significative, qui reste du côté dangereux. Ces résultats sont essentiels pour le dimensionnement des semelles sur pieux planes.
Il a également été observé que les modèles avec adoucissement en compression activé présentent une ductilité améliorée dans la zone d'écrouissage. À l'inverse, les expériences ont révélé une rupture fragile due à l'absence de barres inclinées, ce qui constitue une préoccupation majeure à prendre en compte lors du processus de dimensionnement.
\[ \textsf{\textit{\footnotesize{Fig. 8\qquad Mesh sensitivity compression softening off}}}\]
PC04IR adoucissement en compression - activé
Lorsque l'adoucissement en compression est activé, l'écart entre le seuil expérimental et les différents multiplicateurs de maillage varie de 10 % à 18 %. Étant donné que toutes les courbes se situent en dessous du seuil expérimental, cela indique une marge de sécurité. Ces résultats concernent un modèle comportant une barre de cisaillement inclinée. Cette marge de sécurité contraste avec le modèle PC01REF. Les barres inclinées dans la zone d'adoucissement en compression renforcent la résistance du modèle et aboutissent à une marge de sécurité plus élevée pour les simulations utilisant le CSFM.
\[ \textsf{\textit{\footnotesize{Fig. 9\qquad Mesh sensitivity compression softening on}}}\]
PC04IR adoucissement en compression - désactivé
Lorsque l'adoucissement en compression est désactivé, l'écart entre le seuil expérimental et les différents multiplicateurs de maillage varie de 6 % à 11 %. Si les armatures de cisaillement inclinées traversent la zone adoucie, la capacité portante pour la quasi-totalité des multiplicateurs de maillage recommandés (0,5 et 1) dans la simulation finale se situe en dessous du seuil expérimental. Cela conduit à la conclusion que les modèles CSFM sans adoucissement en compression, lorsqu'ils utilisent des barres inclinées, restent sûrs et qu'une rupture prématurée ne se produira pas.
\[ \textsf{\textit{\footnotesize{Fig. 10\qquad Mesh sensitivity compression softening off}}}\]
ABAQUS - Plasticité avec endommagement du béton
Hypothèses
La plasticité avec endommagement du béton (ci-après CDP) est basée sur la condition de plasticité de Drucker-Prager [7]. Ce modèle est adapté aux matériaux à frottement interne, tels que les sols ou le béton. La résistance à la traction est nettement inférieure à la résistance à la compression et la partie hydrostatique du tenseur des contraintes joue un rôle dans l'évolution de la surface de plasticité. Sous contrainte générale, la condition de plasticité présente la surface d'un cône rotatif. Le modèle de matériau pour les contraintes de compression et de traction prend également en compte le comportement post-critique, qui est contrôlé par les paramètres d'endommagement, prenant des valeurs de zéro (non endommagé) à un (pour une rigidité quasi nulle du béton en compression ou en traction dans la condition post-critique). Plus le paramètre d'endommagement est élevé, plus l'élément est dégradé et ne contribue pas à la rigidité.
Le modèle est un modèle d'endommagement continu basé sur la plasticité pour le béton, prenant en compte la fissuration en traction et l'écrasement en compression. Il utilise deux variables d'écrouissage — les déformations plastiques équivalentes en traction et en compression — pour contrôler la surface de rupture. Le béton présente un comportement élastique jusqu'à la contrainte de pic, suivi d'un adoucissement dû à la microfissuration en traction et à l'écrasement en compression.
Modèles de matériaux
Le modèle de Thorenfeldt (plus précisément, le modèle de Thorenfeldt–Tomaszewicz–Jensen)[8] est un modèle empirique largement utilisé pour décrire le comportement contrainte-déformation non linéaire en compression du béton, notamment dans les modèles d'endommagement du béton en analyse par éléments finis (AEF). Ce modèle est sélectionné comme modèle constitutif pour la plasticité avec endommagement du béton dans notre cas. La loi uniaxiale en compression reproduit la tendance du diagramme parabole-rectangle pour le béton selon EN 1992-1-1 [5] jusqu'à la valeur de pic. Le comportement post-critique, aussi bien en compression qu'en traction, est basé sur Thorenfeldt.
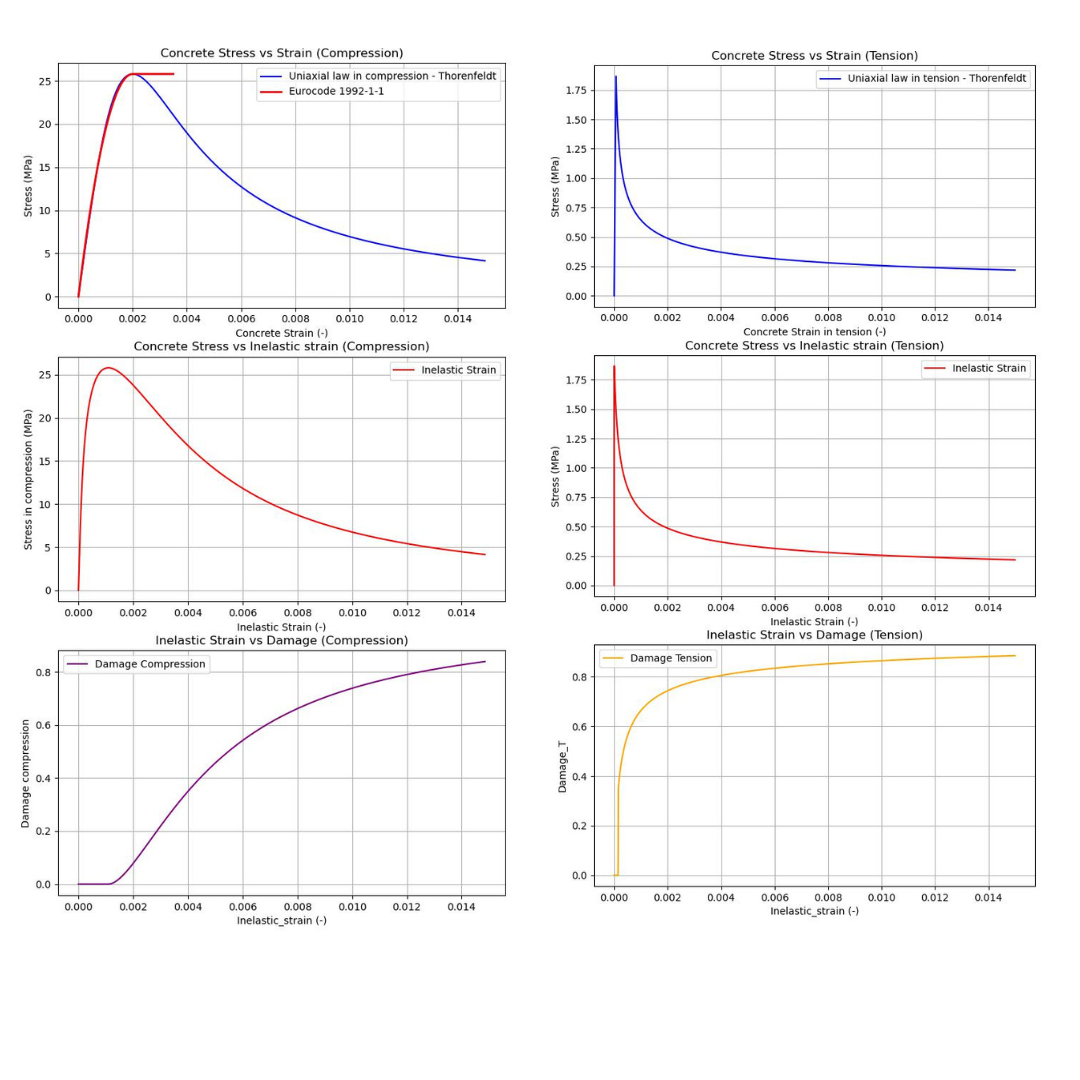
\[ \textsf{\textit{\footnotesize{Fig. 11\qquad Concrete Damage Model in compression/tension + damage }}}\]
Le modèle de matériau bilinéaire avec écrouissage isotrope pour les barres de ferraillage a été sélectionné. Les propriétés matérielles de chaque diamètre de barre sont différentes.
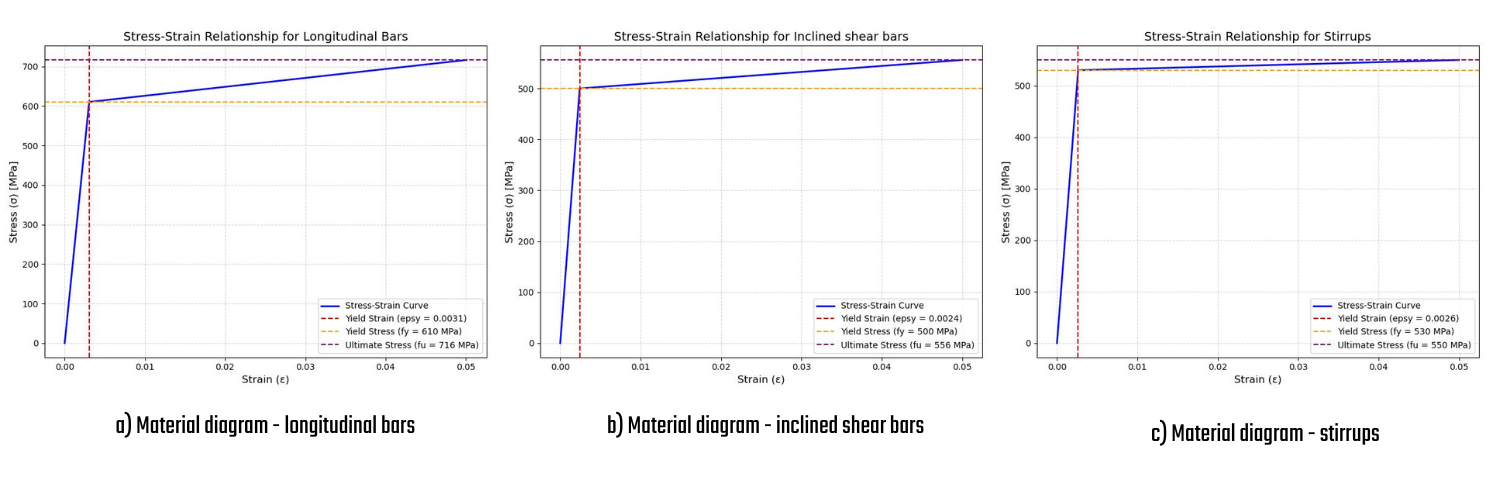
\[ \textsf{\textit{\footnotesize{Fig. 12\qquad Bilinear diagram with hardening for reinforcement }}}\]
Éléments EF
L'élément C3D8, ou hexaèdre avec une fonction de base linéaire et un point d'intégration, a été utilisé pour le modèle EF du béton. Le ferraillage comprend des éléments T3D2 qui ne transmettent que des effets axiaux. L'interaction entre les éléments de ferraillage et de béton assure des contraintes intégrées dans la bibliothèque ABAQUS, appelées « Embedded feature ».
La technique des éléments encastrés est utilisée pour spécifier qu'un élément ou un groupe d'éléments est encastré dans des éléments « hôtes ». Cette technique peut être utilisée pour modéliser le ferraillage. ABAQUS recherche les relations géométriques entre les nœuds des éléments encastrés et les éléments hôtes. Si un nœud d'un élément encastré se trouve à l'intérieur d'un élément hôte, les degrés de liberté en translation à ce nœud sont éliminés et le nœud devient un « nœud encastré ». Les degrés de liberté en translation du nœud encastré sont contraints aux valeurs interpolées des degrés de liberté correspondants de l'élément hôte.
Les équations de couplage cinématique ont été utilisées pour l'application des conditions aux limites et l'application des charges. Des précisions supplémentaires sont fournies ci-dessous.
Description du modèle
Le poteau, le corps et les pieux sont protégés par des plaques d'acier rigides afin d'assurer une distribution uniforme des contraintes sur toute la surface supérieure du poteau, où la charge est appliquée, ainsi que sur les surfaces inférieures des pieux où les conditions aux limites sont rencontrées. La charge est transmise via la contrainte de couplage cinématique à l'élément rigide et la charge de déformation est appliquée au point de référence (RP1). Les points de référence RP2 et RP3 comprennent les conditions aux limites (CL).
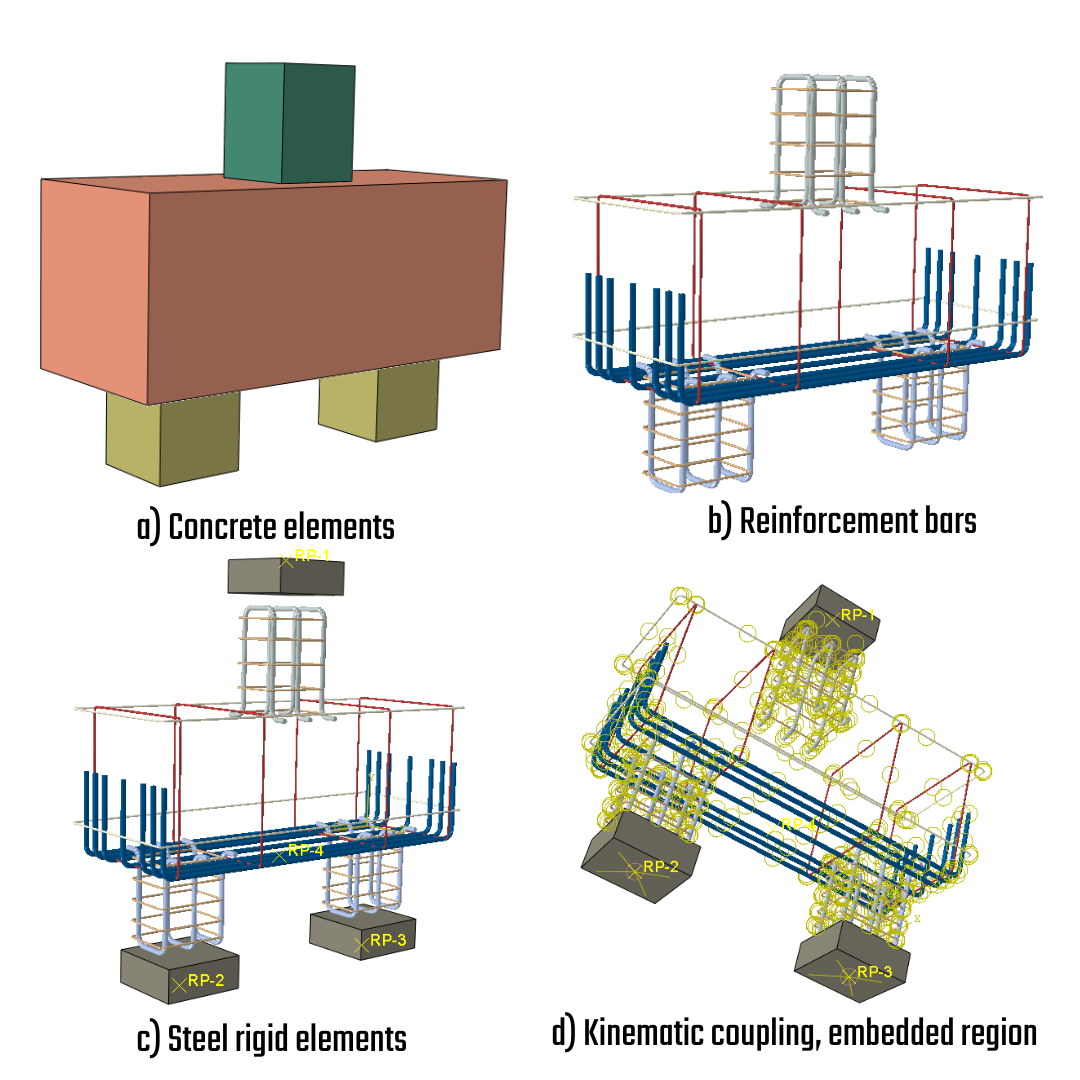
\[ \textsf{\textit{\footnotesize{Fig. 13\qquad Model description ABAQUS }}}\]
Charges et conditions aux limites
Comme mentionné ci-dessus, une charge de déformation a été utilisée pour atteindre l'état de contrainte post-critique. La valeur a été de -3 mm dans le repère global Y. Les CL pour RP2 bloquent tous les degrés de liberté en translation et un degré de liberté en rotation. RP3 bloque deux degrés de liberté en translation pour créer un système simplement articulé-appuyé qui sera stable dans l'espace.
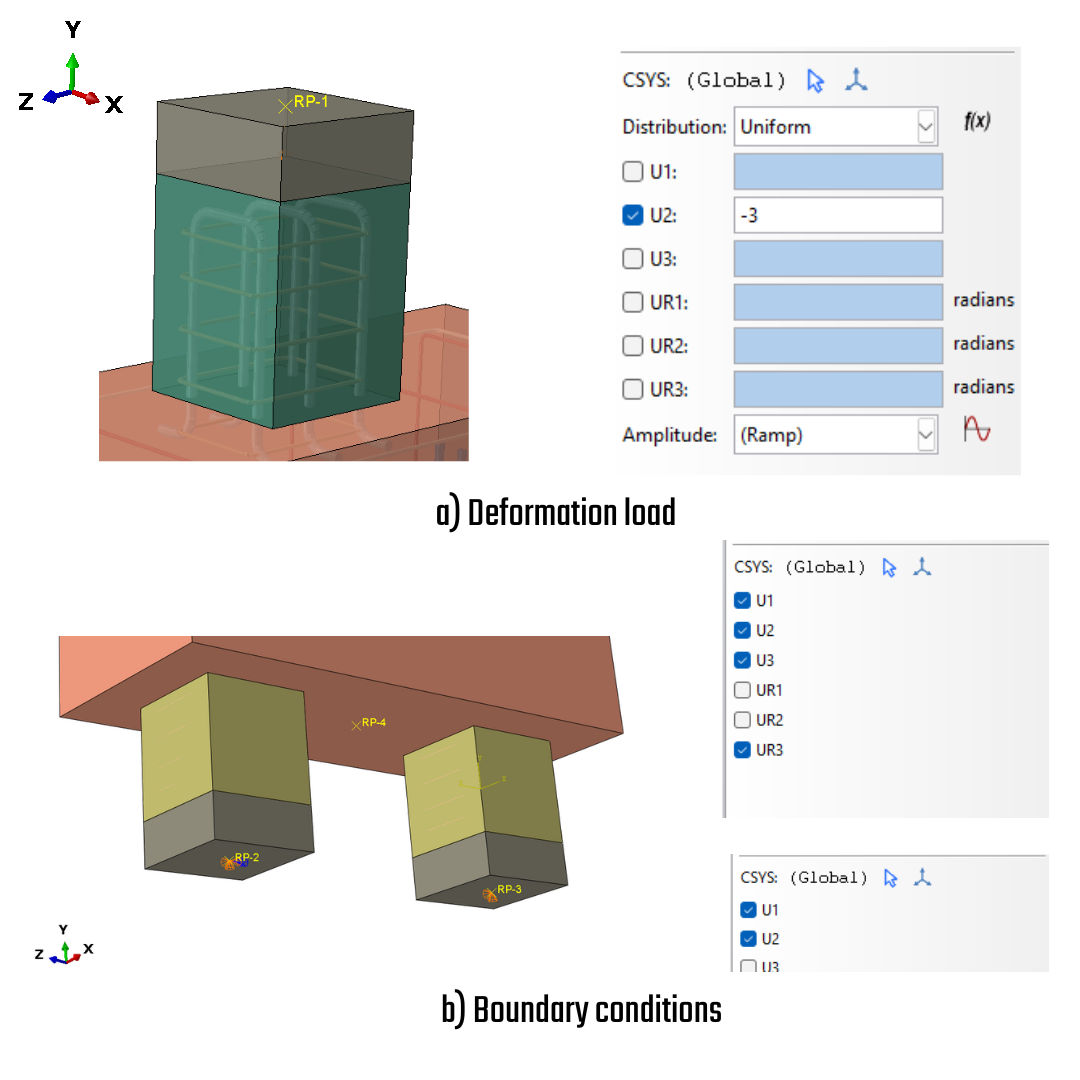
\[ \textsf{\textit{\footnotesize{Fig. 14\qquad Loads and boundary conditions }}}\]
Maillage
Suite à une étude de sensibilité au maillage, deux tailles de maillage [25, 50] mm ont été définies. Le maillage a été appliqué au béton et de manière identique aux barres de ferraillage, à l'exception d'un raffinement dans la zone où le rayon de courbure a été construit.
\[ \textsf{\textit{\footnotesize{Fig. 15\qquad Mesh }}}\]
Sensibilité au maillage ABAQUS
La sensibilité au maillage évalue comment les résultats de simulation varient avec le raffinement du maillage en analyse par éléments finis. Elle garantit la précision en identifiant le moment où un raffinement supplémentaire du maillage n'affecte plus significativement les résultats, en équilibrant précision et efficacité de calcul. Les résultats actuels pour les maillages [50, 25] mm montrent que le maillage grossier surestime le seuil expérimental d'environ 3 %, tandis que le maillage raffiné de 25 mm reste du côté sécuritaire et indique une capacité portante plus faible. Le maillage de 25 mm a été sélectionné pour les analyses et vérifications ultérieures.
\[ \textsf{\textit{\footnotesize{Fig. 16\qquad Mesh sensitivity for the model PC01-REF }}}\]
Résultats
Dans cette section, nous allons explorer les résultats des calculs analytiques, des solutions numériques utilisant les modèles CSFM et CDP, ainsi que des essais expérimentaux.
Résultats expérimentaux
La validation expérimentale a été conduite à l'aide du modèle PC01REF, qui a résisté à une force transmise maximale de 978 kN. Le mode de rupture observé était le cisaillement, caractérisé par deux fissures dominantes qui ont amorcé sur la surface inférieure du corps de la semelle sur pieux. La première fissure a été identifiée comme une fissure de flexion avec un effet consécutif d'une fissure de cisaillement se déclenchant près du bord du pieu.
Dans le second modèle, PC04IR, des barres d'inclinaison ont été incluses, ce qui a amélioré la capacité portante. Dans ce modèle, les fissures primaires présentaient un schéma dispersé sur le corps de la semelle sur pieux. Cela conduit au constat que le modèle disposait d'une disposition de ferraillage plus appropriée et d'un taux de ferraillage plus élevé.
\[ \textsf{\textit{\footnotesize{Fig. 17\qquad Bearing capacity and crack propagation from the testing setup }}}\]
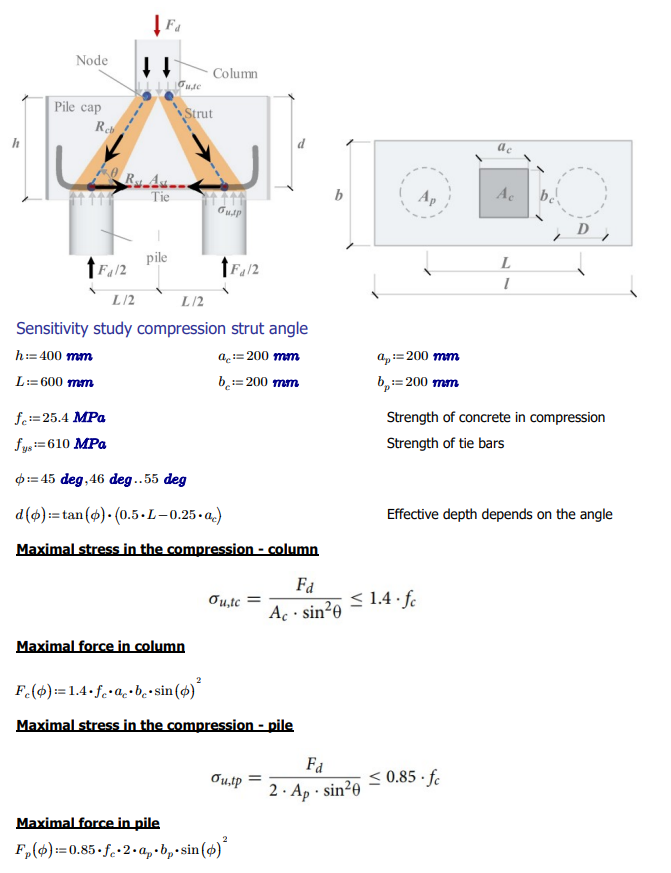
Bielle-et-tirant - solution analytique
Dans la présente étude, les semelles sur pieux ont été dimensionnées à l'aide de la méthode Bielle-et-tirant (STM), le modèle de calcul le plus répandu pour le dimensionnement des semelles sur pieux rigides. Ce dimensionnement est basé sur les travaux expérimentaux précédemment développés par Blévot et Frémy [4]. Le modèle consiste à concevoir un treillis spatial à l'intérieur d'une semelle sur pieux à l'aide de barres en traction et en compression reliées par des nœuds, comme illustré à la figure 17. Le calcul garantit que les barres de ferraillage en traction (tirants) n'atteindront pas la limite d'élasticité en raison de la redondance du nombre de barres. Le mode de rupture pour le modèle Bielle&Tirant se produira dans le béton sur la base du calcul et du dimensionnement des armatures.
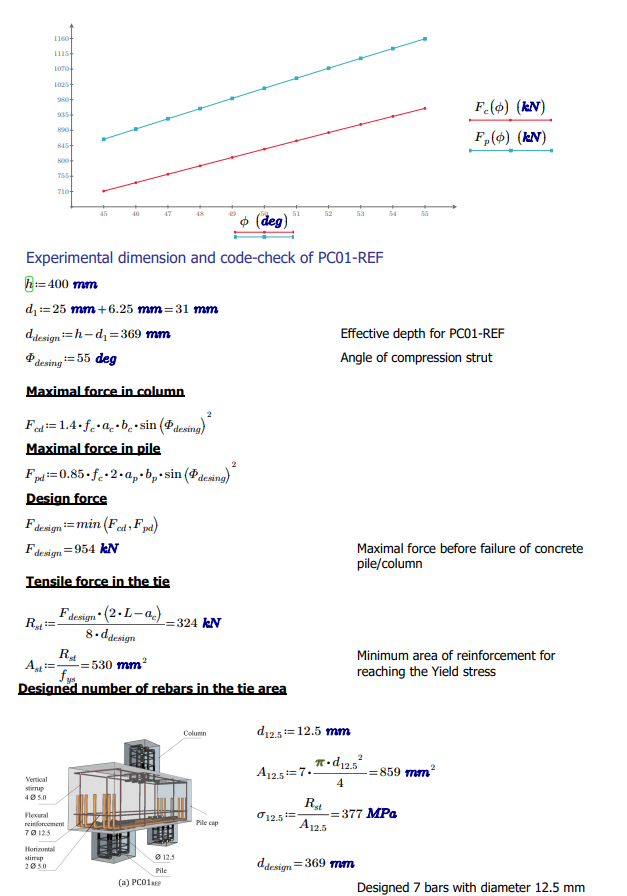
\[ \textsf{\textit{\footnotesize{Fig. 18\qquad Strut and Tie }}}\]
Résultats IDEA StatiCa 2D Detail
La force ultime résultante pour tous les modèles est résumée dans le tableau ci-dessous.
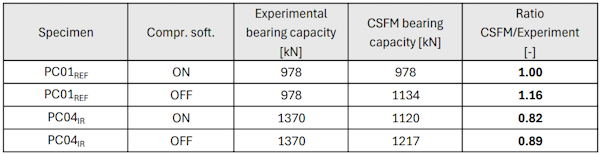
\[ \textsf{\textit{\footnotesize{Fig. 19\qquad CSFM/Experiment utilization }}}\]
Dans tous les cas, le calcul s'arrête en raison d'une rupture du béton au nœud supérieur de la bielle comprimée. Dans les chapitres suivants, nous examinons plus en détail les modèles individuels.
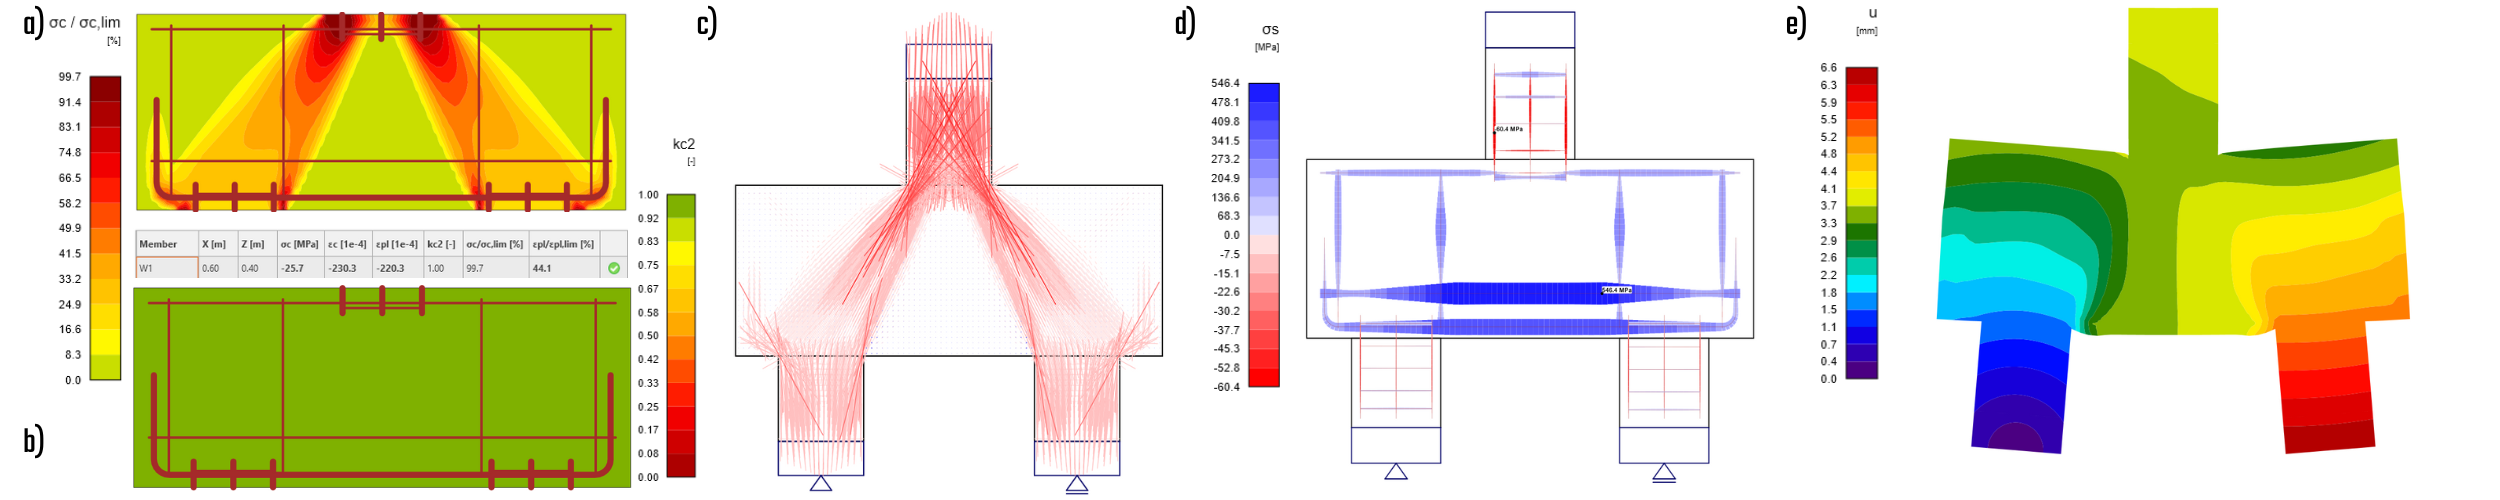
Modèle PC01REF avec adoucissement en compression
La force ultime développée pour ce modèle était de 978 kN.
Les contraintes de compression dans le poteau et les pieux peuvent être négligées — un matériau avec une résistance à la compression augmentée a été défini pour ces éléments afin de tenir compte de la triaxialité. À l'intérieur de la semelle sur pieux, les bielles comprimées sont bien visibles. On observe une concentration de contraintes principales sous le poteau, avec la valeur maximale située au nœud d'angle. Dans la zone au-dessus des pieux, les contraintes sont réparties de manière plus uniforme.
Le calcul non linéaire s'arrête en raison d'une rupture du béton au nœud supérieur de la bielle comprimée, ce qui correspond bien aux attentes issues du calcul par la méthode Bielle-et-tirant. La contrainte maximale dans le ferraillage se trouve dans l'étrier horizontal Ø5 mm. La contrainte dans le ferraillage principal en traction est d'environ 342 MPa, ce qui correspond également bien aux attentes. Cette valeur est loin de la limite d'élasticité du ferraillage.
Le facteur d'adoucissement en compression s'applique sur toute la longueur de la bielle avec la valeur extrême à la base de la semelle sur pieux.
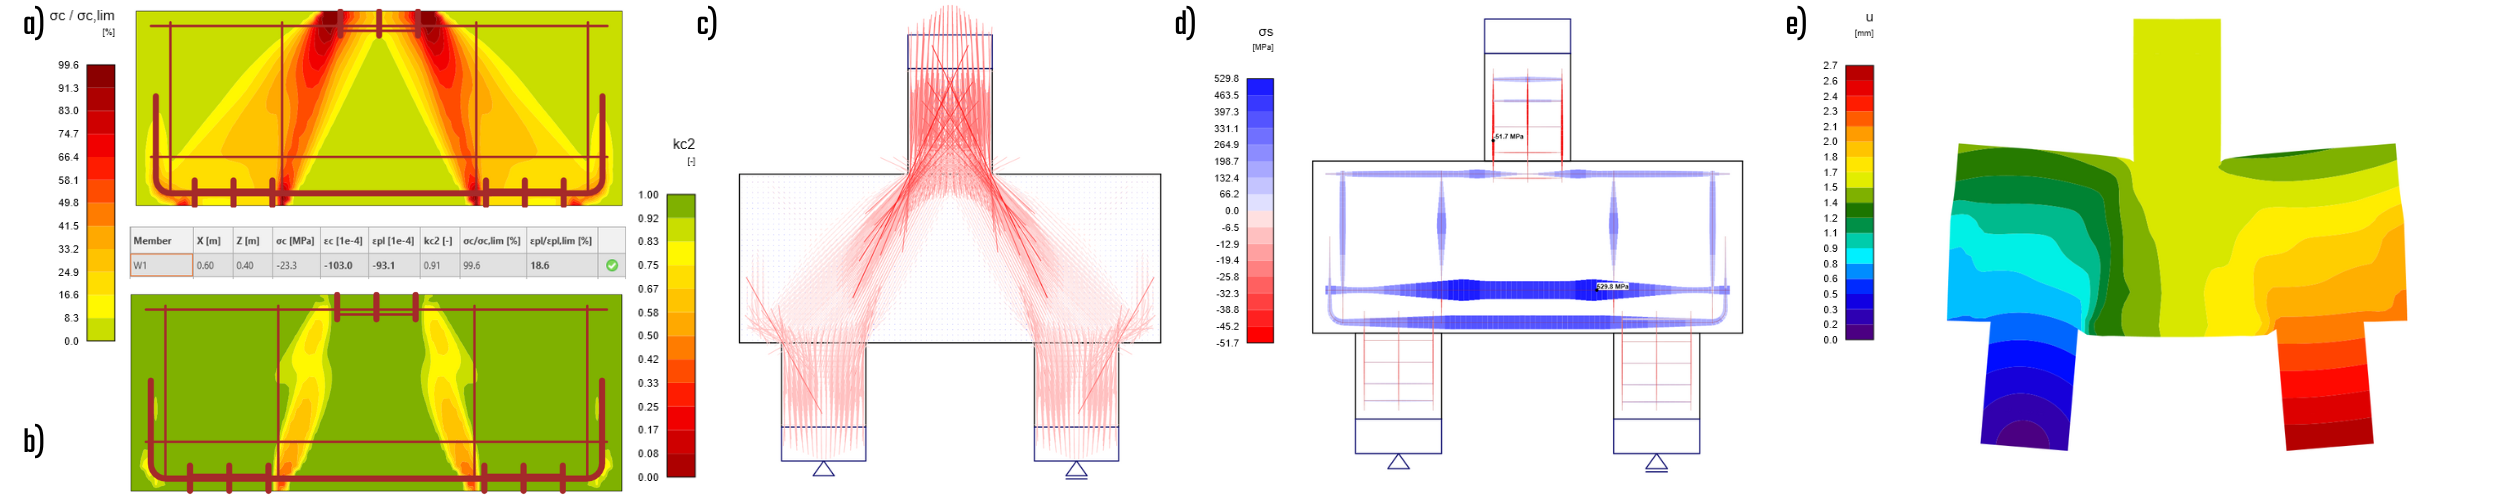
\[ \textsf{\textit{\footnotesize{Fig. 20\qquad a) concrete utilization, b) compression softening, c) directions of main stresses, d) stress in reinforcement, e) total deformation }}}\]
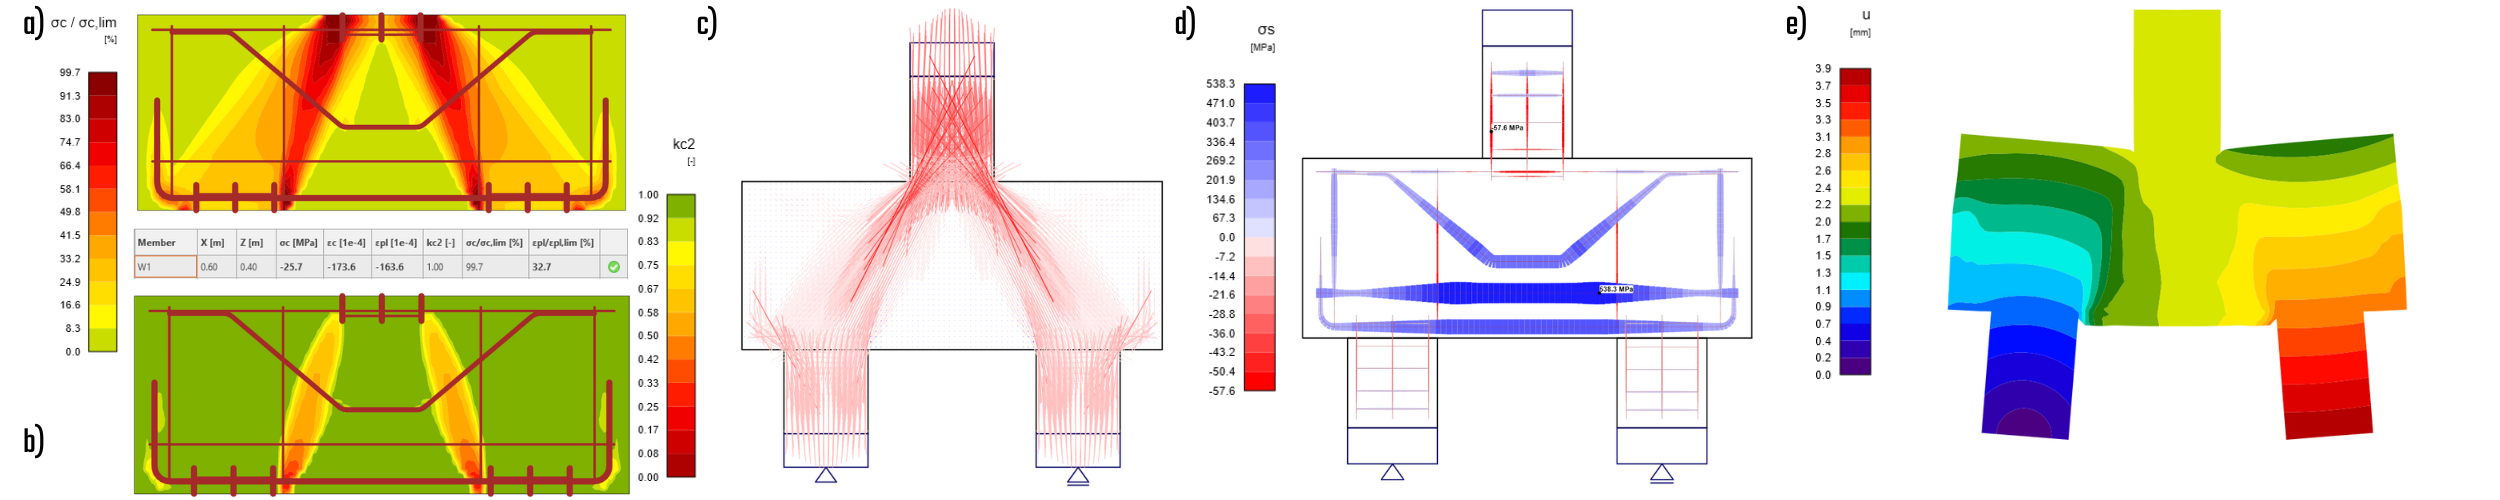
Modèle PC01REF sans adoucissement en compression
La force ultime pour ce modèle était de 1134 kN, soit environ 16 % supérieure à celle du modèle avec adoucissement en compression activé. Bien que les schémas de distribution des contraintes soient similaires, les valeurs atteintes sont nettement plus élevées. La contrainte de traction dans les barres de ferraillage principales atteint environ 390 MPa, et une fois encore, la rupture était due à la dégradation du béton.
Lorsque l'adoucissement en compression est désactivé, le coefficient \( k_{c2} \) est clairement égal à 1,0. Dans ce cas, le modèle présente un comportement nettement plus souple, avec une déformation totale maximale dépassant le double de la valeur attendue. L'absence d'adoucissement en compression conduit à une surestimation du seuil expérimental, plaçant le modèle du côté dangereux, ce qui est inacceptable pour les applications en ingénierie structurelle.
\[ \textsf{\textit{\footnotesize{Fig. 21\qquad a) concrete utilization, b) compression softening, c) directions of main stresses, d) stress in reinforcement, e) total deformation }}}\]
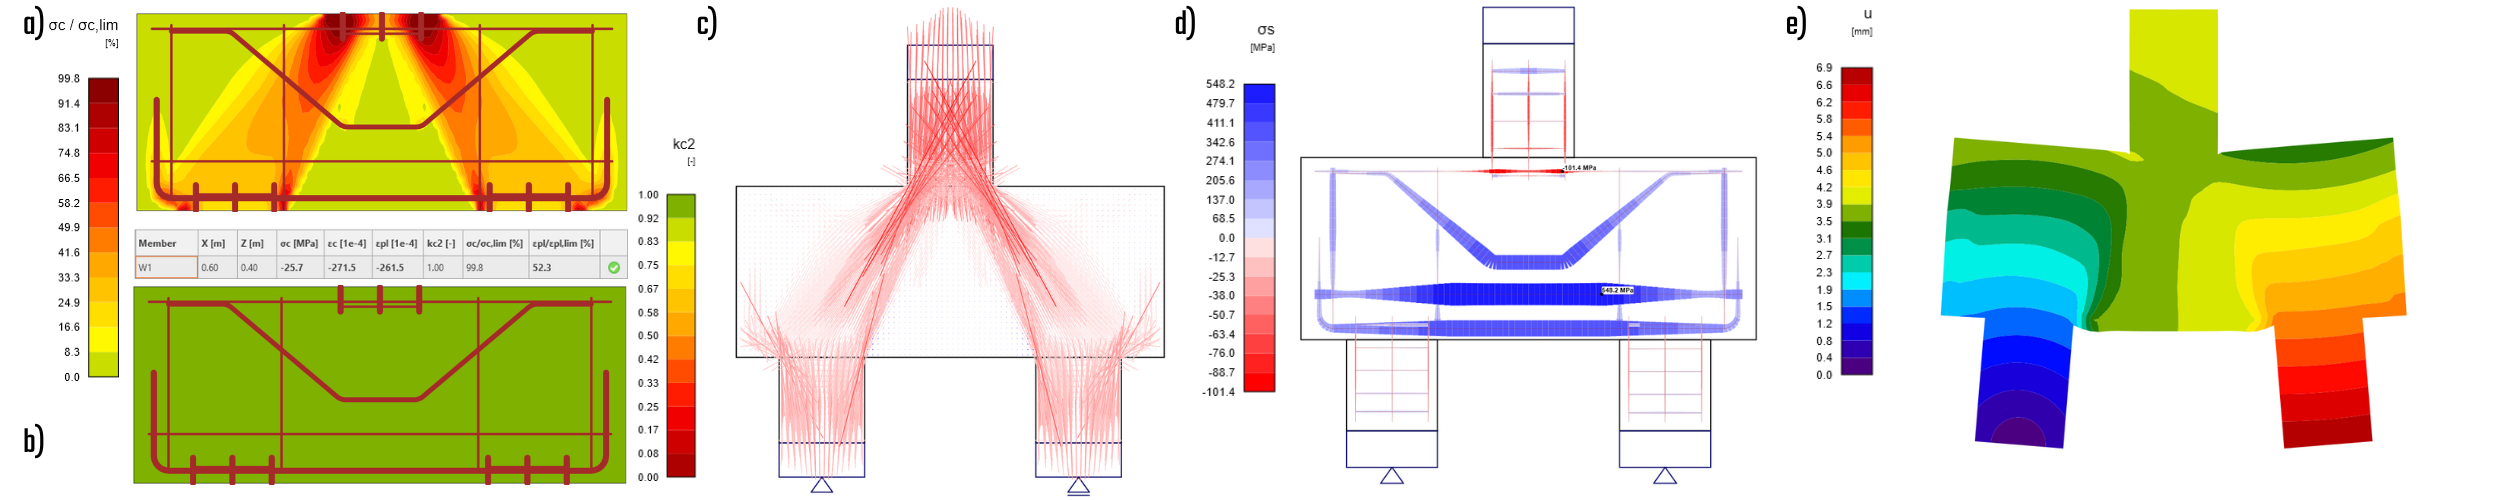
Modèle PC04IR avec adoucissement en compression
La force ultime pour ce modèle était de 1120 kN, soit environ 15 % de plus que la force observée sans le ferraillage de cisaillement incliné. On peut noter que, bien que le ferraillage incliné n'atteigne pas son taux de travail maximal, il joue un rôle significatif dans l'élargissement de la bielle comprimée et dans la distribution de la compression sous le poteau sur une surface plus grande.
L'illustration suivante montre l'impact du ferraillage incliné supplémentaire sur le coefficient d'adoucissement en compression. Avec le ferraillage supplémentaire, le modèle atteint une déformation totale plus élevée, avec une différence d'environ 1 mm.
\[ \textsf{\textit{\footnotesize{Fig. 22\qquad a) concrete utilization, b) compression softening, c) directions of main stresses, d) stress in reinforcement, e) total deformation }}}\]
Modèle PC04IR sans adoucissement en compression
La force ultime pour ce modèle était de 1217 kN, soit environ 9 % supérieure à celle du modèle avec adoucissement en compression activé. On peut observer que l'influence de l'adoucissement en compression est plus faible que sans le ferraillage supplémentaire (où elle était de 16 %).
\[ \textsf{\textit{\footnotesize{Fig. 23\qquad a) concrete utilization, b) compression softening, c) directions of main stresses, d) stress in reinforcement, e) total deformation }}}\]
Résultats ABAQUS
La comparaison des capacités portantes des deux dispositifs expérimentaux. La simulation CDP démontre une concordance entre [83-96] % des résultats expérimentaux.
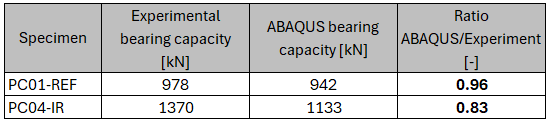
\[ \textsf{\textit{\footnotesize{Fig. 24\qquad Bearing capacity of experiment/numerical model }}}\]
Modèle PC01REF
Les résultats sont issus d'une analyse non linéaire matérielle et géométrique. La contrainte principale minimale, Sigma 3, atteint sa valeur extrême au point où le poteau se raccorde au corps de la semelle sur pieux. L'effet de confinement dans le poteau permet une augmentation de la contrainte jusqu'à -50 MPa. La déformation indique que le poteau est poinçonné dans le corps de la semelle sur pieux, et conjointement avec les pieux, cela crée une zone de flux de cisaillement élevé.
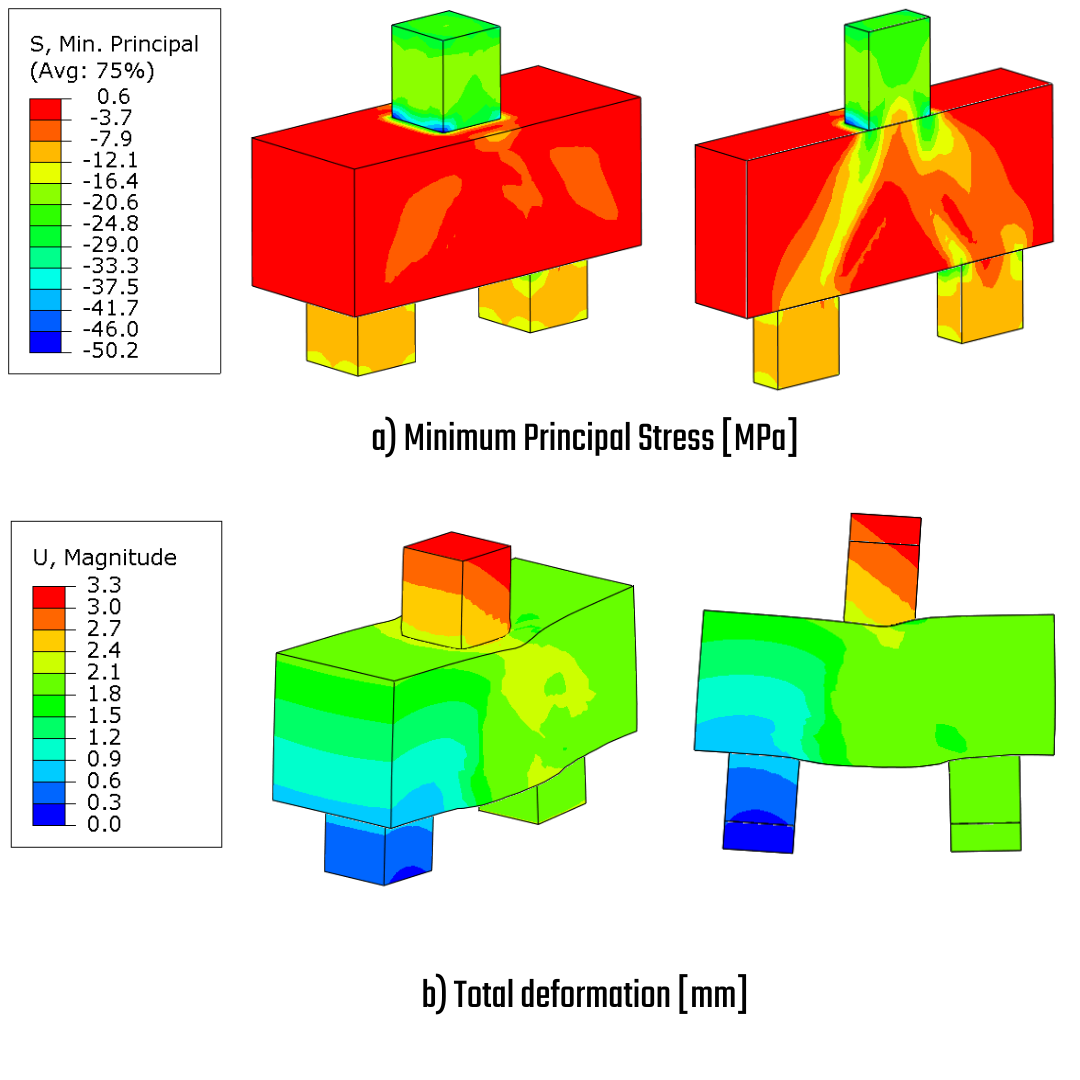
\[ \textsf{\textit{\footnotesize{Fig. 25\qquad Minimum principal stress, Total deformation}}}\]
Le modèle inclut le diagramme de matériau en traction et l'effet de l'adoucissement en traction, représenté par le paramètre d'endommagement. Ce paramètre est mis à l'échelle dans la plage [0-1], où une valeur de 1 indique une perte totale de rigidité en traction, entraînant l'exclusion des éléments de la simulation. Comme illustré à la Fig. 17, un endommagement extrême se produit dans la zone où la fissure a été observée lors de l'expérience. De plus, la contrainte sur les barres de ferraillage est particulièrement élevée dans les étriers horizontaux, qui renforcent la zone de traction principale. La solution numérique confirme le calcul analytique de la Fig. 17 et apporte la preuve que le mode de rupture ne se situe pas au niveau des armatures. Les sept barres de tirant inférieures subissent une contrainte d'au plus 380 MPa.
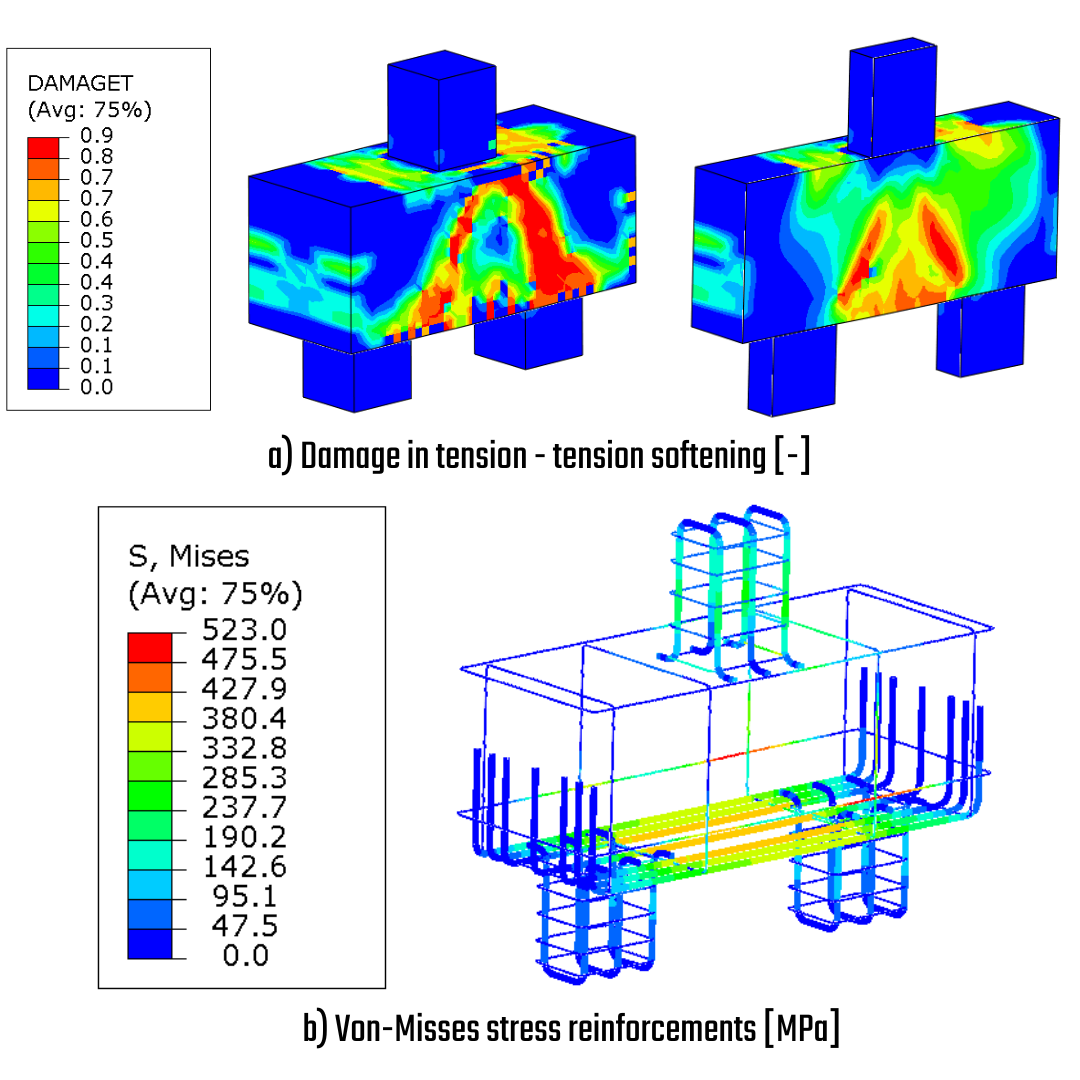
\[ \textsf{\textit{\footnotesize{Fig. 26\qquad Tension softening, Stress on reinforcement bars}}}\]
Le mode de rupture s'est produit en raison d'un effort de cisaillement excessif, qui conduit à l'adoucissement en compression et à l'endommagement dans la zone du flux de cisaillement le plus élevé. Le mode de rupture correspond à l'essai expérimental réel.
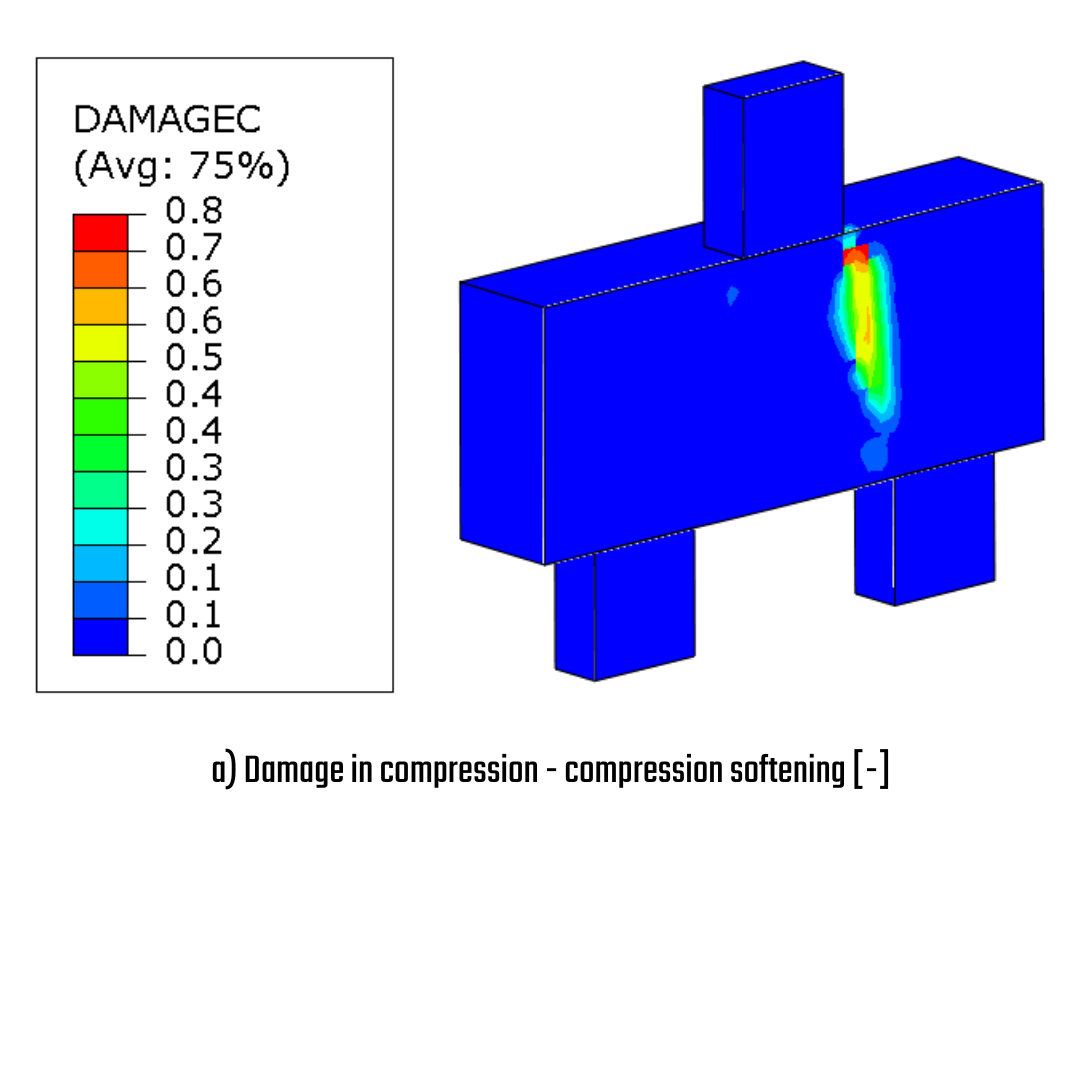
\[ \textsf{\textit{\footnotesize{Fig. 27\qquad Compression softening and failure mode indication}}}\]
Modèle PC04IR
Le modèle PC04IR avec une conception inclinée présente la même contrainte principale minimale que le modèle mentionné précédemment. La carte des contraintes montre des niveaux de contrainte plus élevés dans le corps de la semelle sur pieux en raison de l'intensité de charge plus importante par rapport au modèle PC01IR. La déformation totale observée est de 3 mm au sommet du poteau. Cette déformation maximale résulte de l'encastrement progressif du poteau dans le corps de la semelle sur pieux.
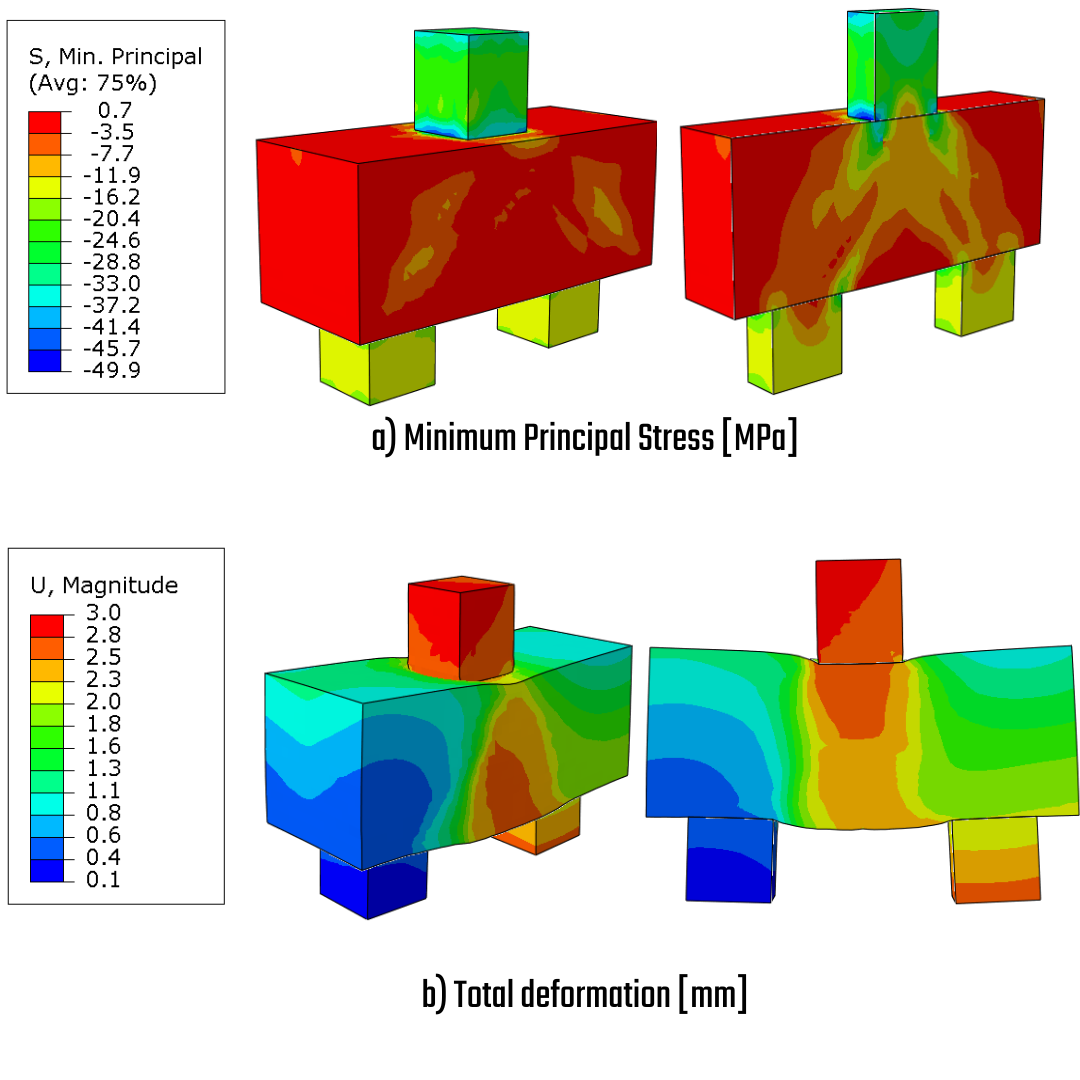
\[ \textsf{\textit{\footnotesize{Fig. 28\qquad Minimum principal stress, Total deformation}}}\]
La contrainte maximale de 530 MPa dans l'étrier horizontal indique le début de la plasticité. Cependant, il est important de noter que les barres de tirant principales, de diamètres 12,5 mm et 10 mm, n'ont pas encore atteint leur plateau de plasticité. Comme observé, les barres inclinées ont contribué au renforcement de la zone en améliorant significativement l'adoucissement en traction et la capacité portante globale.
\[ \textsf{\textit{\footnotesize{Fig. 29\qquad Tension softening, Stress on reinforcement bars}}}\]
En raison des conditions aux limites, l'adoucissement en compression est asymétrique. La zone critique reste du côté de la condition aux limites fixée horizontalement. L'autre côté présente un adoucissement plus faible en raison de la relaxation des contraintes causée par le mouvement horizontal et la possibilité de déformation libre.
\[ \textsf{\textit{\footnotesize{Fig. 30\qquad Compression softening and failure mode indication}}}\]
Conclusion
Cette étude présente une comparaison exhaustive des résultats expérimentaux, des calculs analytiques utilisant la méthode Bielle-et-tirant (STM) et des simulations numériques conduites avec IDEA StatiCa et ABAQUS pour évaluer le comportement structurel des semelles sur pieux planes en béton armé.
Expérimentalement, l'éprouvette PC01REF a présenté une rupture par cisaillement à une charge de 978 kN. En revanche, l'incorporation de ferraillage incliné dans le modèle PC04IR a amélioré la capacité portante à 1370 kN tout en favorisant des schémas de fissuration plus uniformes. La méthode STM a prédit des mécanismes de rupture comparables, validant ainsi l'efficacité du ferraillage sans atteindre la plastification ni les modes de rupture dans la bielle comprimée.
L'analyse par la Méthode du Champ de Contraintes Compatible (CSFM) a révélé que la désactivation de l'adoucissement en compression a entraîné une augmentation de 16 % de la force ultime pour l'éprouvette PC01REF, qui présentait un faible taux de ferraillage de cisaillement. Le modèle PC04IR, qui tenait compte du ferraillage incliné, a indiqué que l'adoucissement en compression désactivé a entraîné une capacité portante inférieure d'environ 11 % par rapport aux résultats expérimentaux. Cette observation conduit à la conclusion qu'un ferraillage de cisaillement approprié et un renforcement dans les zones où l'adoucissement en compression est prédominant peuvent atténuer les effets de ce phénomène.
À l'inverse, une fois l'adoucissement en compression activé, le modèle PC01REF s'aligne parfaitement avec les données expérimentales, tandis que le modèle PC04IR présente une réduction de 18 % de la capacité portante, soulignant la nécessité pour les ingénieurs structure de rester du côté conservateur du spectre de dimensionnement.
Par ailleurs, les simulations ABAQUS ont corroboré les résultats expérimentaux avec une plage de précision de 83 % à 96 % pour les modèles PC04IR et PC01REF, mettant en évidence les zones de rupture associées à l'adoucissement en traction et confirmant les régions de flux de cisaillement élevé. Le modèle PC04IR a présenté une distribution des contraintes supérieure et une capacité de déformation améliorée.
Graphique - PC01REF
\[ \textsf{\textit{\footnotesize{Fig. 31\qquad Graph PC01 REF}}}\]
\[ \textsf{\textit{\footnotesize{Fig. 32\qquad Graph PC04 IR}}}\]
En conclusion, le ferraillage incliné améliore significativement la capacité portante et la distribution des contraintes. L'adoucissement en compression est essentiel pour prédire avec précision la rupture, et tous les modèles indiquent de manière cohérente la rupture du béton comme mode de rupture dominant.
Références
[1] Pile caps with inclined shear reinforcement and steel fibers, Aaron Nzambi, Lana Gomes, Cledinei Amanajás, Francisco Silva, Denio Oliveira, Scientific reports, 2022, https://www.nature.com/articles/s41598-022-14416-2
[2] IDEA StatiCa. (s.d.). Theoretical background for IDEA StatiCa Detail. Consulté le 30 mai 2024, sur https://www.ideastatica.com/support-center/theoretical-background-for-idea-statica-detail
[3] EN 1992-1-1 Eurocode 2 : Calcul des structures en béton — Partie 1 : Règles générales et règles pour les bâtiments. Comité Européen de Normalisation, 2002.
[4] Analysis of nodal stresses in Blévot and Frémy tests, R.G. Delalibera, J.C.G. Silva, J.S. Giongo, A.A.S. Silva, Holos ISSN 1807-1600, 2023
[5] Comité Européen de Normalisation (CEN). EN 1992-1-1:2004 : Eurocode 2 – Calcul des structures en béton – Partie 1-1 : Règles générales et règles pour les bâtiments. Décembre 2004. https://www.phd.eng.br/wp-content/uploads/2015/12/en.1992.1.1.2004.pdf.
[6] ABNT NBR 7480. Spécification : Acier pour le ferraillage des structures en béton (ABNT, 2007) (en portugais).
[7] ABAQUS, Inc. ABAQUS User Subroutines Reference Manual, Version 6.6. Washington University in St. Louis, 2006. https://classes.engineering.wustl.edu/2009/spring/mase5513/abaqus/docs/v6.6/books/usb/default.htm?startat=pt05ch18s05abm36.html.
[8] Massone, L. M. ; et al. Shear-Flexure Interaction for Structural Walls, 2006. ResearchGate. https://www.researchgate.net/publication/284079633_Shear-flexure_interaction_for_structural_walls (consulté le 01 jan. 2006).