Piastra di base per colonna – Colonna a sezione cava (EN)
Descrizione
Il metodo degli elementi finiti basato sui componenti (CBFEM) per la piastra di base di una colonna a sezione cava verificato con il metodo delle componenti (CM) è descritto di seguito. Una colonna compressa è progettata come sezione trasversale di almeno classe 3. Lo studio di sensibilità è preparato per la dimensione della colonna, le dimensioni della piastra di base, la classe del calcestruzzo e le dimensioni del blocco di calcestruzzo. Quattro componenti sono attivate: la flangia e l'anima della colonna a compressione, il calcestruzzo in compressione inclusa la malta di livellamento, il bullone di ancoraggio a trazione e le saldature. Questo studio è principalmente focalizzato su due componenti: il calcestruzzo in compressione inclusa la malta di livellamento e il bullone di ancoraggio a trazione.

Fig. 8.4.1 Punti significativi del diagramma di interazione multilineare di una sezione cava quadrata
Verifica della resistenza
Nel seguente esempio, la colonna a sezione cava quadrata SHS 150×16 è collegata al blocco di calcestruzzo con dimensioni in pianta a' = 750 mm, b' = 750 mm e altezza h = 800 mm in calcestruzzo di classe C20/25 tramite la piastra di base a = 350 mm, b = 350 mm, t = 20 mm in acciaio di classe S420. I bulloni di ancoraggio sono progettati 4 × M20, As = 245 mm2 con diametro della testa a = 60 mm in acciaio di classe 8.8 con offset in alto di 50 mm e a sinistra di −20 mm e con profondità di infissione di 300 mm. La malta di livellamento ha uno spessore di 30 mm.
I risultati della soluzione analitica sono presentati come diagramma di interazione con punti caratteristici. Una descrizione dettagliata dei punti −1, 0, 1, 2 e 3 è mostrata in Fig. 8.4.1; si veda (Wald, 1995) e (Wald et al. 2008), dove il punto −1 rappresenta la forza di trazione pura, il punto 0 il momento flettente puro, i punti da 1 a 3 la forza di compressione combinata con il momento flettente, e il punto 4 la forza di compressione pura.

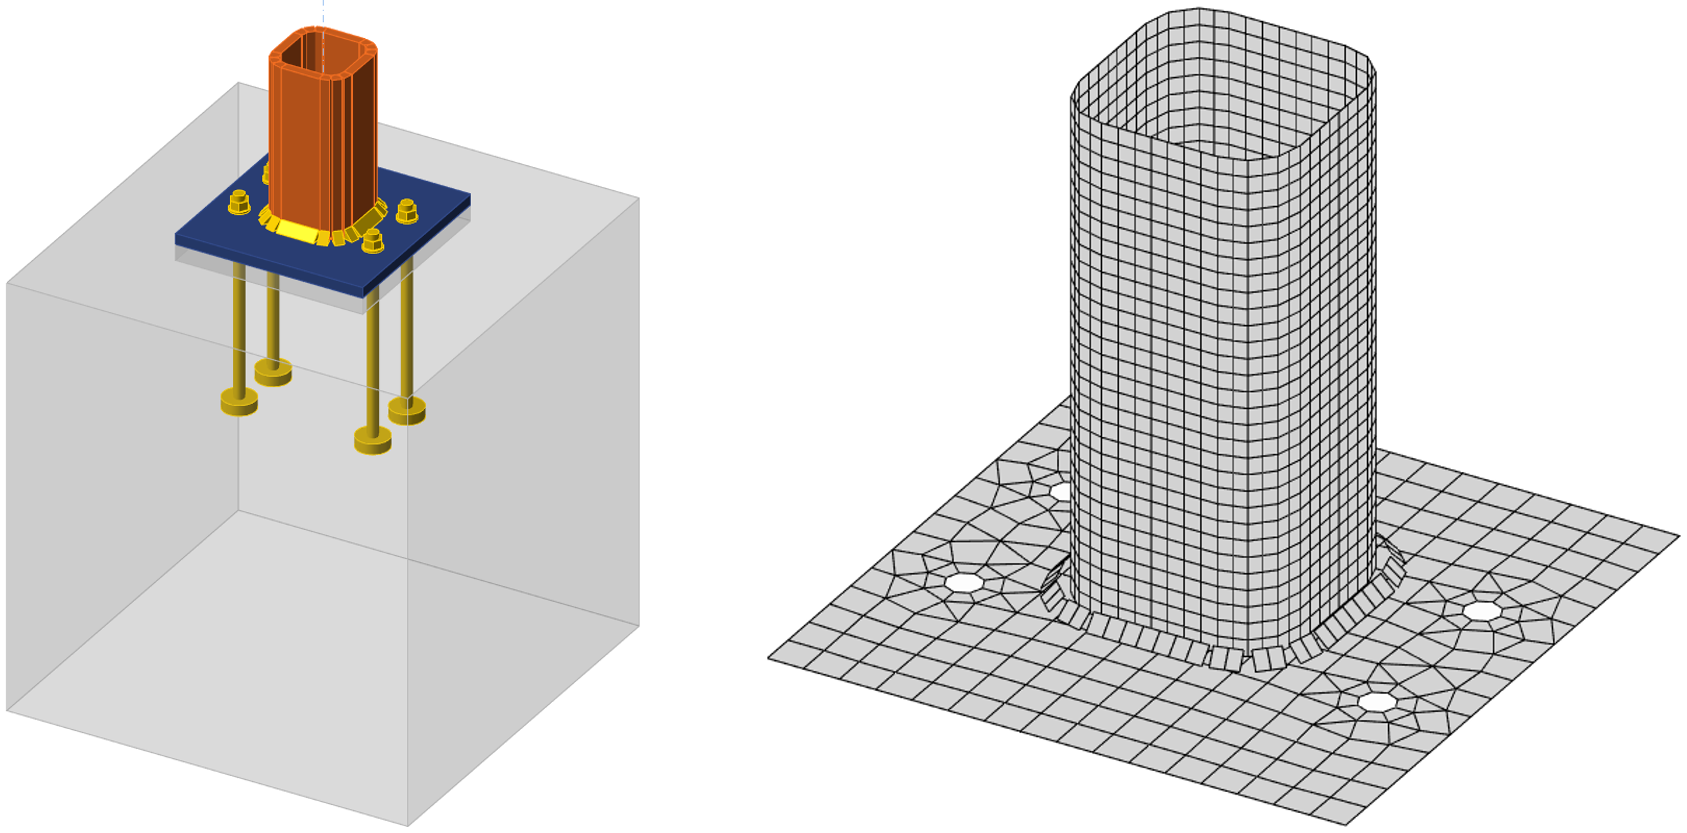
Fig.8.4.2 La piastra di base per la colonna SHS 150×16 e la rete selezionata della piastra di base
Nel CBFEM, le forze di leva si verificano nel caso di carico a trazione pura; mentre nel CM, non si sviluppano forze di leva limitando la resistenza al solo modo di rottura 1-2; si veda (Wald et al. 2008). A causa delle forze di leva, la differenza di resistenza è di circa il 10 %. Il modello numerico della piastra di base è mostrato in Fig. 8.4.2. I risultati del CBFEM sono presentati dalla distribuzione delle tensioni di contatto sul calcestruzzo per i punti 0 e 3, mostrati in Fig. 8.4.3 e Fig. 8.4.4, e confrontati sul diagramma di interazione in Fig. 8.4.5.

Fig. 8.4.3 Risultati CBFEM per il punto 0, ovvero momento flettente puro

Fig. 8.4.4 Risultati CBFEM per il punto 3, ovvero forza di compressione e momento flettente

Fig. 8.4.5 Confronto dei risultati della previsione della resistenza tramite CBFEM e CM sul diagramma di interazione per la piastra di base della colonna a sezione trasversale SHS 150×16
Studio di sensibilità
Lo studio di sensibilità è preparato per la dimensione della sezione trasversale della colonna, le dimensioni della piastra di base, la classe del calcestruzzo e le dimensioni del blocco di calcestruzzo. Le colonne selezionate sono SHS 150×16, SHS 160×12.5 e SHS 200×16. La piastra di base è progettata con dimensioni in pianta di 100 mm, 150 mm e 200 mm maggiori rispetto alla sezione trasversale della colonna. Lo spessore della piastra di base è di 10 mm, 20 mm e 30 mm. Il blocco di fondazione è in calcestruzzo di classe C20/25, C25/30, C30/37 e C35/45 con un'altezza di 800 mm per tutti i casi e con dimensioni in pianta di 100 mm, 200 mm, 300 mm e 500 mm maggiori rispetto alle dimensioni della piastra di base. Un parametro è stato variato mentre gli altri sono stati mantenuti costanti. I parametri sono riassunti nella Tab. 8.4.1. Sono state selezionate saldature d'angolo con spessore a = 12 mm. Il coefficiente di giunto per la malta di livellamento di qualità sufficiente è assunto come βj = 0,67. Le piastre in acciaio sono in S420 con bulloni di ancoraggio M20 classe 8.8 con profondità di infissione di 300 mm in tutti i casi.
Tabella 8.4.1 Parametri selezionati
| Sezione trasversale della colonna | SHS 150×16 | SHS 16×12,5 | SHS 200×16 |
| Offset piastra di base, mm | 100 | 150 | 200 |
| Spessore piastra di base, mm | 10 | 20 | 30 |
| Classe del calcestruzzo | C20/25 | C30/37 | C35/45 |
| Offset blocco di calcestruzzo, mm | 100 | 300 | 500 |
Per lo studio di sensibilità della sezione trasversale della colonna, sono stati utilizzati la classe del calcestruzzo C20/25, lo spessore della piastra di base di 20 mm, l'offset della piastra di base di 100 mm e l'offset del blocco di calcestruzzo di 200 mm per la variazione dei parametri della sezione della colonna. Il confronto del CBFEM con il modello analitico CM è mostrato nei diagrammi di interazione in Fig. 8.4.6.

Fig. 8.4.6 Confronto dei risultati CBFEM e CM per le diverse sezioni trasversali della colonna
Per lo studio di sensibilità dell'offset della piastra di base, sono stati selezionati la sezione trasversale della colonna SHS 200×16, la classe del calcestruzzo C25/30, lo spessore della piastra di base di 20 mm e l'offset del blocco di calcestruzzo di 200 mm. Il confronto dei diagrammi di interazione è in Fig. 8.4.7. La differenza più significativa è nella resistenza a trazione pura di una piastra di base di grandi dimensioni, dove significative forze di leva erano presenti nelle analisi CBFEM, che sono limitate dalla progettazione analitica.

Fig. 8.4.7 Confronto dei risultati CBFEM e CM per i diversi offset della piastra di base
Per lo studio di sensibilità dello spessore della piastra di base, sono stati selezionati la sezione trasversale della colonna SHS 200×16, la classe del calcestruzzo C25/30, l'offset della piastra di base di 100 mm e l'offset del blocco di calcestruzzo di 200 mm. In questo studio sono stati utilizzati spessori della piastra di base di 10 mm, 20 mm e 30 mm. Il confronto dei diagrammi di interazione è in Fig. 8.4.8. La differenza maggiore è nella resistenza a trazione pura di una piastra di base sottile, dove significative forze di leva erano presenti nelle analisi CBFEM, che sono limitate nella progettazione analitica dal CM.
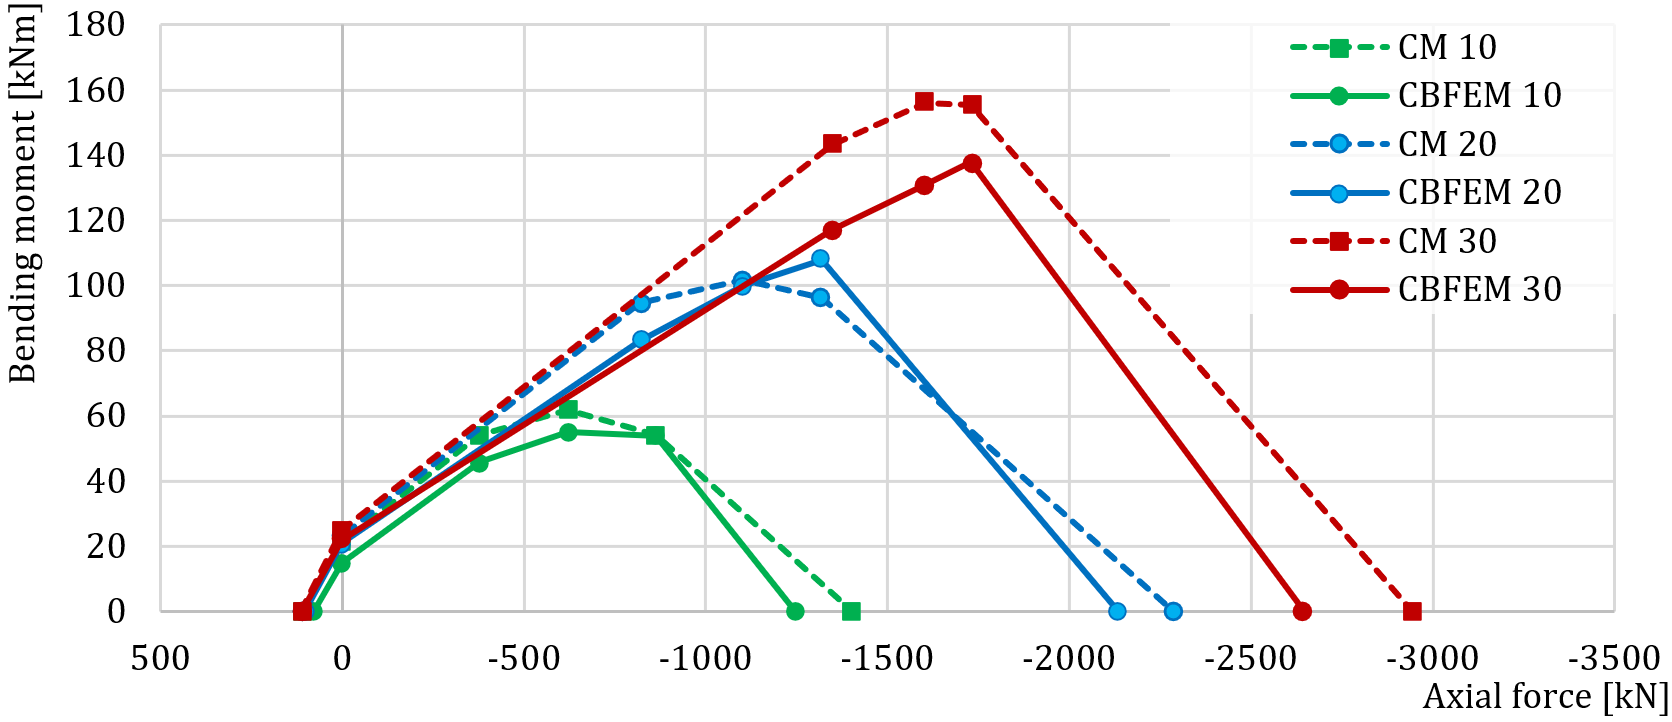
Fig. 8.4.8 Confronto dei risultati CBFEM e CM per i diversi spessori della piastra di base
Per lo studio di sensibilità della classe del calcestruzzo, sono stati selezionati la sezione trasversale della colonna SHS 150×16, lo spessore della piastra di base di 20 mm, l'offset della piastra di base di 100 mm e l'offset del blocco di calcestruzzo di 200 mm. In questo studio sono state utilizzate le classi di calcestruzzo C20/25, C30/37 e C35/45. Il confronto dei diagrammi di interazione è in Fig. 8.4.9.

Fig. 8.4.9 Confronto dei risultati CBFEM e CM per le diverse classi di calcestruzzo
Per lo studio di sensibilità dell'offset del blocco di calcestruzzo, sono stati selezionati la sezione trasversale della colonna SHS 160×12.5, lo spessore della piastra di base di 20 mm, l'offset della piastra di base di 100 mm e la classe del calcestruzzo C25/30. In questo studio sono stati utilizzati offset del blocco di calcestruzzo di 100 mm, 300 mm e 500 mm. Il confronto dei diagrammi di interazione è in Fig. 8.4.10.

Fig. 8.4.10 Confronto dei risultati CBFEM e CM per i diversi offset del blocco di calcestruzzo
Le differenze nella previsione della resistenza della piastra di base della colonna tramite CBFEM e CM sono principalmente nell'accettazione delle forze di leva nel CBFEM e nel loro evitamento nel CM secondo EN 1993-1-8:2005.
Tab. 8.4.2 Confronto del diagramma di interazione tra CBFEM e CM
| Differenza CBFEM/CM | Punto -1 | Punto 0 | Punto 1 | Punto 2 | Punto 3 | Punto 4 |
| Massimo % | 100% | 105% | 107% | 105% | 112% | 93% |
| Minimo % | 69% | 71% | 81% | 84% | 89% | 88% |
Caso di riferimento
Dati di input
Sezione trasversale della colonna
- SHS 150×16
- Acciaio S420
Piastra di base
- Spessore 20 mm
- Offset in alto 100 mm, a sinistra 100 mm
- Saldature – saldature di testa
- Acciaio S420
Ancoraggi
- M20 8.8.
- Lunghezza di ancoraggio 300 mm
- Tipo di ancorante: Piastra rondella - circolare; dimensione 40 mm
- Offset strati superiori 50 mm, strati sinistri −20 mm
- Piano di taglio nel filetto
Blocco di fondazione
- Calcestruzzo C20/25
- Offset 200 mm
- Profondità 800 mm
- Trasferimento della forza di taglio per attrito
- Spessore malta di livellamento 30 mm
Carichi
- Forza assiale N = −762 kN
- Momento flettente My = 56 kNm
Risultati
- Piastre
- Bulloni di ancoraggio 97,8 % (\(N_{Ed,g} = 65.7 \textrm{ kN} \le N_{Rd,c} = 67.2 \textrm{ kN}\) (componente critica: rottura del cono di calcestruzzo per il gruppo di ancoraggi A1 e A2)
- Blocco di calcestruzzo 91,5 % (\( \sigma = 24.5 \textrm{ MPa} \le f_{jd} = 26.8 \textrm{ MPa}\))
- Rigidezza rotazionale secante \(S_{js} = 6.3 \textrm{ MNm/rad}\)
Riferimenti
EN 1993-1-8, Eurocode 3, Design of steel structures – Part 1-8: Design of joints, CEN, Brussels, 2005.
Wald F. Column Bases, CTU Publishing House, Prague, 1995.
Wald F., Sokol Z., Steenhuis M., Jaspart, J.P. Component method for steel column bases, Heron, 53, 2008, 3-20.