General description of SLS results in Detail application
In the calculation for the results of SLS, only the elastic behavior of concrete is taken into account. In other words, an infinite linear stress-strain diagram is considered for concrete. You can display long-term or short-term effects for SLS checks. What is the difference between these two effects? Read the article below (paragraph Concrete SLS) to learn more.
Stress
There are two options for displaying results for concrete and reinforcement:
- the ratio of the stress and the limit stress
- the stress itself
Stresses are calculated for the Characteristic and for the Quasi-permanent load combinations.
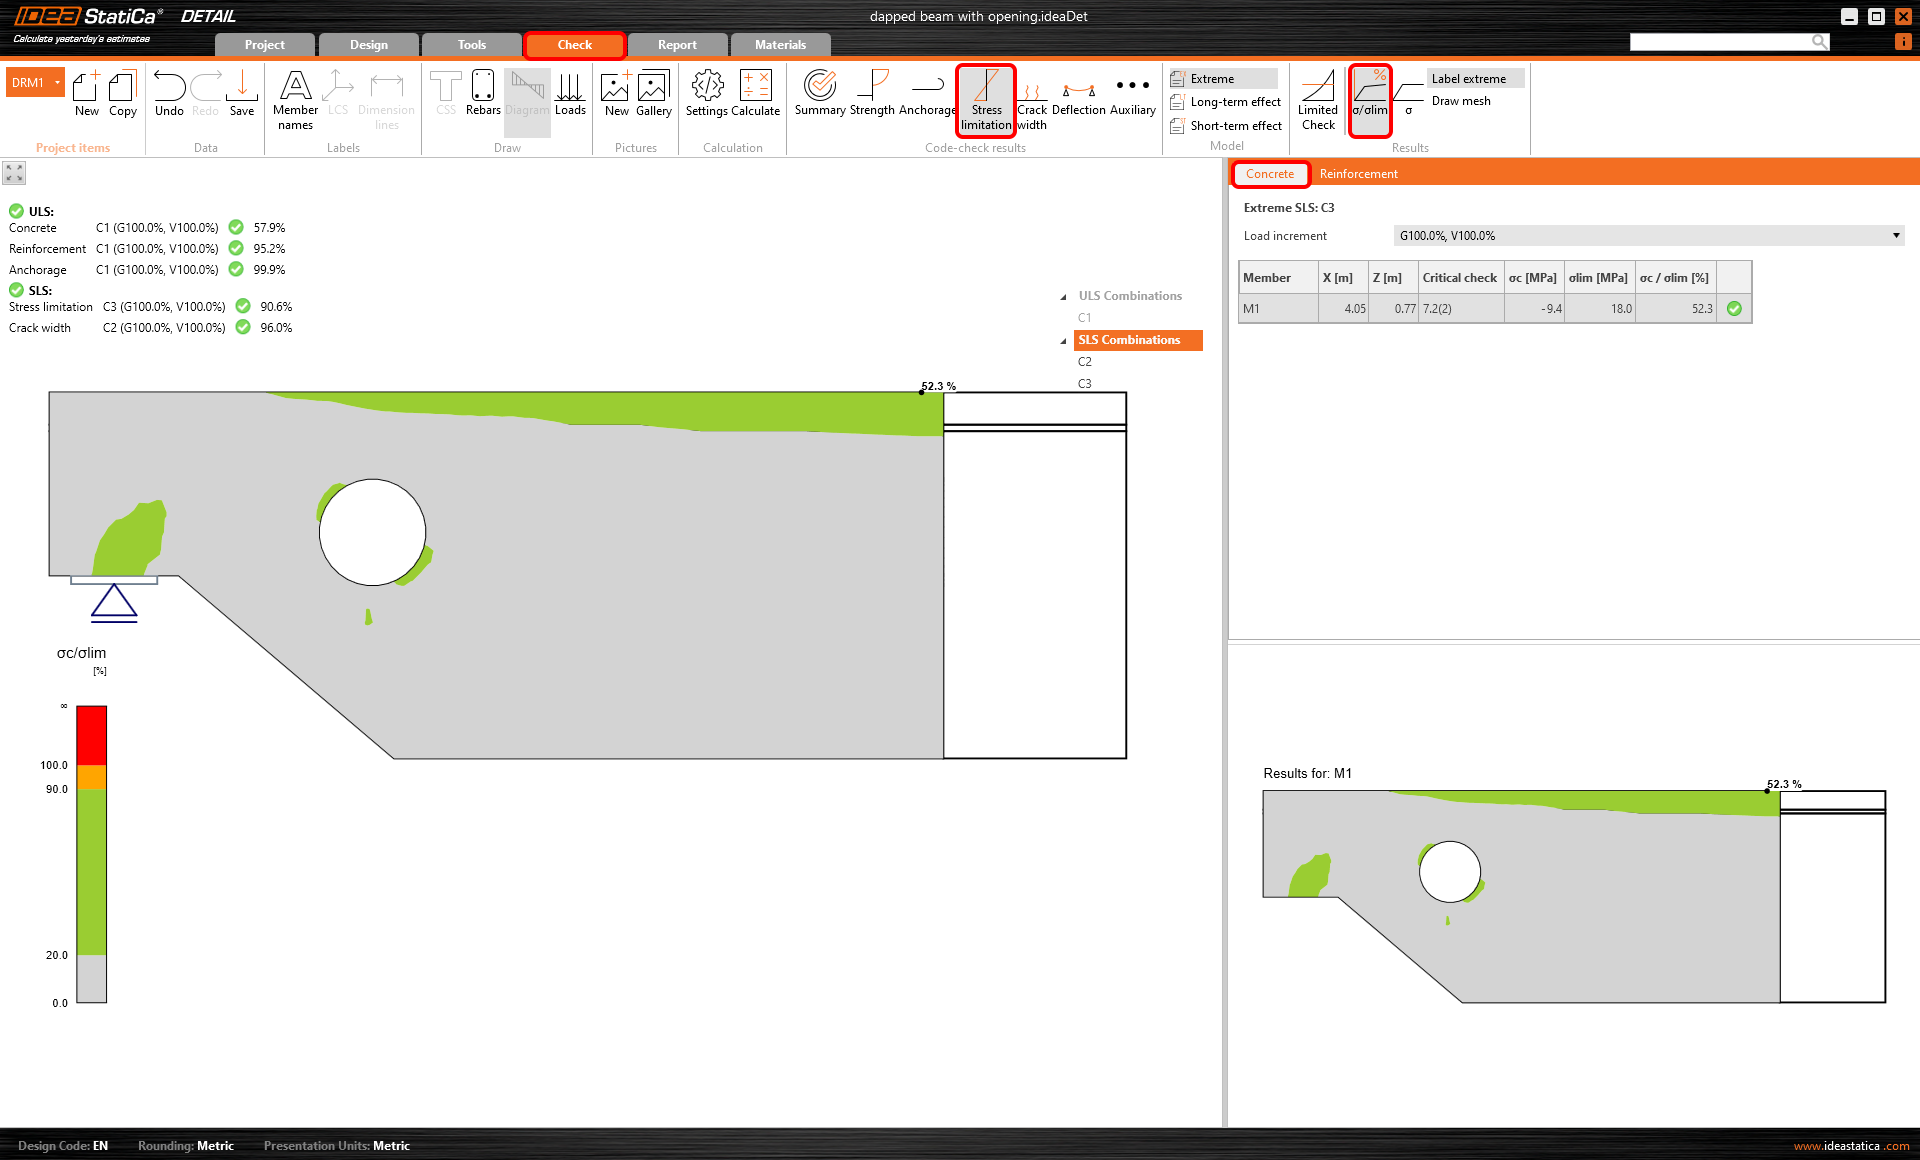
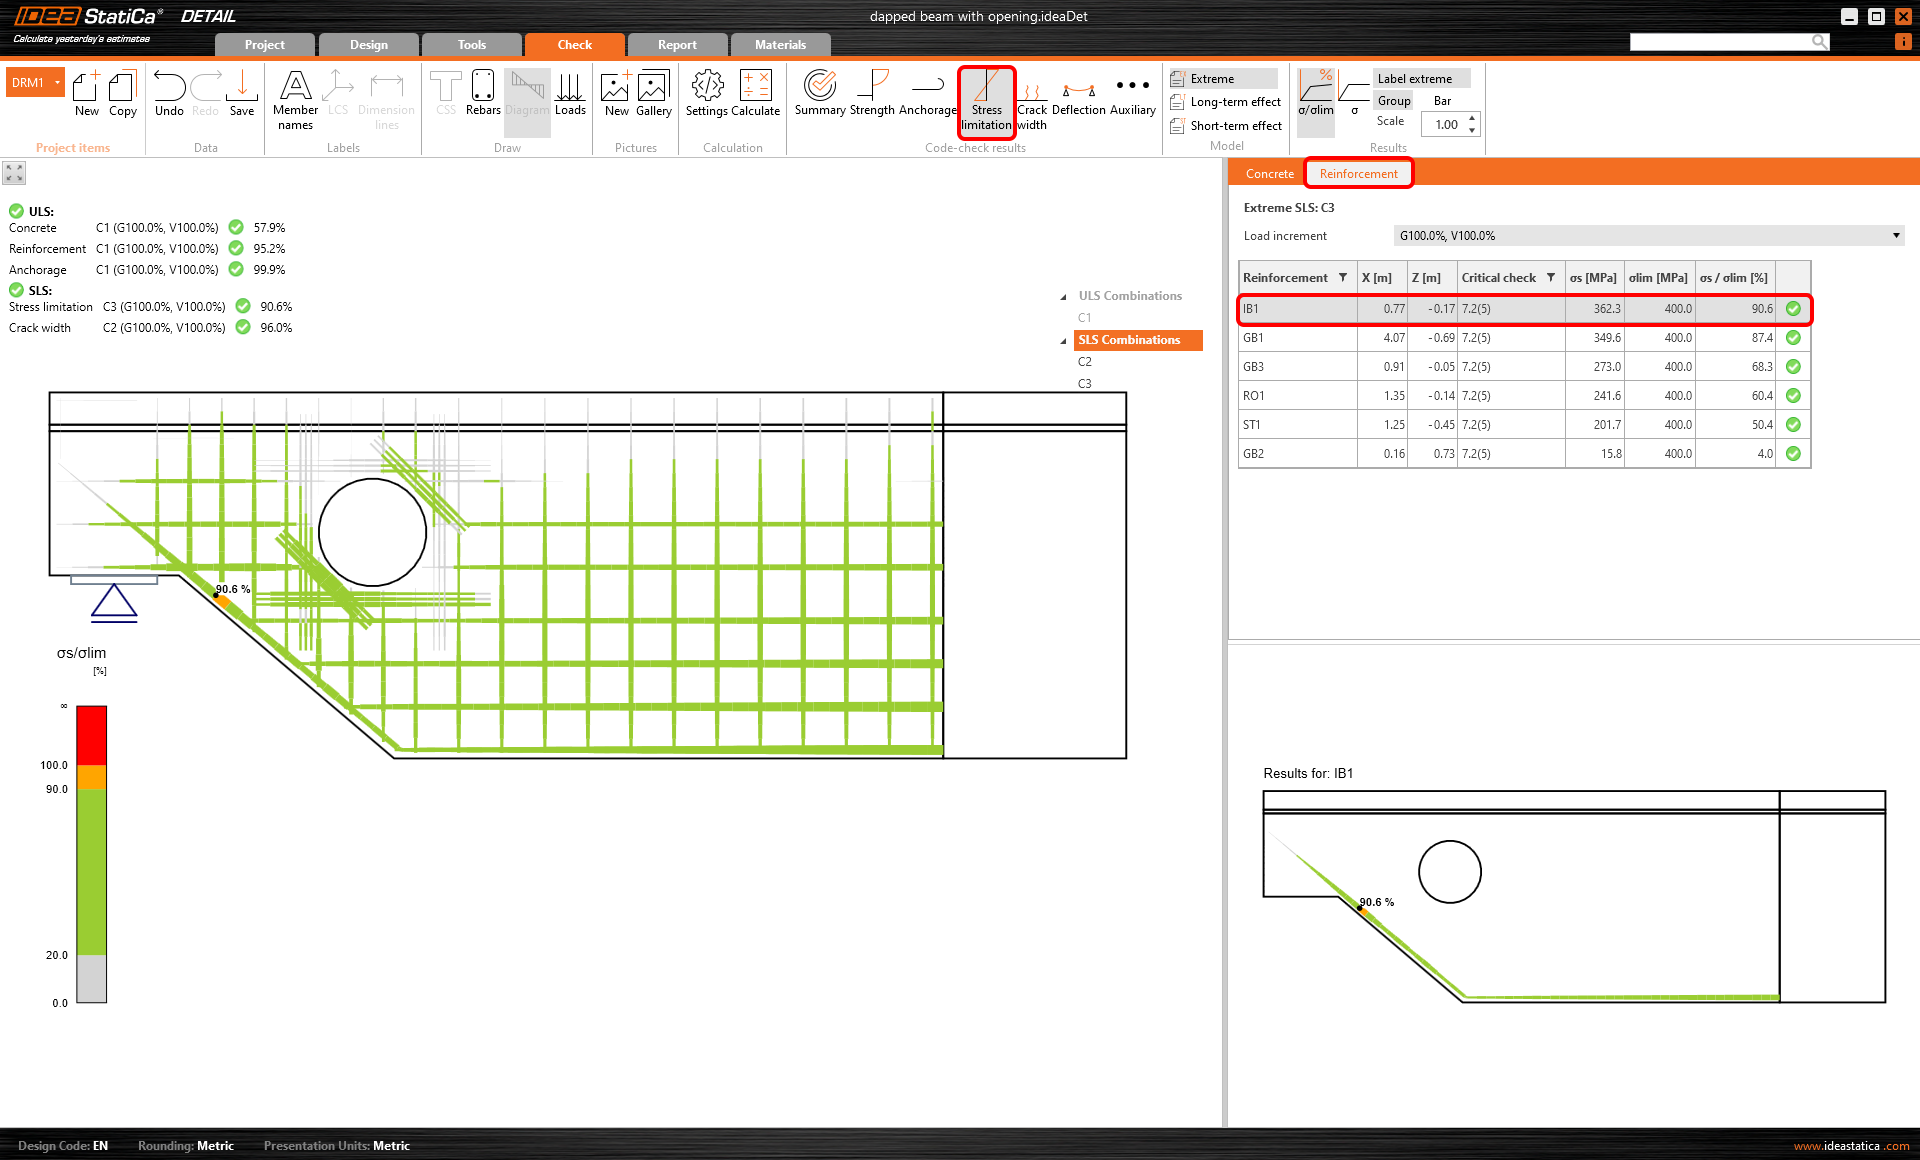
Ratio of the stress and limit stress
The results are clear at first sight: Green color means the utilization is up to 90%, orange is 90-100% of utilization, and red is above 100%.
Read about how the limit value is determined in the following article.
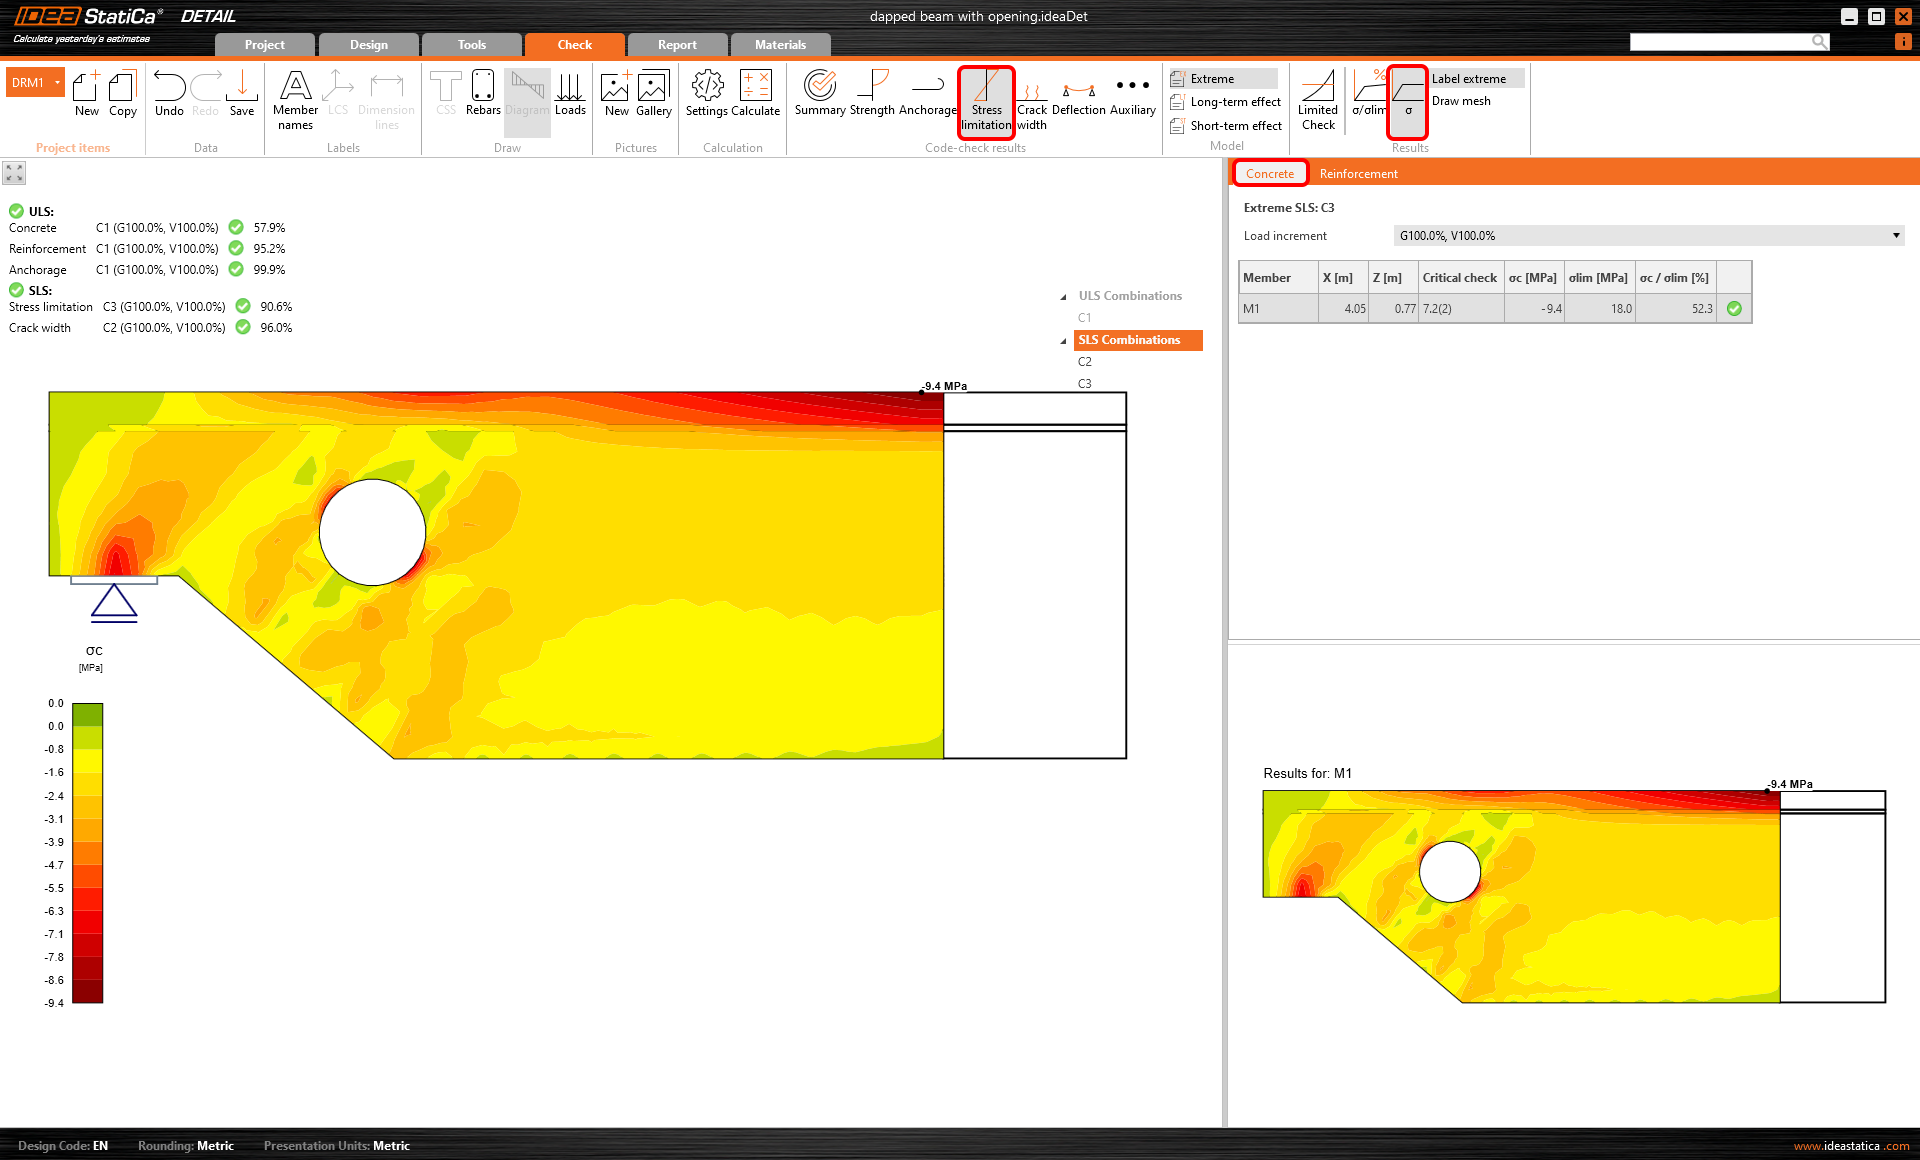
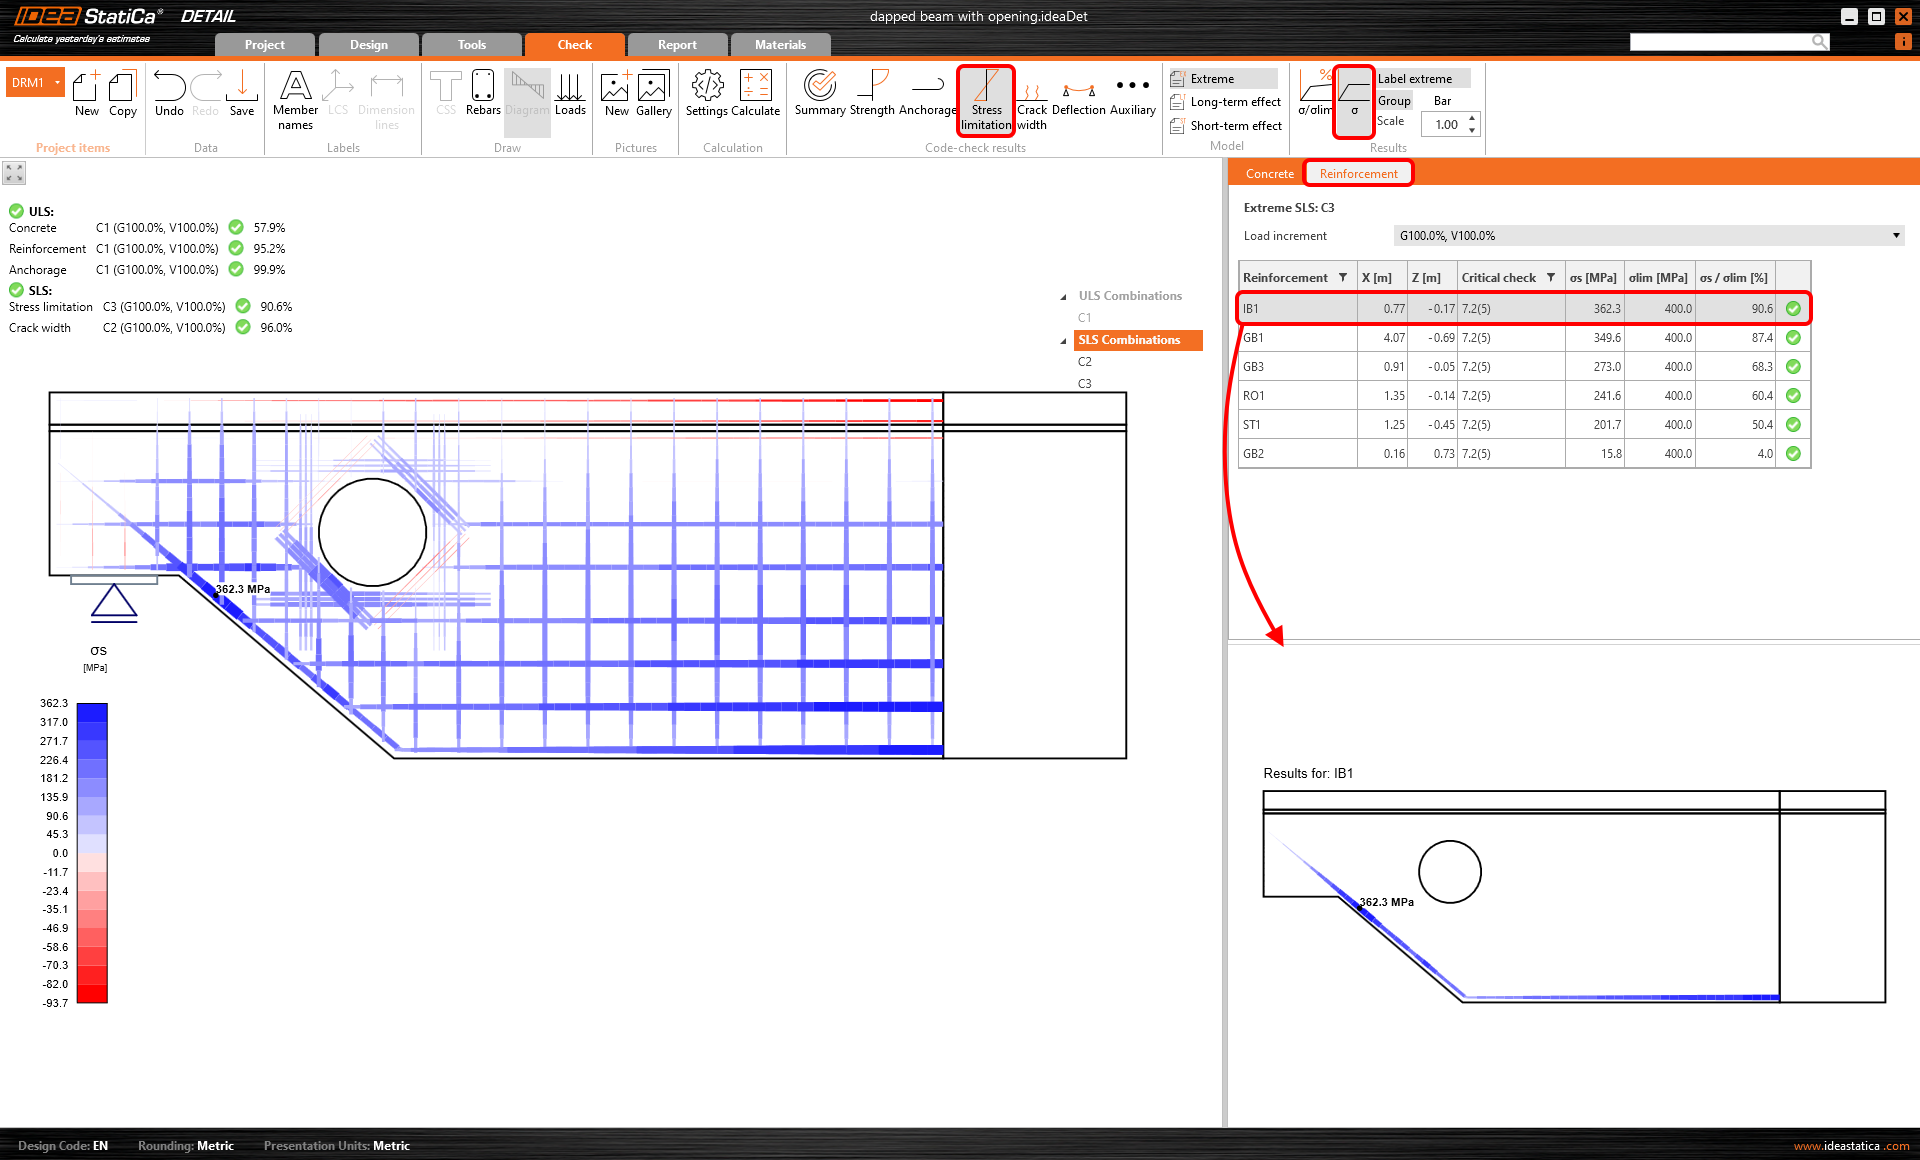
Stress
The display method is similar to the ULS results (in this case, the stress is from the calculation with the elastic behavior of concrete). You can display the distribution of concrete stress σc for an applied portion of the load. Also known as principal stresses σ2.
Crack
In this section, you will learn about all four options for displaying results for crack checks. Read the further articles to learn about the calculation.
Cracks are calculated only for the Quasi-permanent load combinations.
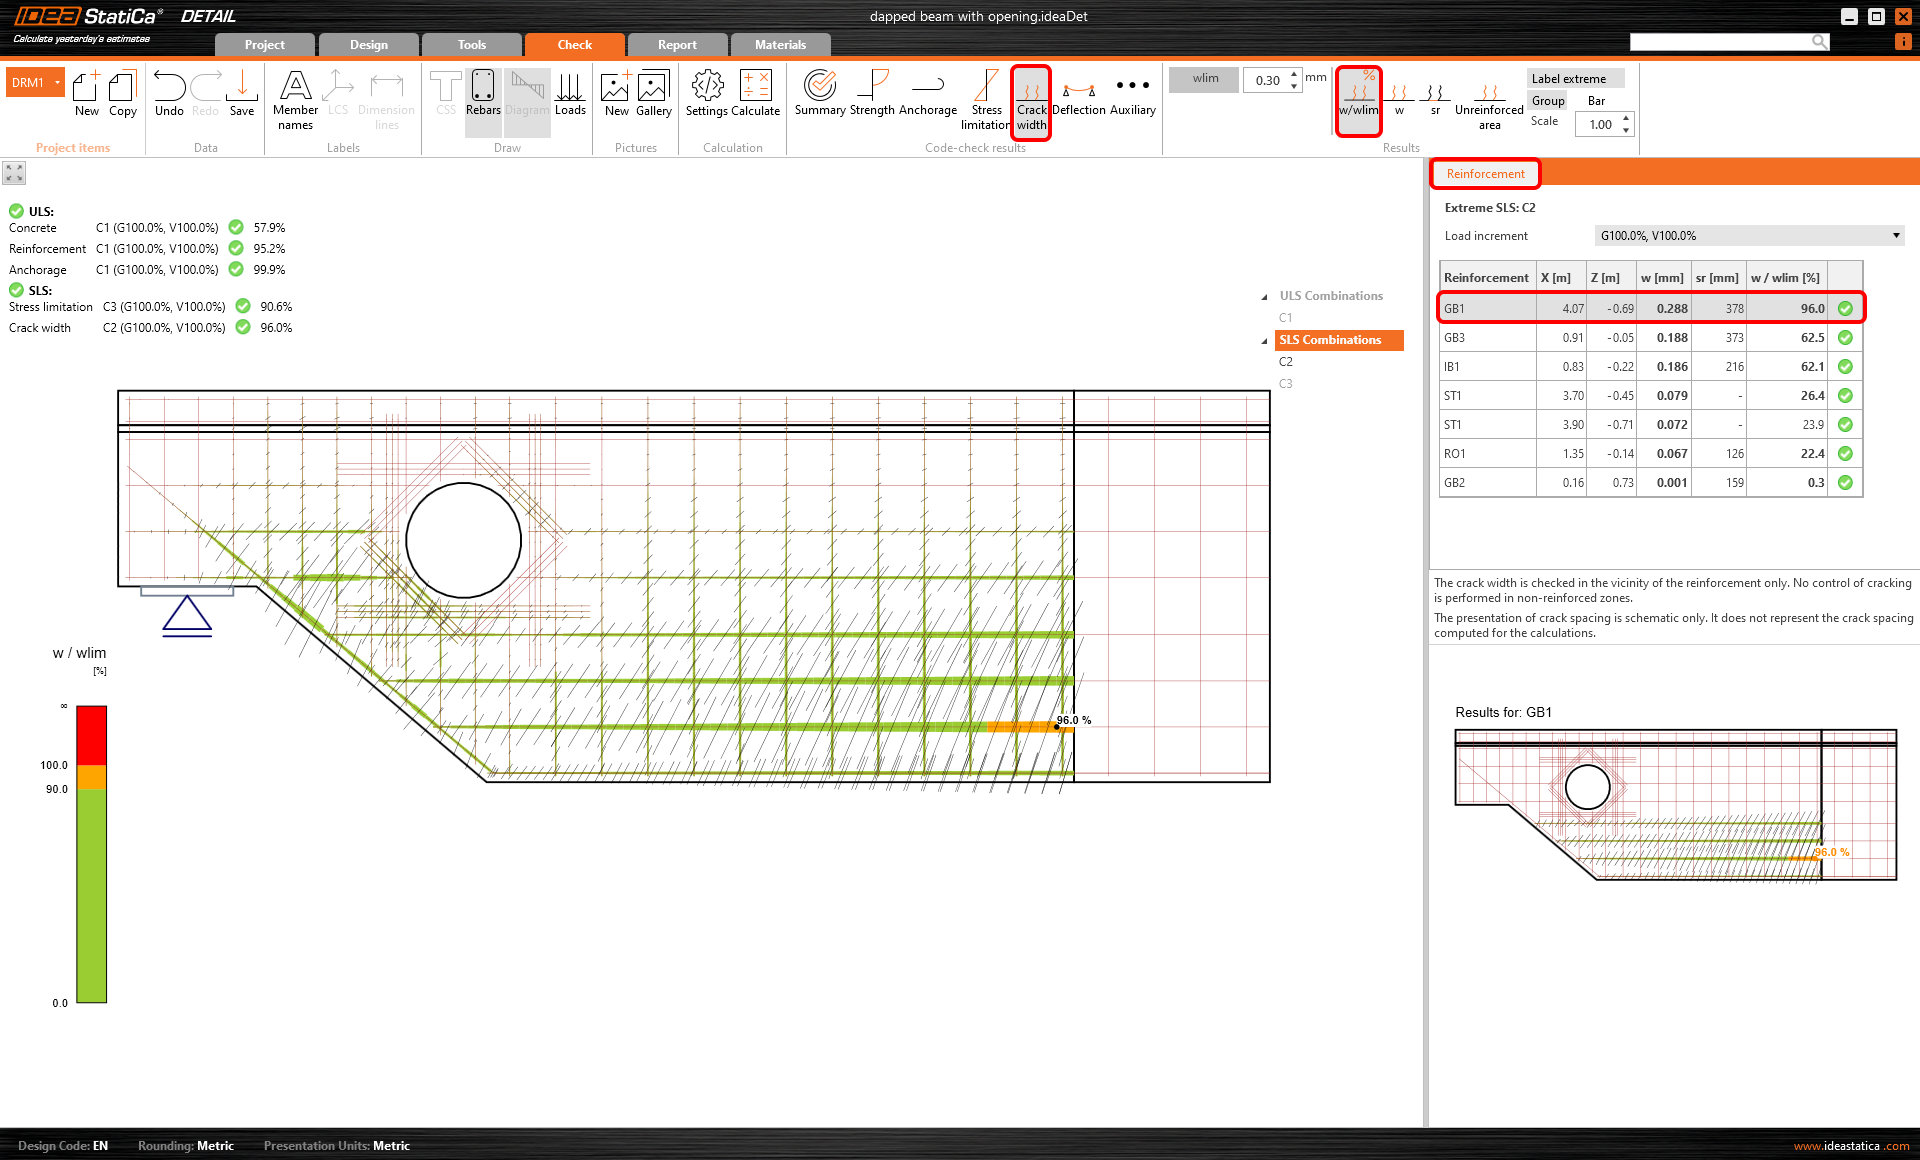
Ratio of crack width and limit crack width
The limit value wlim can be set in the top ribbon. The wlim = 0.3 mm is set by default according to Eurocode. The results are again differentiated by color (green/orange/red) so that the check is obvious at first sight.
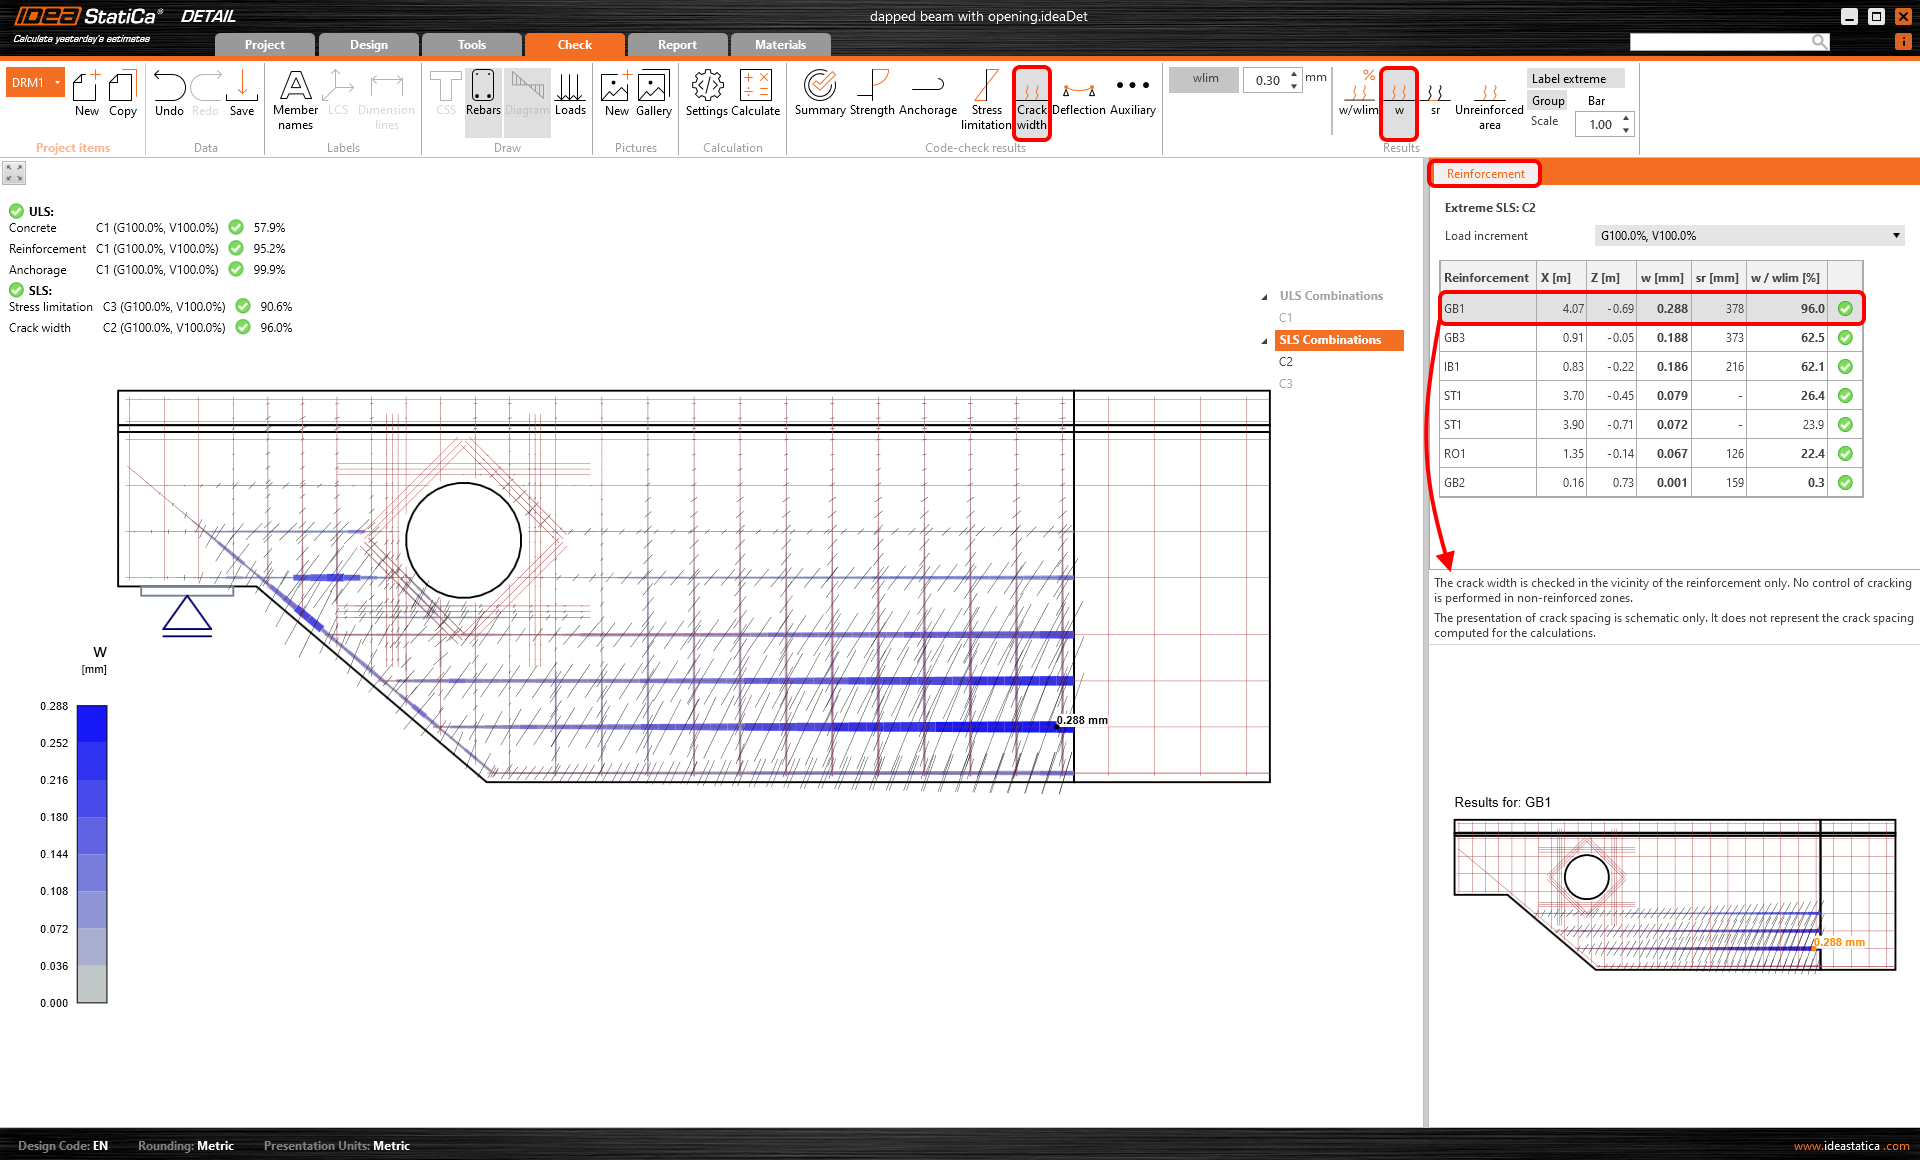
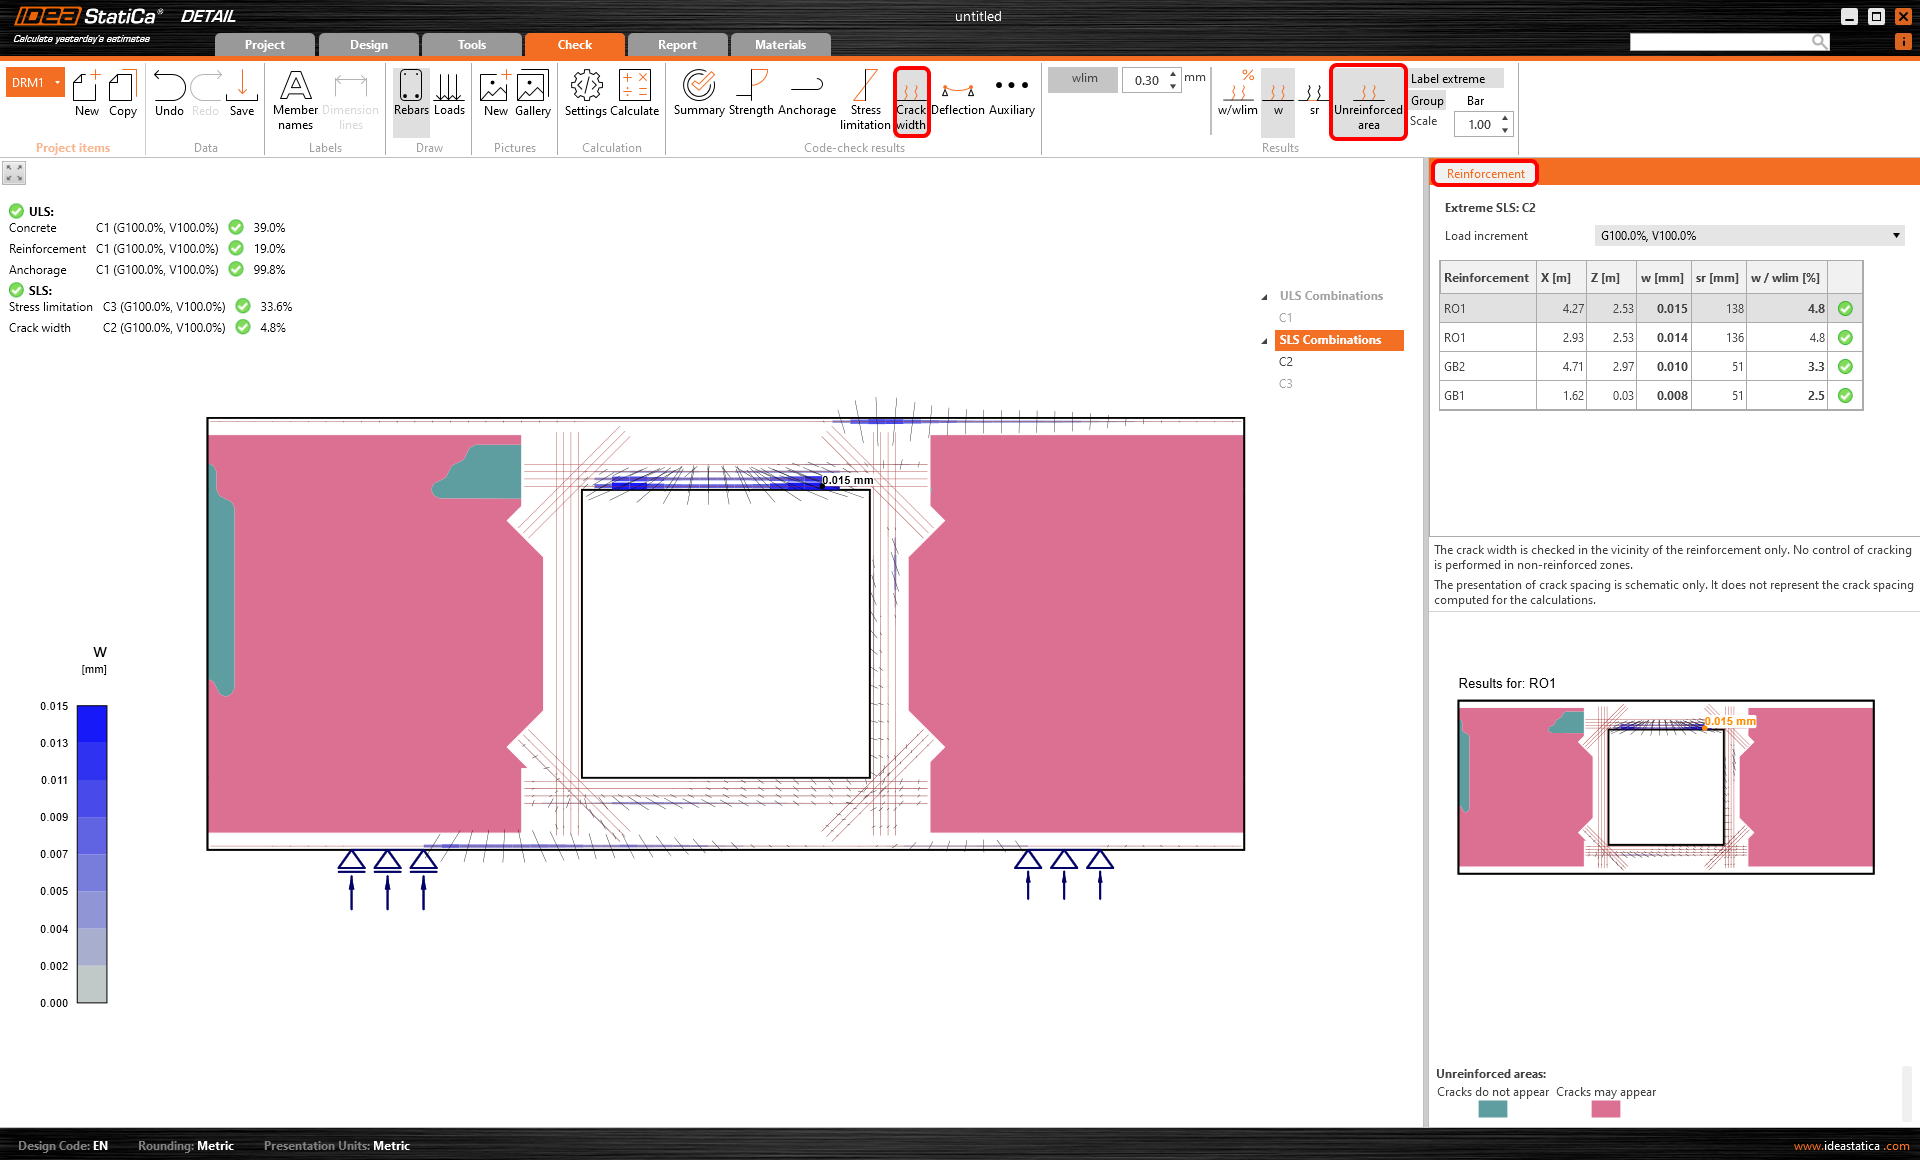
Crack width
This functionality is used to display the crack width for every single element of the reinforcement.
The distance between stabilized cracks
See the links at the beginning of the section. The article explains the method of calculating the distance between stabilized cracks.
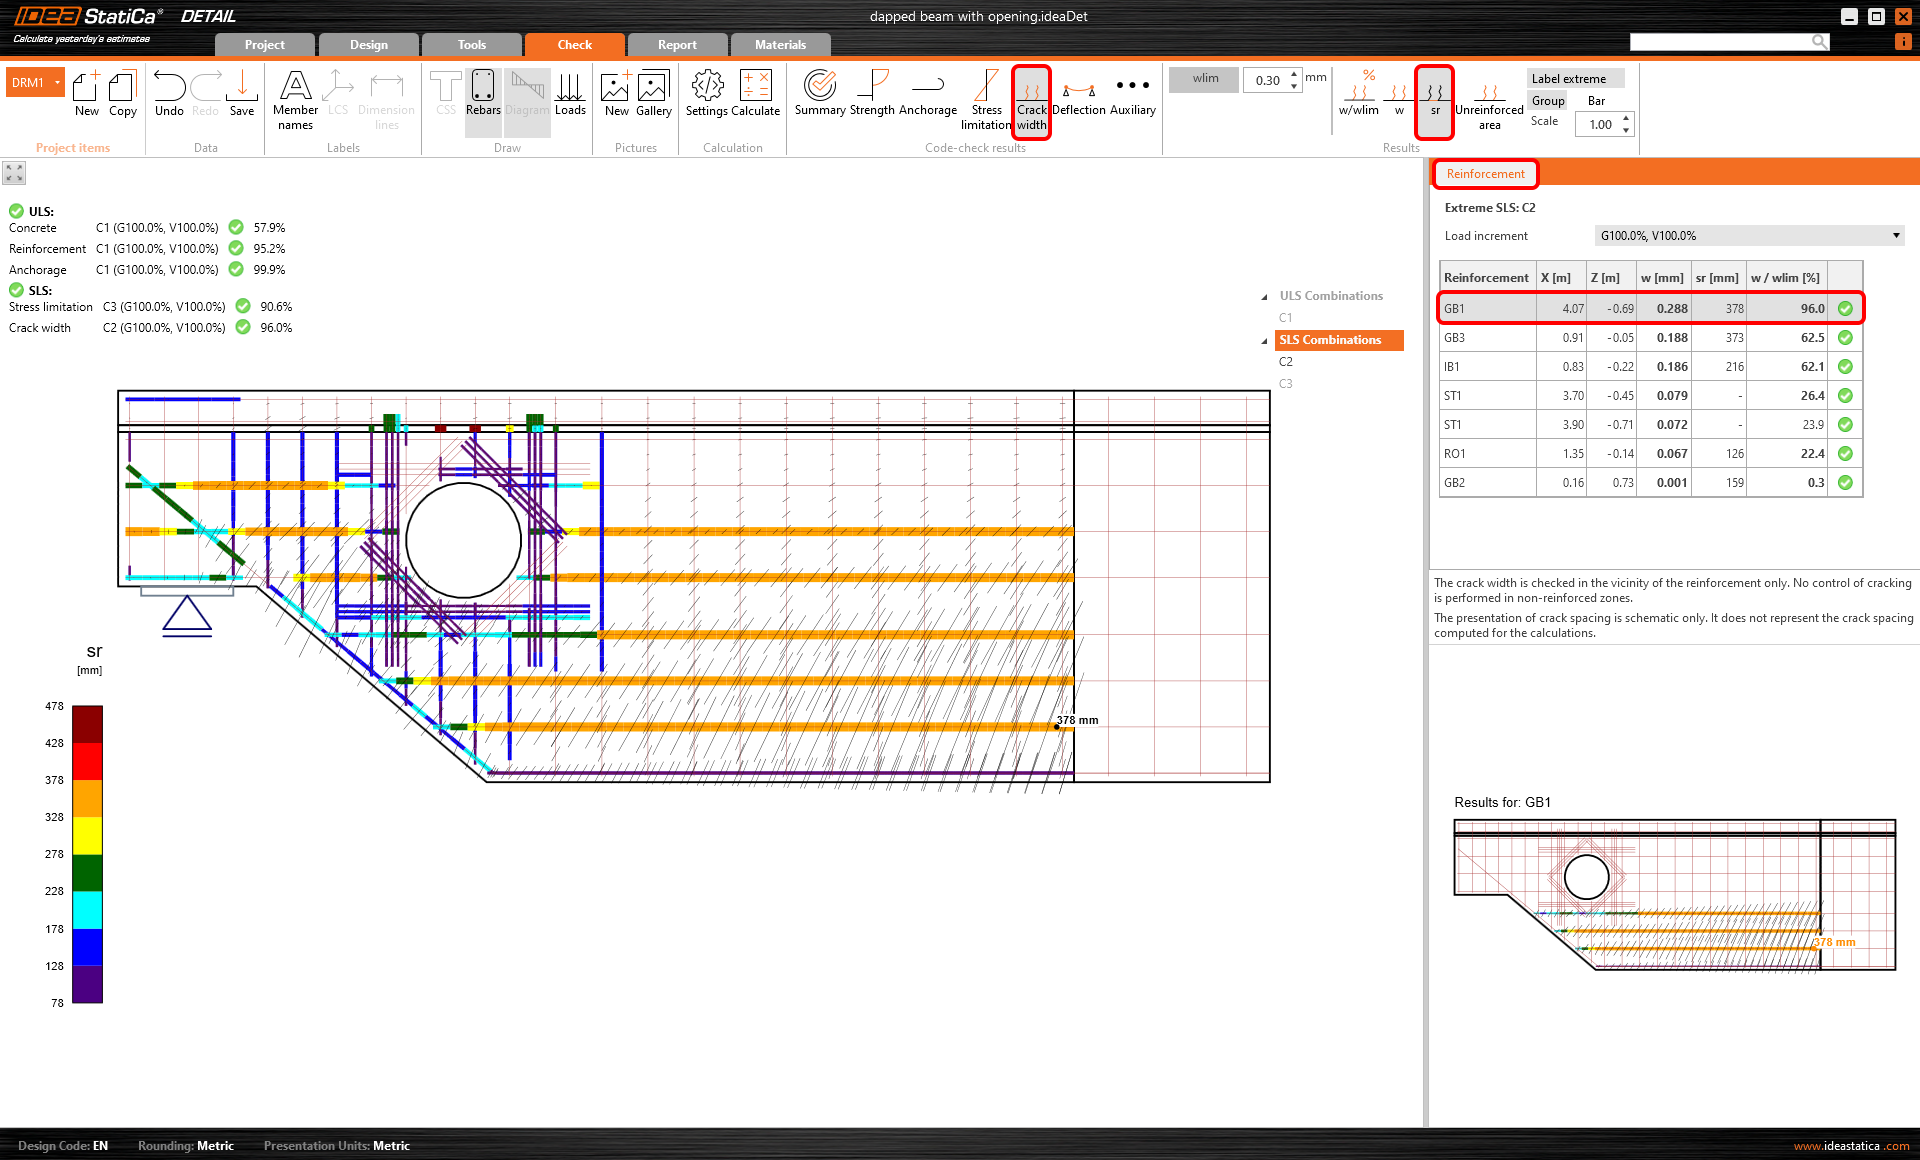
The presentation of crack spacing is schematic only. It does not represent the crack spacing computed for the calculation.
Unreinforced area
The crack width is checked only in the vicinity of the reinforcement. Control of cracking is not performed in non-reinforced zones.
This result simply shows the non-reinforced areas where cracks will probably appear. It is recommended to design some reinforcement to that areas.
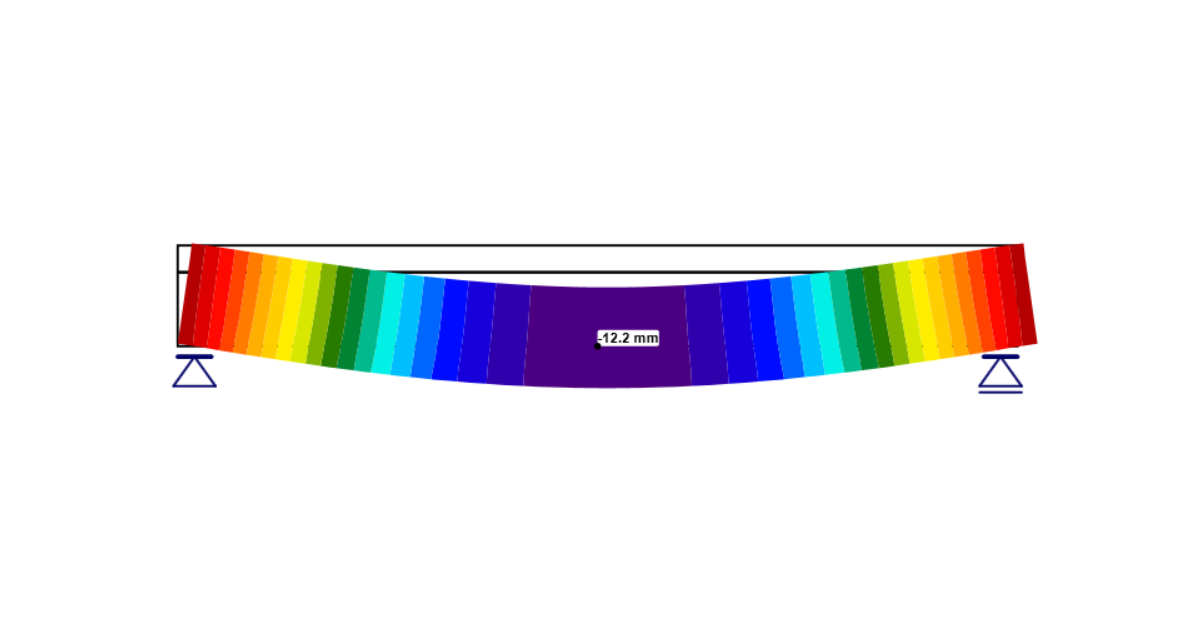
Deflection
See the options below:
- uz,st - Immediate deflection caused by total load - calculated with short-term stiffnesses Ec.
- uz,lt - Long-term deflection caused by long-term loads (permanent and prestressing load type) - calculated with long-term stiffnesses Ec,eff. In other words, the creep coefficients are included.
- Δuz - Deflection increment caused by short-term loads (variable load type) - calculated with short-term stiffnesses Ec.
- uz,tot = uz,lt + Δuz
Deflections are calculated only for the Characteristic load combinations.
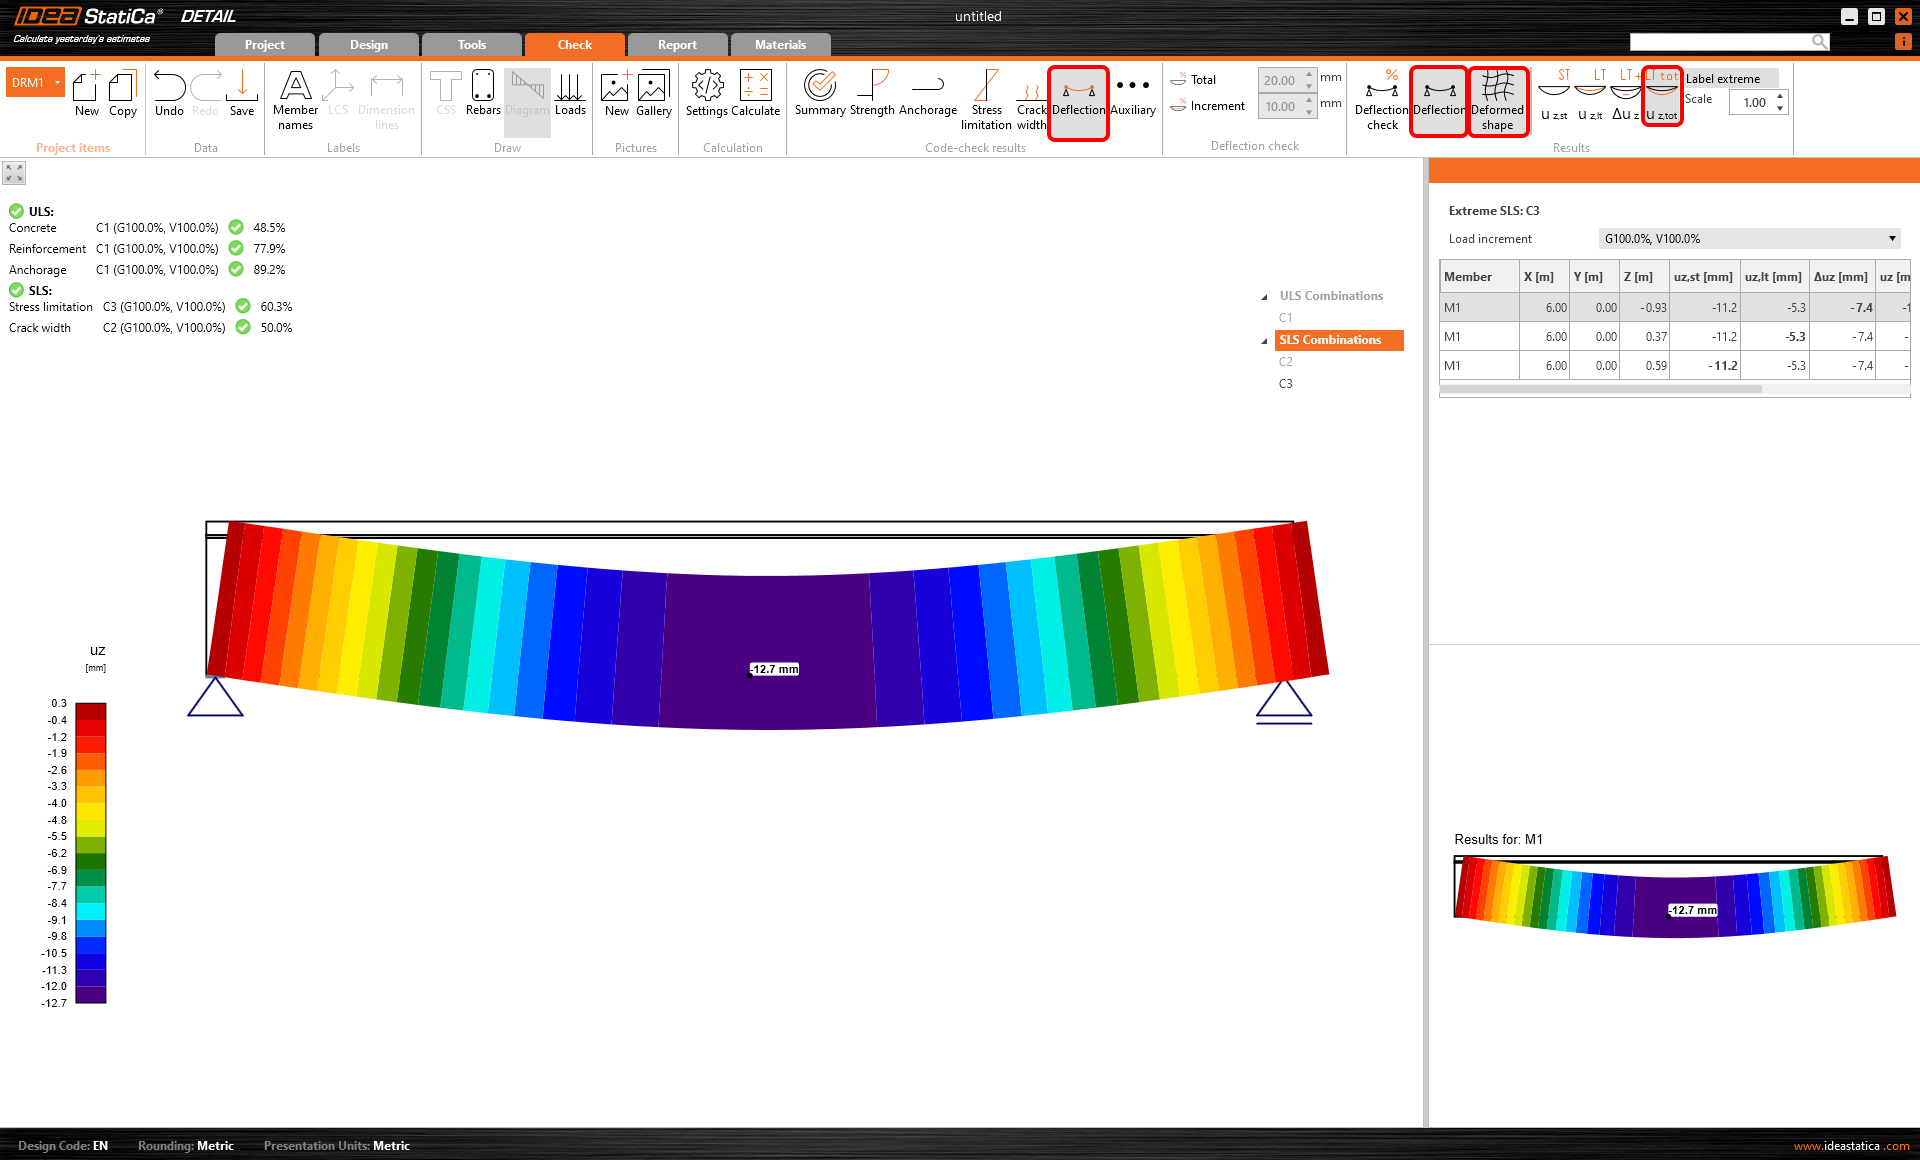
Besides the table values in the Data section, you can display the deformed shape. You can also modify the scale of the deformation.
Finally, in addition to displaying deformations, it is also possible to do a deflection check. You can choose between two checks - Increment and Total.
- Δuz / Δuz,lim - Increment
- uz,tot / Δuz,lim - Total
Δuz,lim, and Δuz,lim can be manually set in the Deflection check bar in the top ribbon.
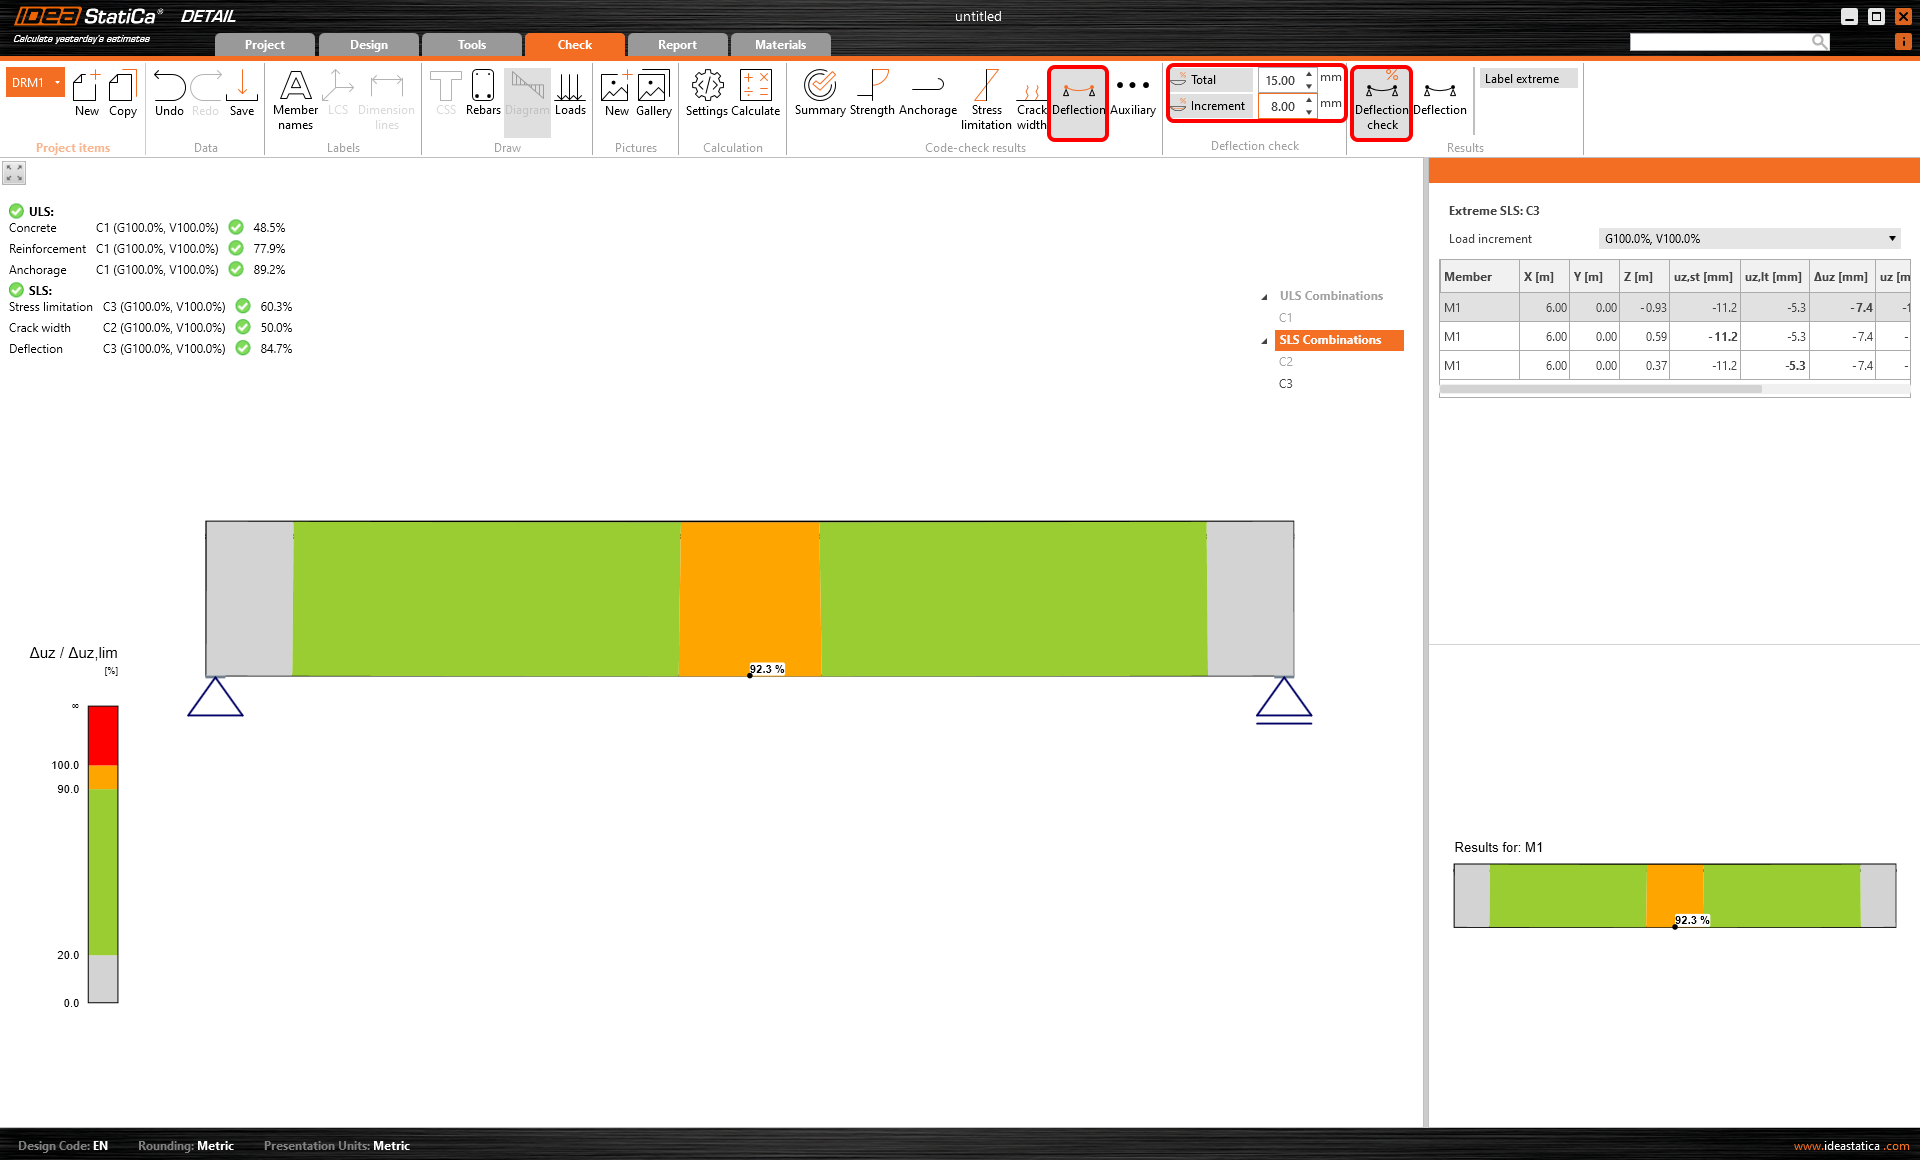
The deflection check is not allowed for trimmed ends.
Practical example
For a practical example of displaying the results, continue to the video from the previously streamed webinar. Due to the fact that we have two identical models, which vary in the usage method, we can check and compare results for both.