
Unit test: Shear tests in beams with low amounts of stirrups
Introduction
In the upcoming article, we aim to explore shear failure in beams with low amounts of stirrups. We will compare experimental data with the 3D-CSFM Solid Block model to analyze load-deformation responses and predict failure modes. This unit test includes three examples, each varying in the amount of reinforcement and dimensions of the beam. Additionally, this article extends the existing verification of the 2D CSFM[1], offering a more detailed examination of mesh variations and the number of examples. All CSFM based methods were conducted in IDEA StatiCa Detail application using mostly default settings. Further insights on this topic will be discussed later in the article.
Definition of failure modes
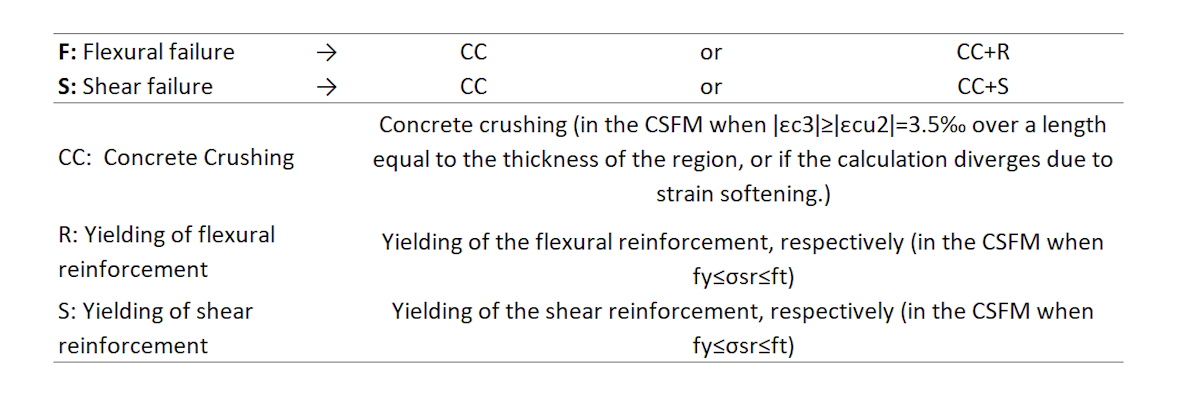
To facilitate the comparison of failure modes observed in the experiments with those predicted by the CSFM, the failure modes are categorized as either flexural (F) or shear (S). Although yielding of the reinforcement does not constitute a material failure per se, it is included as a part of the failure mode classification in conjunction with concrete crushing. This distinction is crucial for identifying concrete crushing failures that occur without reinforcement yielding—which are typically very brittle—from those that occur after the reinforcement has yielded, which can demonstrate a degree of deformation capacity.
\[ \textsf{\textit{\footnotesize{Table. 1.1 Definition of failure modes}}}\]
Unit test set up
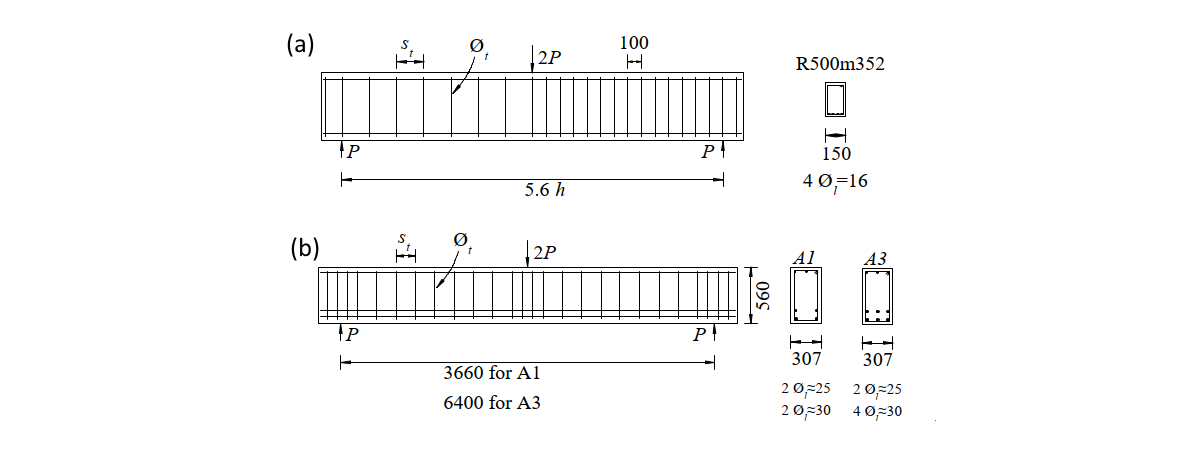
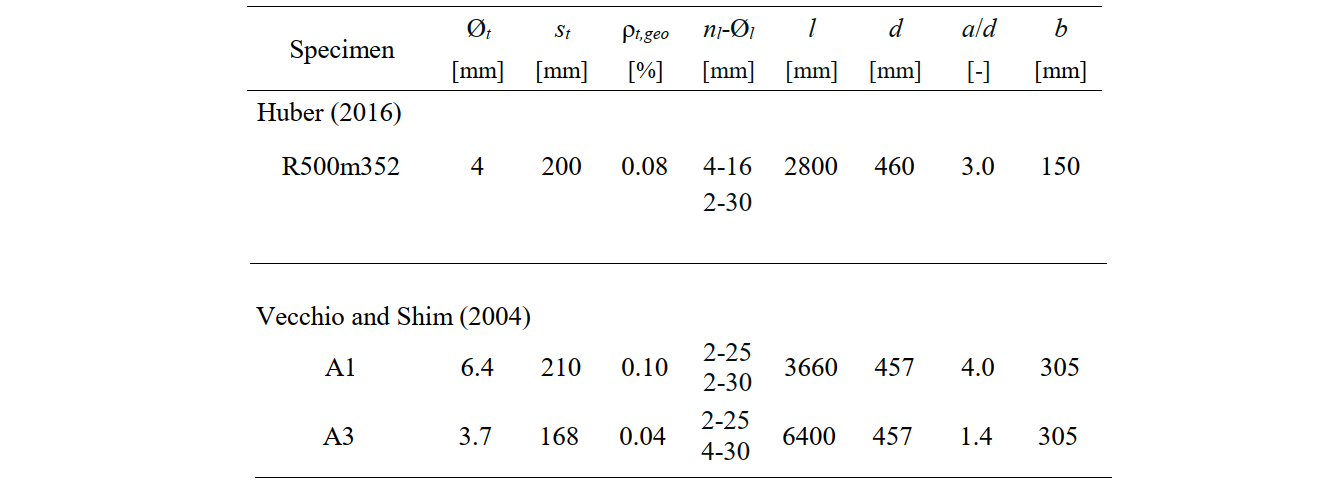
In this unit test all beams were supported as simple beams and loaded with a single mid-span force. Parameters as dimension reinforcement of the beam can be seen from Fig 2.1. This table includes information such as the diameter of the shear reinforcement (Øt), spacing (st), and the geometric reinforcement ratio (ρt,geo). Additionally, details regarding the flexural reinforcement, including the number (nl) and diameter (Øl) of the bars, as well as the geometry of the beams—effective depth (d), shear slenderness ratio (a/d), and width (b)—are presented. The test designated R 500m352, conducted by Huber in 2016[3], utilized specimens reinforced with one-leg hooks. In contrast, test specimens A1 and A3, which were part of an experiment performed by Vecchio and Shim in 2004[2], used two-leg closed stirrups for reinforcement.
\[ \textsf{\textit{\footnotesize{Fig. 2.1 Dimensions and mode of Reinforcement: (a) R500m352, (b) A1, A3 }}}\]
\[ \textsf{\textit{\footnotesize{Table. 1.2 Reinforcement Properties}}}\]
Material properties
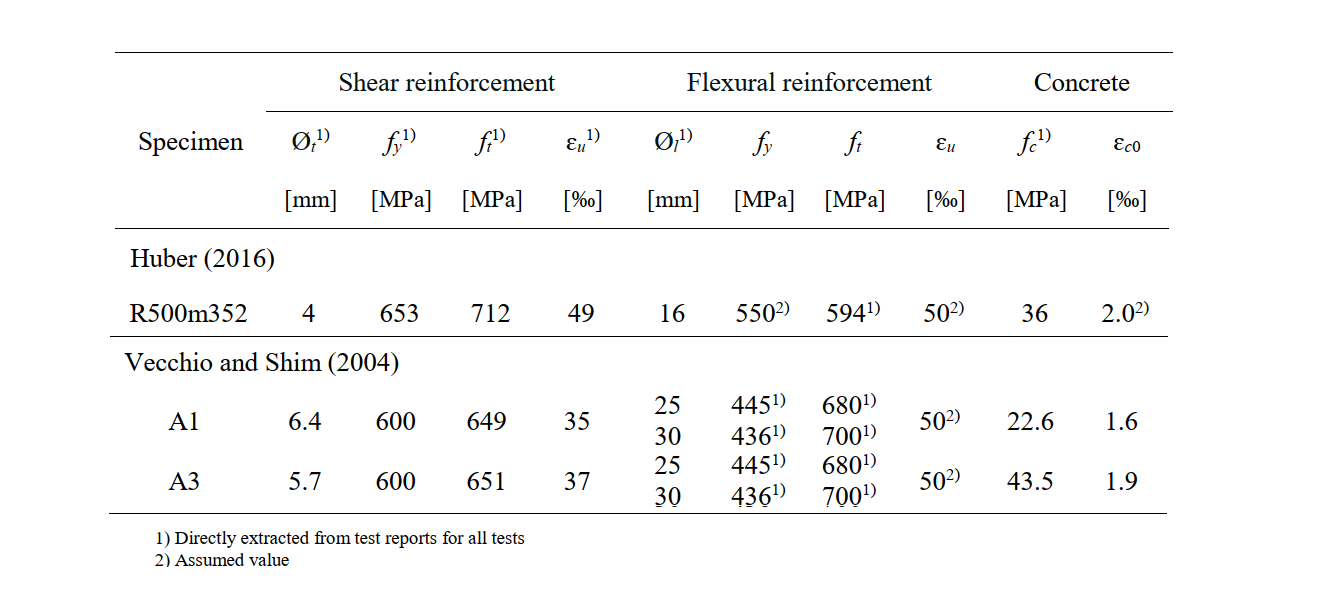
The material properties of the concrete, reinforcement, and anchors used in the CSFM analysis are detailed in Table 1.3. Most of the necessary material properties for input into the CSFM were stated in the reports of the given experiments. Values that were not explicitly stated and therefore assumed are marked in the table.
\[ \textsf{\textit{\footnotesize{Table. 1.3 Material Properties}}}\]
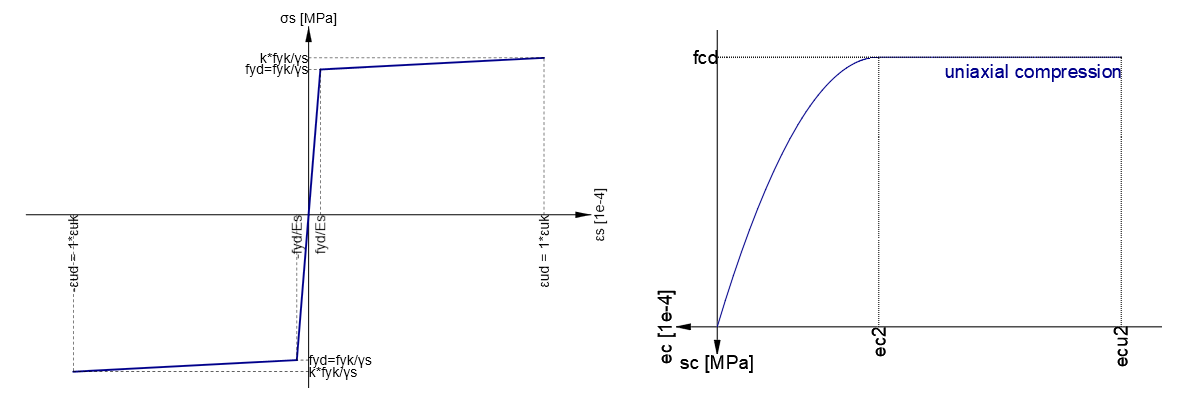
\[ \textsf{\textit{\footnotesize{Fig. 2.2 Stress strain diagrams of materials: (a) Stress-strain diagram of reinforcement, (b) Stress-strain diagram of concrete}}}\]
Modeling with 3D-CSFM
Material and reinforcement parameters utilized in both the 2D and 3D CSFM analyses were sourced from Table 1.2 and Table 1.3, respectively. In the 3D-CSFM, beams were modeled using the solid block model class in IDEA StatiCa Detail. Loading on the beams was applied at mid-span as a surface load over an area of 0.2 m by b (the width of the beam), with the resultant force acting in accordance with experimental data. The support conditions for the beams were modeled as simply supported, utilizing a surface support measuring 0.15 m by 0.30 m. This configuration was designed to replicate experimental setup conditions accurately and provide a realistic simulation of beam behavior under load.
As previously stated, nearly all parameters, including the mesh size, are maintained as per the default settings in IDEA StatiCa Detail. However, a specific adjustment was made for the modeling of stirrups: the "Pull-Out model" was explicitly employed instead of the default "Tension Chord model". This model is automatically applied in the 2D-CSFM model under the Beam class for stirrups. The modification was implemented to ensure accurate calculation of stirrups in the 3D-CSFM Solid Block model type within the IDEA StatiCa Detail's developer mode. This adjustment is pivotal for aligning the simulation closely with the physical behaviors observed in experimental setups, particularly in how stirrups are subjected to loads in the models.
Read more about the Tension Chord model and Pull-Out model in the Theoretical background
All partial factors in IDEA StatiCa Detail are set to value 1.0.
\[ \textsf{\textit{\footnotesize{Fig. 2.3 Loads in IDEA StatiCa Detail: (a) 3D-CSFM: A1 - Vecchio and Shim (2004), (b) 2D-CSFM: R500m352 - Huber (2016)}}}\]

Load deformation Response
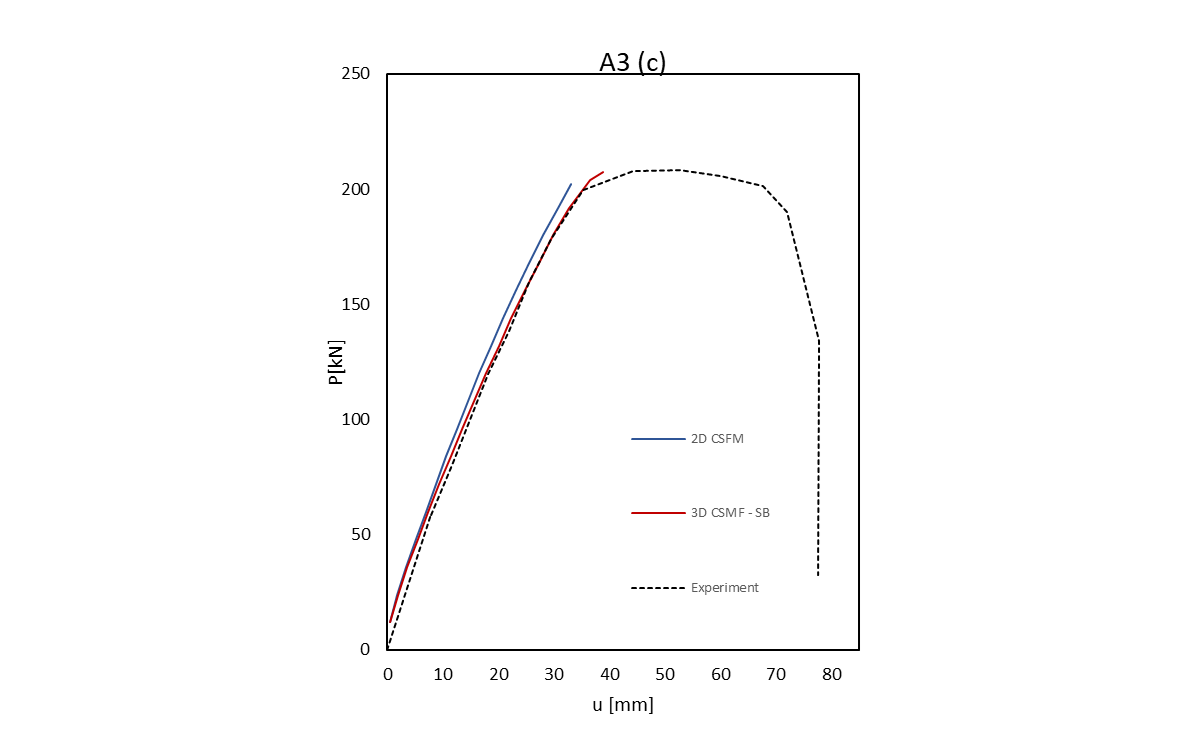
The comparison between the numerical methods and the experimental data can be visualized in Figure 2.4. In this figure, the experimental data is represented by a black dashed line, while the 2D-CSFM is depicted with a blue solid line and the 3D-CSFM with a red solid line. The graphs demonstrate a strong correlation between the numerical methods and the experimental data, indicating that the simulations are effectively capturing the behavior observed in physical experiments. This alignment suggests that the numerical models are robust and provide a reliable basis for analyzing the structural response under tested conditions.
\[ \textsf{\textit{\footnotesize{Fig. 2.4 Load-Deformation Respons: (a) R500m352, (b) A1, (c) A3}}}\]

The comparison of the critical load can be seen from Figure 2.5 and percentage of compliance from the Table 1.4. For all examples consistent alignment with experimental findings.
\[ \textsf{\textit{\footnotesize{Fig. 2.5 Critical Load: (a) R500m352, (b) A1, (c) A3}}}\]

\[ \textsf{\textit{\footnotesize{Table. 1.4 Critical Load comparison}}}\]

\[ \textsf{\textit{\footnotesize{Table. 1.5 Critical Load and Failure mode type comparison}}}\]

Conclusion
In the unit test, a comparison is made between the experimental behavior and the CSFM simulations, both in 2D and 3D, of a beam with a low amount of reinforcement. Key insights from the article include:
- Both the 2D and 3D CSFM simulations closely match the experimental data, demonstrating their capability to accurately predict the structural behavior of beams with minimal reinforcement.
- The use of solid block modeling in 3D and the equivalent 2D modeling techniques are effective in representing the actual conditions of the beams under load, as validated by the strong correlation with experimental results.
- The results of the load-deformation response, critical load comparison, and failure mode prediction show a strong agreement with experimental outcomes. This strong alignment underscores the effectiveness and accuracy of the CSFM simulations in modeling the actual behavior of beams under various loading conditions.
- Although the 3D-CSFM is still in its beta phase, its alignment with experimental findings highlights its potential utility. This agreement provides some validation of the tool's effectiveness, though it should be interpreted with caution given its developmental stage.
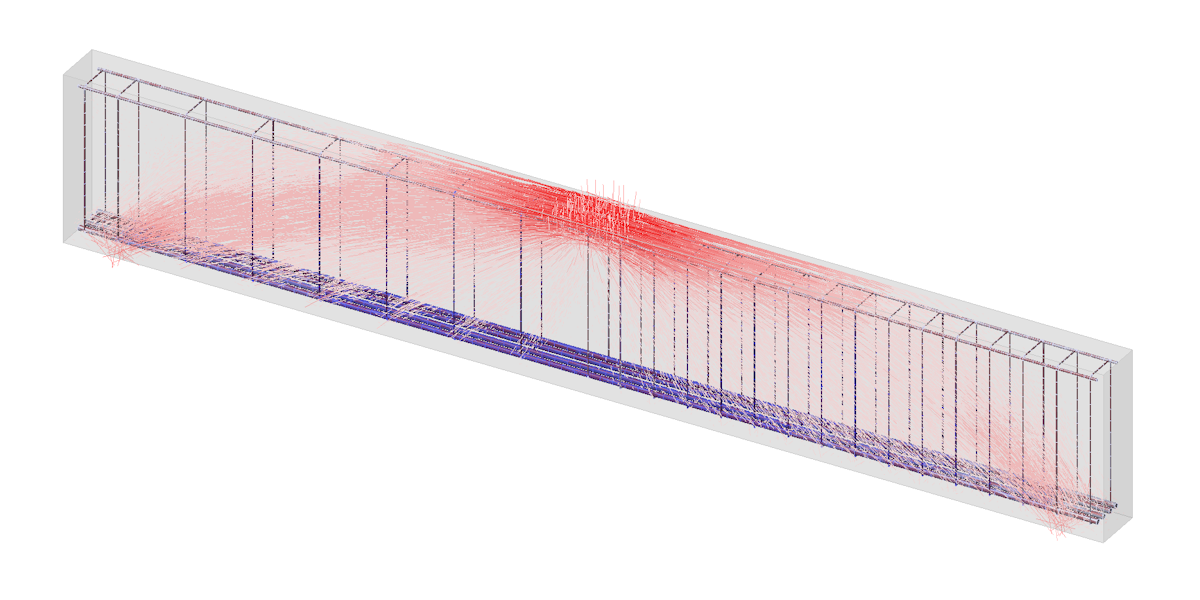
\[ \textsf{\textit{\footnotesize{Fig. 2.6 Stress field results R500m352}}}\]
References
[1] - Kaufmann, W., J. Mata-Falcón, M. Weber, T. Galkovski, D. Thong Tran, J. Kabelac, M. Konecny, J. Navratil, M. Cihal, and P. Komarkova. 2020. “Compatible Stress Field Design Of Structural Concrete. Berlin, Germany.”AZ Druck und Datentechnik GmbH, ISBN 978-3-906916-95-8.
[2] - Vecchio, F.J., and W. Shim. 2004. “Experimental and Analytical Reexamination of Classic Concrete Beam Tests.” Journal of Structural Engineering 130 (3): 460–69.
[3] - Huber, P. 2016. “Beurteilung der Querkrafttragfähigkeit bestehender Stahlbeton- und Spannbetonbrücken.” PhD thesis, Wien: TU Wien, Faculty of Civil Engineering.