Compararea rezultatelor GMNIA din IDEA Member cu o soluție analitică
1. Obiectivul
Obiectivul acestui articol este verificarea modulului GMNIA (analiza geometrică și materială neliniară cu imperfecțiuni) al aplicației IDEA Member. Rezistențele rezultate din IDEA Member sunt comparate cu soluția analitică conform EN 1993-1-1 [1] pentru stâlpi la compresiune.
2. Descrierea modelului
Un total de 24 de cazuri individuale au fost analizate pentru verificarea modulului GMNIA. Toate au aceeași secțiune transversală HEB 200 și aceeași clasă de oțel S 355. Au fost investigate patru condiții diferite la reazeme (FF; PP; FP; FF), fiecare cu valori variabile ale zvelteții relative a stâlpului (0,5; 1,0; 1,5). Rezistența la flambaj în direcția ambelor axe principale este verificată.
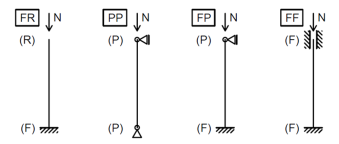
Fig. 1: Diverse condiții la reazeme utilizate pentru verificare
Toate cazurile sunt desemnate în felul următor: „FR_0.5_Y", unde „FR" indică condițiile la reazeme, „0.5" zvelteța relativă, iar „Y" axa de flambaj.
3. Imperfecțiuni inițiale
Trei abordări au fost utilizate pentru calculul imperfecțiunii inițiale a unui stâlp la compresiune. Acestea sunt desemnate A, B și C.
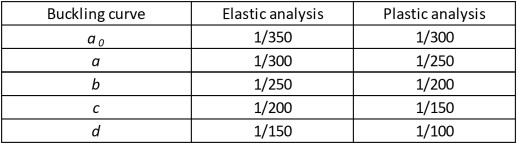
Abordarea A – conform EN 1993-1-1:2005, Tabelul 5.1
Tab. 1: Valoarea de calcul a imperfecțiunii inițiale de săgeată e0/L pentru elemente
Abordarea B – conform prEN 1993-1-1:2020, al doilea proiect [2], Clauza 5.3.3.1
\[ \frac{e_0}{L}=\frac{α}{ε} \beta \]
unde:
- e0 – imperfecțiunea inițială
- α – factorul de imperfecțiune dependent de curba de flambaj relevantă conform EN 1993-1-1, Tabelul 6.1 [1]
\[\varepsilon = \sqrt{\frac{235}{f_y}}\]
- fy – limita de curgere a oțelului stâlpului [MPa]
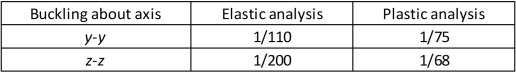
- β – imperfecțiunea relativă de referință conform Tabelului 2
- L – lungimea elementului
Tab. 2: Imperfecțiunea relativă de referință
Abordarea C – metoda EUGLI (Imperfecțiune Inițială Globală și Locală Echivalentă Unică) conform EN 1993-1-1:2005 [1], Clauza 5.3.2 (11).
\[ e_0=\alpha (\bar \lambda - 0.2) \frac{M_{Rk}}{N_{Rk}} \]
unde
- e0 – imperfecțiunea inițială
- α – factorul de imperfecțiune dependent de curba de flambaj relevantă conform EN 1993-1-1, Tabelul 6.1 [1]
- \( \bar \lambda \)– zvelteța relativă a elementului
- NRk – rezistența caracteristică la forță normală a secțiunii transversale
- MRk – rezistența caracteristică la moment încovoietor a secțiunii transversale
Această imperfecțiune inițială este apoi ajustată pe baza răspunsului în moment încovoietor al elementului la imperfecțiunea inițială în forma modului de flambaj elastic.
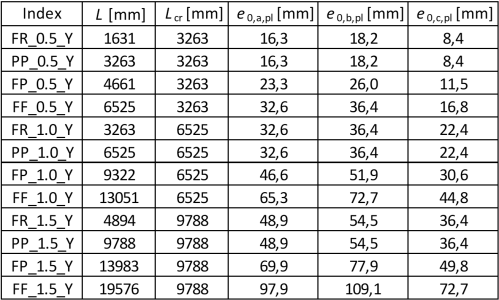
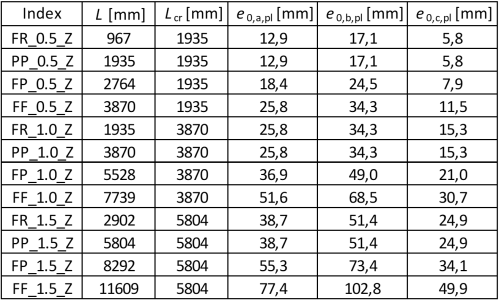
Tab. 3: Valorile rezultante ale imperfecțiunii inițiale – axa y-y
Tab. 4: Valorile rezultante ale imperfecțiunii inițiale – axa z-z
4. Soluția analitică
Următoarea abordare conform EN 1993-1-1 [1], Clauza 6.3 este utilizată pentru calculul rezistenței la flambaj a stâlpului:
\[ N_{cr} = \frac{\pi ^2 E I}{L_{cr}^2} \]
\[ \bar \lambda = \sqrt{\frac{A f_y}{N_{cr}}} \]
\[ \phi = 0.5 \left [1 + \alpha \left (\bar \lambda - 0.2 \right ) + \bar \lambda ^2 \right] \]
\[ \chi = \frac{1}{\phi + \sqrt{\phi^2 - \bar \lambda ^2}} \]
\[ N_{b,Rd} = \frac{\chi A f_y}{\gamma_{M1}} \]
5. Rezultate
Rezistențele ultime (pentru imperfecțiunile inițiale A, B, C) din IDEA Member sunt comparate cu valoarea analitică pentru o secțiune transversală laminată (EN) și pentru reprezentarea acesteia fără razele inimă-talpă (Ew).
5.1 Flambaj după axa tare
Rezultatele pentru flambajul după axa tare sunt rezumate în tabelul de mai jos.
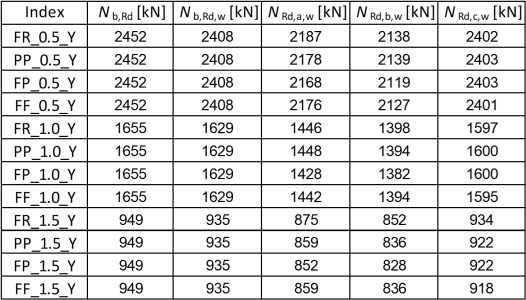
Tab. 5: Valorile rezultante ale rezistenței – axa y-y
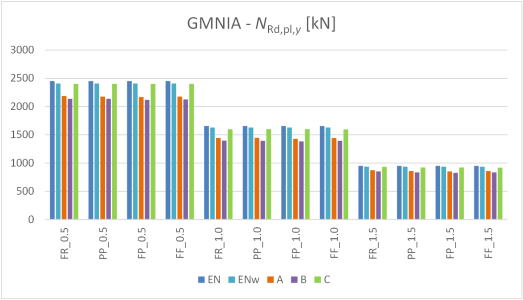
Grafic 1: Valorile rezultante ale rezistenței – axa y-y
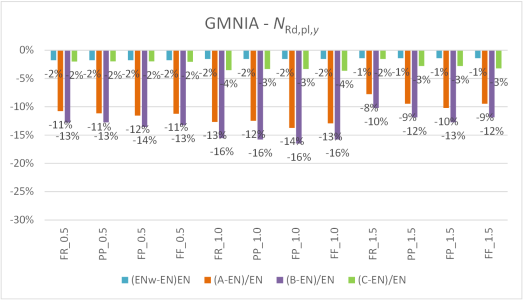
Grafic 2: Compararea rezistențelor rezultante – axa y-y
Rezultatele GMNIA sunt conservative față de soluția Eurocode. Aceasta se datorează parțial modelării secțiunii transversale în IDEA Member, această influență fiind sub 2%, după cum se poate observa din valorile coloanelor albastre din graficul de mai sus.
Alegerea imperfecțiunii inițiale joacă un rol major în rezistența rezultantă. Metoda C este doar ușor conservativă (< 4%), în timp ce metodele A și B furnizează rezistențe cu 10–16% mai mici față de soluția analitică Eurocode.
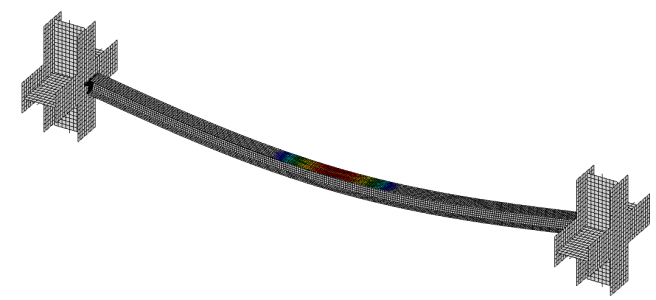
Fig. 2: Stâlpul PP_1.0_Y la limita de rezistență și deformația plastică a tălpii
5.2. Flambaj după axa slabă
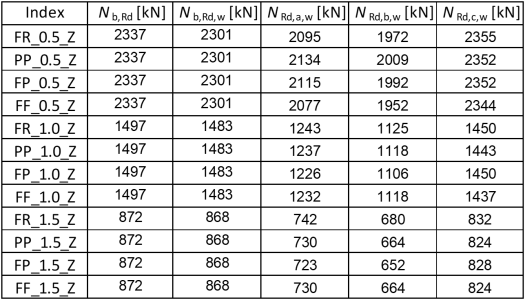
Rezultatele pentru flambajul după axa slabă sunt rezumate în tabelul de mai jos.
Tab. 6: Valorile rezultante ale rezistenței – axa z-z
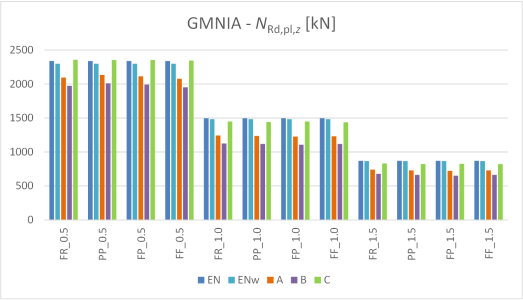
Grafic 3: Valorile rezultante ale rezistenței – axa z-z
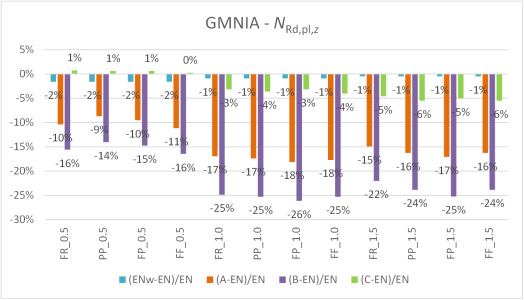
Grafic 4: Compararea rezistențelor rezultante – axa z-z
Din nou, rezultatele sunt conservative față de soluția Eurocode. Influența modelării secțiunii transversale este sub 2%, după cum se poate observa din valorile coloanelor albastre din graficul de mai sus.
Imperfecțiunea inițială aleasă conform metodei C furnizează rezultate doar ușor conservative (< 6%), în timp ce metodele A și B dau rezistențe cu 10–26% mai mici față de soluția analitică Eurocode.
6. Bibliografie și referințe
[1] EN 1993-1-1: Eurocode 3: Design of steel structures – Part 1-1: General rules and rules for buildings, CEN, 2005.
[2] prEN 1993-1-1: Eurocode 3: Design of steel structures – Part 1-1: General rules and rules for buildings, second draft, CEN, 2017.