
วิธีเริ่มต้นใช้งาน API - การปรับแต่งชิ้นส่วนในจุดต่อให้เหมาะสมที่สุด 04
ขั้นตอนแรก
เราแนะนำให้ศึกษาบทช่วยสอน วิธีเริ่มต้นใช้งาน API - พื้นฐาน 01 ซึ่งจะสอนคุณเกี่ยวกับ API และวิธีตั้งค่าสภาพแวดล้อม
ไฟล์ Connection
ตัวอย่างนี้อ้างอิงจากไฟล์ที่สร้างขึ้นในบทช่วยสอน วิธีเริ่มต้นใช้งาน API - นำเข้าแม่แบบและรันการคำนวณ 03
กรุณาดาวน์โหลดไฟล์ tutorial 03 with template-new.ideaCon
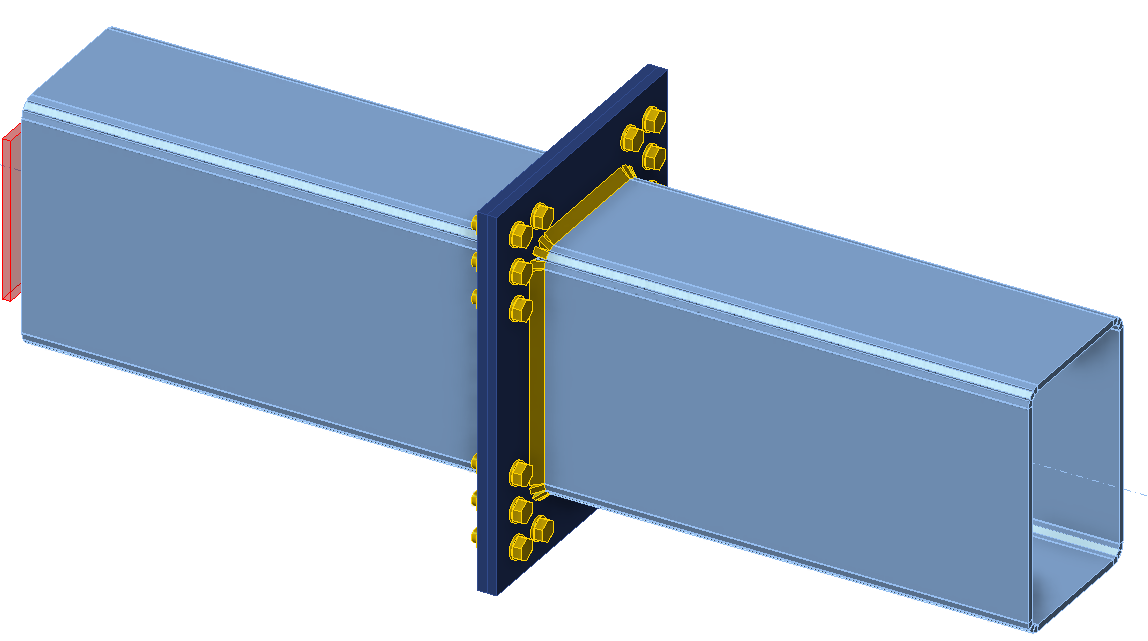
เราต้องการปรับแต่งชิ้นส่วนของการเชื่อมต่อ (รอยเชื่อม, เส้นผ่านศูนย์กลาง และจำนวนสลักเกลียว) ให้เหมาะสมที่สุด ผลลัพธ์ของการปรับแต่งคือต้นทุนของจุดต่อ ซึ่งแสดงอย่างเป็นระเบียบในรูปแบบกราฟ
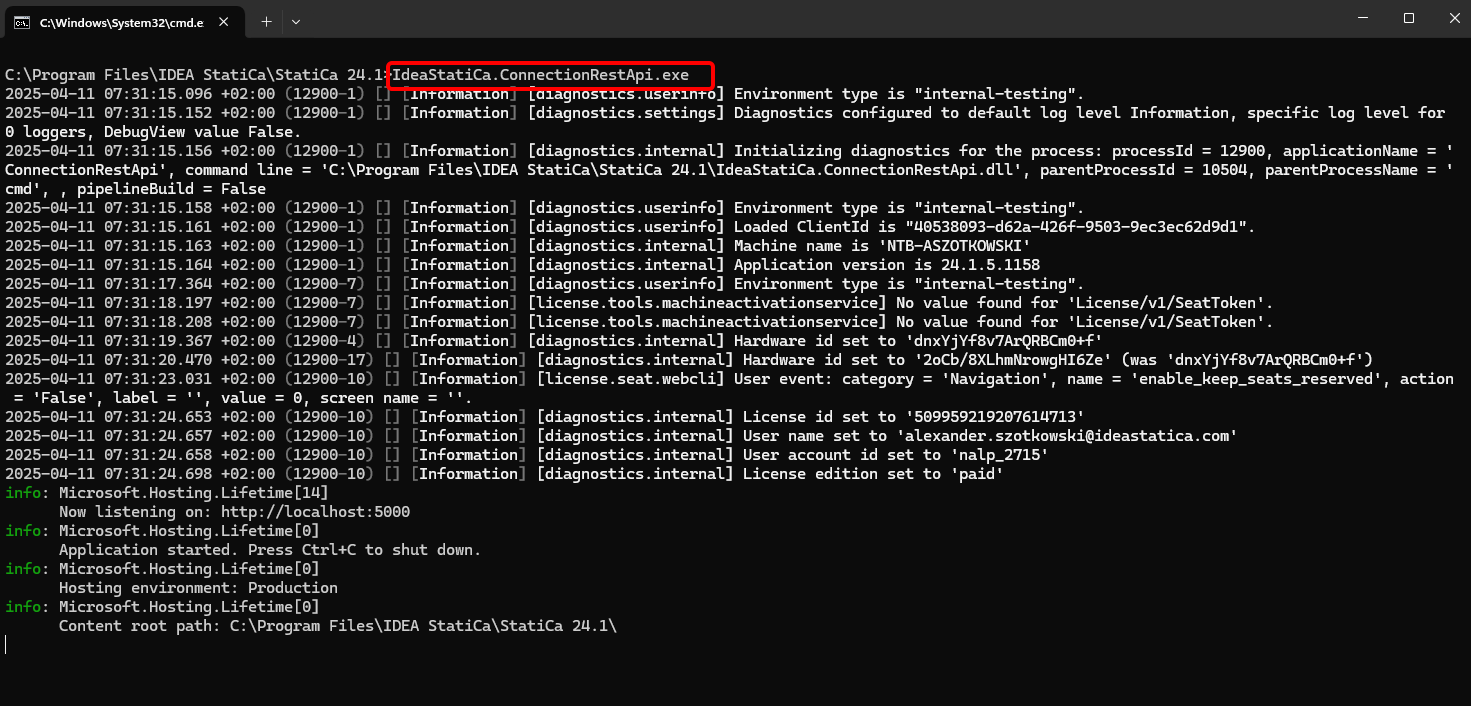
Python client
รัน "IdeaStatiCa.ConnectionRestApi.exe" ใน CMD ภายในโฟลเดอร์ IDEA StatiCa ที่เหมาะสม และเปิดเครื่องมือ IDE ที่คุณต้องการ
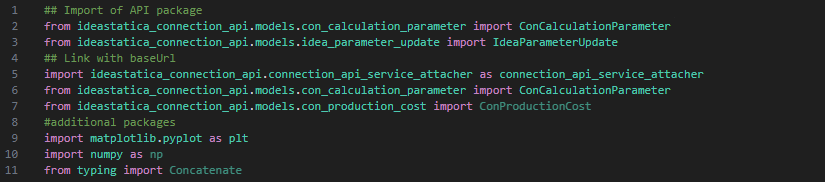
- สร้างไฟล์ใหม่และ นำเข้าแพ็กเกจ ที่จะเปิดใช้งานการคำนวณและเชื่อมต่อกับ localhost URL
Source code:
## Import of API package
from ideastatica_connection_api.models.con_calculation_parameter import ConCalculationParameter
## Link with baseUrl
import ideastatica_connection_api.connection_api_service_attacher as connection_api_service_attacher
from ideastatica_connection_api.models.con_calculation_parameter import ConCalculationParameterfrom ideastatica_connection_api.models.con_production_cost import ConProductionCost
#additional packages
import matplotlib.pyplot as plt
import numpy as np
from typing import Concatenate
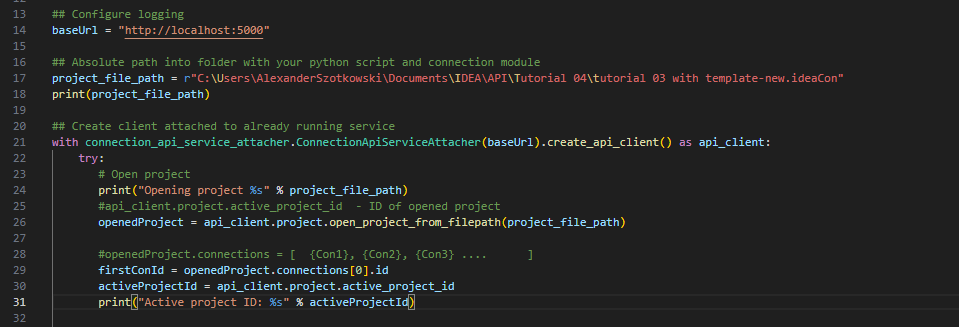
- กำหนดค่า logging ผ่านตัวแปร "baseUrl" ซึ่งจะดึง localhost ของคุณขึ้นมา ในขั้นตอนที่สอง ให้จับคู่เส้นทางสัมบูรณ์ของไฟล์ IDEA StatiCa Connection ของคุณ
## Configure logging
baseUrl = "http://localhost:5000"
## Absolute path into folder with your python script and connection module
project_file_path = r"C:\Users\AlexanderSzotkowski\Documents\IDEA\API\Tutorial 04\tutorial 03 with template -new.ideaCon"
print(project_file_path)
- จับคู่ client กับ service ที่กำลังทำงานอยู่แล้ว ใช้บล็อก try/except - เนื่องจากบล็อก try ทำให้เกิดข้อผิดพลาด บล็อก except จะถูกดำเนินการ ในระยะแรก จำเป็นต้องเปิดโปรเจกต์และค้นหา project ID ของโปรเจกต์คุณ ซึ่งมีความเฉพาะตัวสำหรับทุกโปรเจกต์ IDEA StatiCa จากนั้นเราเลือก connection แรกที่จัดเก็บในไฟล์ของเรา
# Create a client attached to an already running service
with connection_api_service_attacher.ConnectionApiServiceAttacher(baseUrl).create_api_client() as api_client:
try:
# Open project
print("Opening project %s" % project_file_path)
#api_client.project.active_project_id - ID of opened project
openedProject = api_client.project.open_project_from_filepath(project_file_path)
#openedProject.connections = [ {Con1}, {Con2}, {Con3} .... ]
firstConId = openedProject.connections[0].id
activeProjectId = api_client.project.active_project_id
print("Active project ID: %s" % activeProjectId)
- ดึงพารามิเตอร์ที่จำเป็นทั้งหมดจาก ideaCon (จำนวนสลักเกลียว, เส้นผ่านศูนย์กลาง, ขนาดรอยเชื่อม, ชุดสลักเกลียว)
#get parameters from ideaCon file
include_hidden = True
parameters = api_client.parameter.get_parameters(activeProjectId, firstConId, include_hidden=include_hidden)
#get default values from the ideaCon file
#Diameter of the bolt
boltParameter = parameters[3]
#print('bolt ',boltParameter.value)
#Number of bolt rows
rowParameter = parameters[11]
#print('row ',rowParameter.value)
#Weld size
weldParameter = parameters[28]
#print('weld ',weldParameter.value)
#Bolt assembly
boltAssemblyParameter = parameters[29]
#print('bolt assembly ',boltAssemblyParameter.value)
- เราต้องการรับผลลัพธ์เฉพาะเมื่อการคำนวณเป็นบวก 100% สำหรับทุกชิ้นส่วน (แผ่นเหล็ก, รอยเชื่อม, สลักเกลียว) ดังนั้นเราต้องตั้งค่า Stop at the limit strain เป็น True ผลลัพธ์จะถูกจัดเก็บในรายการที่เรียกว่า matrix ซึ่งเราใช้เพื่อแสดงกราฟ
#setup
updateSettings = api_client.settings.get_settings(api_client.project.active_project_id)
from typing import Dict
updateSettings: Dict [str, object] = {
"calculationCommon/Analysis/AnalysisGeneral/Shared/StopAtLimitStrain@01" : True,
"calculationCommon/Checks/Shared/LimitPlasticStrain@01" : 0.05
}
api_client.settings.update_settings(api_client.project.active_project_id, updateSettings)
#Final results database
matrix = []

- ตอนนี้เราเริ่มวนรอบโดยเปลี่ยนรอยเชื่อม (จาก t = 8 ถึง 5 มม.), เส้นผ่านศูนย์กลางสลักเกลียว (จาก M16 ถึง M12) และจำนวนแถว (จาก 3 ถึง 1) ตัวเลข 8, M16 และ 3 เป็นค่าที่นำมาจากไฟล์ ideaCon ผลลัพธ์ที่กำลังดำเนินการจะแสดงบนหน้าจอและเพิ่มลงในรายการผลลัพธ์ด้วย
#cycling through welds with given rows and bolts
for row in range(rowParameter.value,1, -1):
#print ('Number of bolt rows is', row)
for bolt in range(int(1000*boltParameter.value), 12,-2):
for weld in range(int(1000*weldParameter.value), 5,-1):
par_row = IdeaParameterUpdate() # Create a new instance
par_row.key = rowParameter.key
par_row.expression = str(row)
par_bolt = IdeaParameterUpdate() # Create a new instance
par_bolt.key = boltParameter.key
par_bolt.expression = str(bolt/1000) # Decrement the expression
par_boltAssembly = IdeaParameterUpdate() # Create a new instance
par_boltAssembly.key = boltAssemblyParameter.key
par_boltAssembly.expression = str('M'+ str(bolt) + ' 8.8')
par_weld = IdeaParameterUpdate() # Create a new instance
par_weld.key = weldParameter.key
par_weld.expression = str(weld/1000) # Decrement the expression
updateResponse = api_client.parameter.update(activeProjectId, firstConId, [par_row, par_bolt, par_boltAssembly, par_weld] )
updateResponse.set_to_model
# Check if the parameters were updated successfully
if updateResponse.set_to_model == False:
print('Parameters failed: %s' % ', '.join(updateResponse.failed_validations))
#set the type of analysis
ConCalculationParameter.analysis_type = "stress_strain"
conParameter = ConCalculationParameter()
conParameter.connection_ids = [ firstConId ]
summary = api_client.calculation.calculate(activeProjectId, conParameter.connection_ids)
# Get results after calculation, store it in separate file and print the actual results
results = api_client.calculation.get_results(activeProjectId, conParameter.connection_ids)
CheckResSummary = results[0].check_res_summary
costs = api_client.connection.get_production_cost(api_client.project.active_project_id, firstConId)
api_client.project.download_project(activeProjectId, r'C:\Users\AlexanderSzotkowski\Documents\IDEA\API\Tutorial 04\tutorial 03 with template-updated.ideaCon')
if CheckResSummary[0].check_status == False:
break
if CheckResSummary[0].check_status == True:
print (row,'rows of', bolt, 'bolts', 'and weld size ',par_weld.expression,' results are OK. Costs: ', costs.total_estimated_cost)
values= [row, bolt,par_weld.expression,costs.total_estimated_cost]
#print(values)
matrix.append(values)
else:
print ('Iteration %i failed' % weld)
else:
print ('Iteration %i for weld failed' % weld)
else:
print ('Iteration %i for bolts failed' % bolt)
else:
print ('Iteration %i for rows failed' % row)

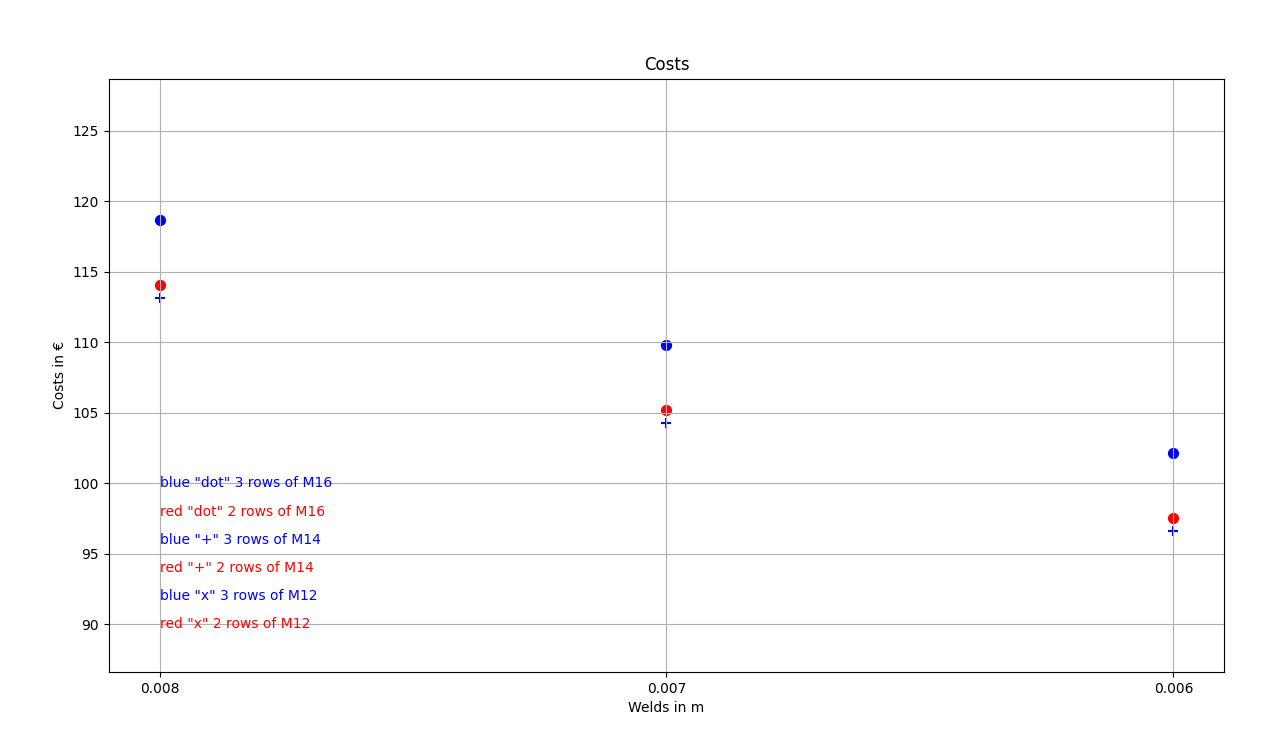
- ส่วนสุดท้ายเกี่ยวกับการสร้างกราฟจากผลลัพธ์ของเรา
#Create graph with results
# Extracting values from the matrix
flat = [x for row in matrix for x in row]
rows = flat[0::4]
#print('rows', rows)
diameter = flat[1::4]
#print('diammeter', diameter)
weld = flat[2::4]
#print('weld', weld)
costs = flat[3::4]
#print('costs', costs)
s = 50
fig, ax = plt.subplots( )
# Use a loop to plot each point with a different marker based on diameter and number of rows
for weldi, costsi, rowsi, diameteri in zip(weld, costs, rows, diameter):
if diameteri == 16 and rowsi == 3:
marker_style = 'o'
col = 'blue'
elif diameteri == 16 and rowsi == 2:
marker_style = 'o'
col = 'red'
elif diameteri == 14 and rowsi == 3:
marker_style = '+'
col = 'blue'
elif diameteri == 14 and rowsi == 2:
marker_style = '+'
col = 'red'
else:
marker_style = 'D'
col = 'black'
ax.scatter(weldi, costsi, s, marker=marker_style, c=col)
ax.set_ylim([min(costs)-10, max(costs)+10])
#ax.legend()
plt.text(0, 90, 'red "x" 2 rows of M12', fontsize=10, color='red', ha='left', va='center')
plt.text(0, 92, 'blue "x" 3 rows of M12', fontsize=10, color='blue', ha='left', va='center')
plt.text(0, 94, 'red "+" 2 rows of M14', fontsize=10, color='red', ha='left', va='center')
plt.text(0, 96, 'blue "+" 3 rows of M14', fontsize=10, color='blue', ha='left', va='center')
plt.text(0, 98, 'red "dot" 2 rows of M16', fontsize=10, color='red', ha='left', va='center')
plt.text(0, 100, 'blue "dot" 3 rows of M16', fontsize=10, color='blue', ha='left', va='center')
ax.set_title("Costs")
ax.set_ylabel('Costs in €')
ax.set_xlabel('Welds in m')
ax.axhline(0, color='grey', linewidth=0.8)
ax.grid(True)
plt.show()
ดังที่คุณเห็น ในกรณีนี้โดยเฉพาะ จุดต่อที่ประหยัดที่สุดคือจุดต่อที่มีรอยเชื่อม 6 มม. และสลักเกลียว M14 สามแถว
Attached Downloads
- tutorial 04 - 3 optimize bolts and welds.py (PY, 9 kB)
- tutorial 03 with template-new.ideaCon (IDEACON, 59 kB)