Algemene beschrijving van UGT-resultaten in de Detail applicatie
In dit gedeelte richten we ons op de Sterkte en de Verankering (UGT-normtoetsingen). Let op dat er een nieuw tabblad (Resultaten) in het bovenste lint verschijnt na het kiezen van een van de UGT-normtoetsingen.
Aan de linkerkant kunt u kiezen of u resultaten wilt weergeven voor een automatisch extreem, een bepaalde UGT-combinatie of incrementen. Houd er rekening mee dat een niet-lineaire berekening wordt gebruikt (plastische rekken zijn toegestaan voor staal en beton). Alleen UGT-combinaties of afzonderlijke belastinggevallen worden in aanmerking genomen.
De volgende knoppen zijn bedoeld om te schakelen tussen de huidige resultaten.
De laatste knoppen in het tabblad Resultaten worden gebruikt om de grafische uitvoer te bewerken (het tekenen van de mesh, de schaal van de weergave of het weergeven van het extreem).
Beton
We kunnen zes mogelijke resultaten waarnemen. Laten we ze één voor één bekijken.
Spanningstoetsingswaarde
De eerste waarde geeft het niveau van materiaalbenutting weer ten opzichte van de betonsterkte. Met andere woorden, het toont de verhouding van betonspanning en betonsterkte. Lees over hoe de grenswaarden worden bepaald in het volgende artikel.
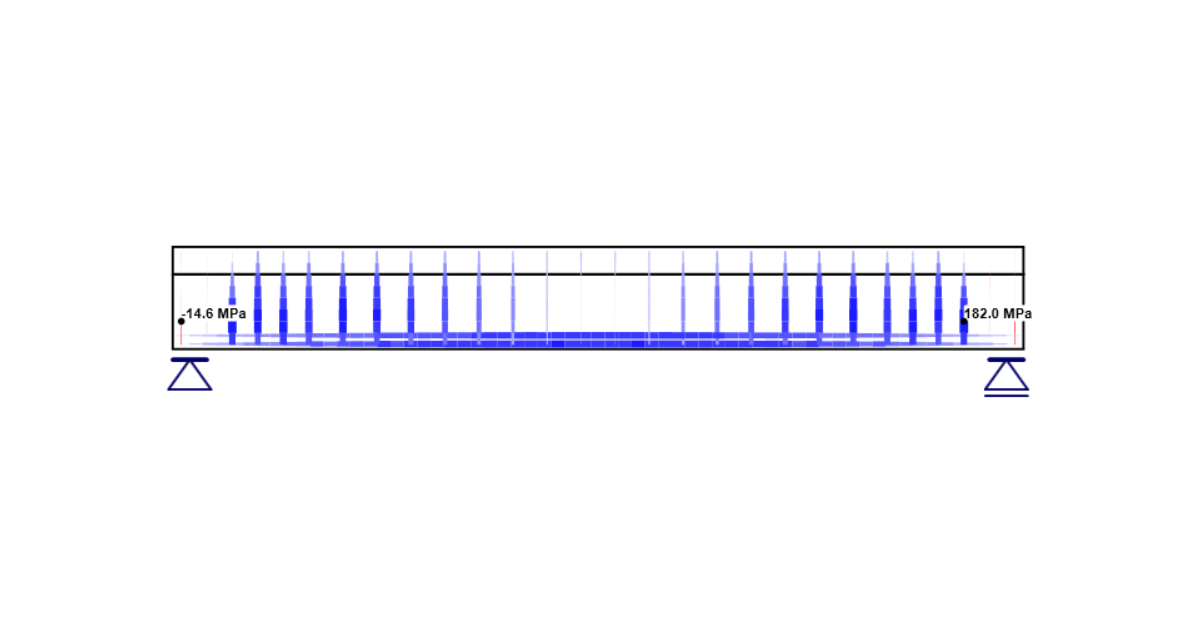
Drukspanning in beton
De volgende optie is het weergeven van de verdeling van de betonspanning σc voor een toegepast deel van de belasting. Ook bekend als hoofdspanningen σ2.
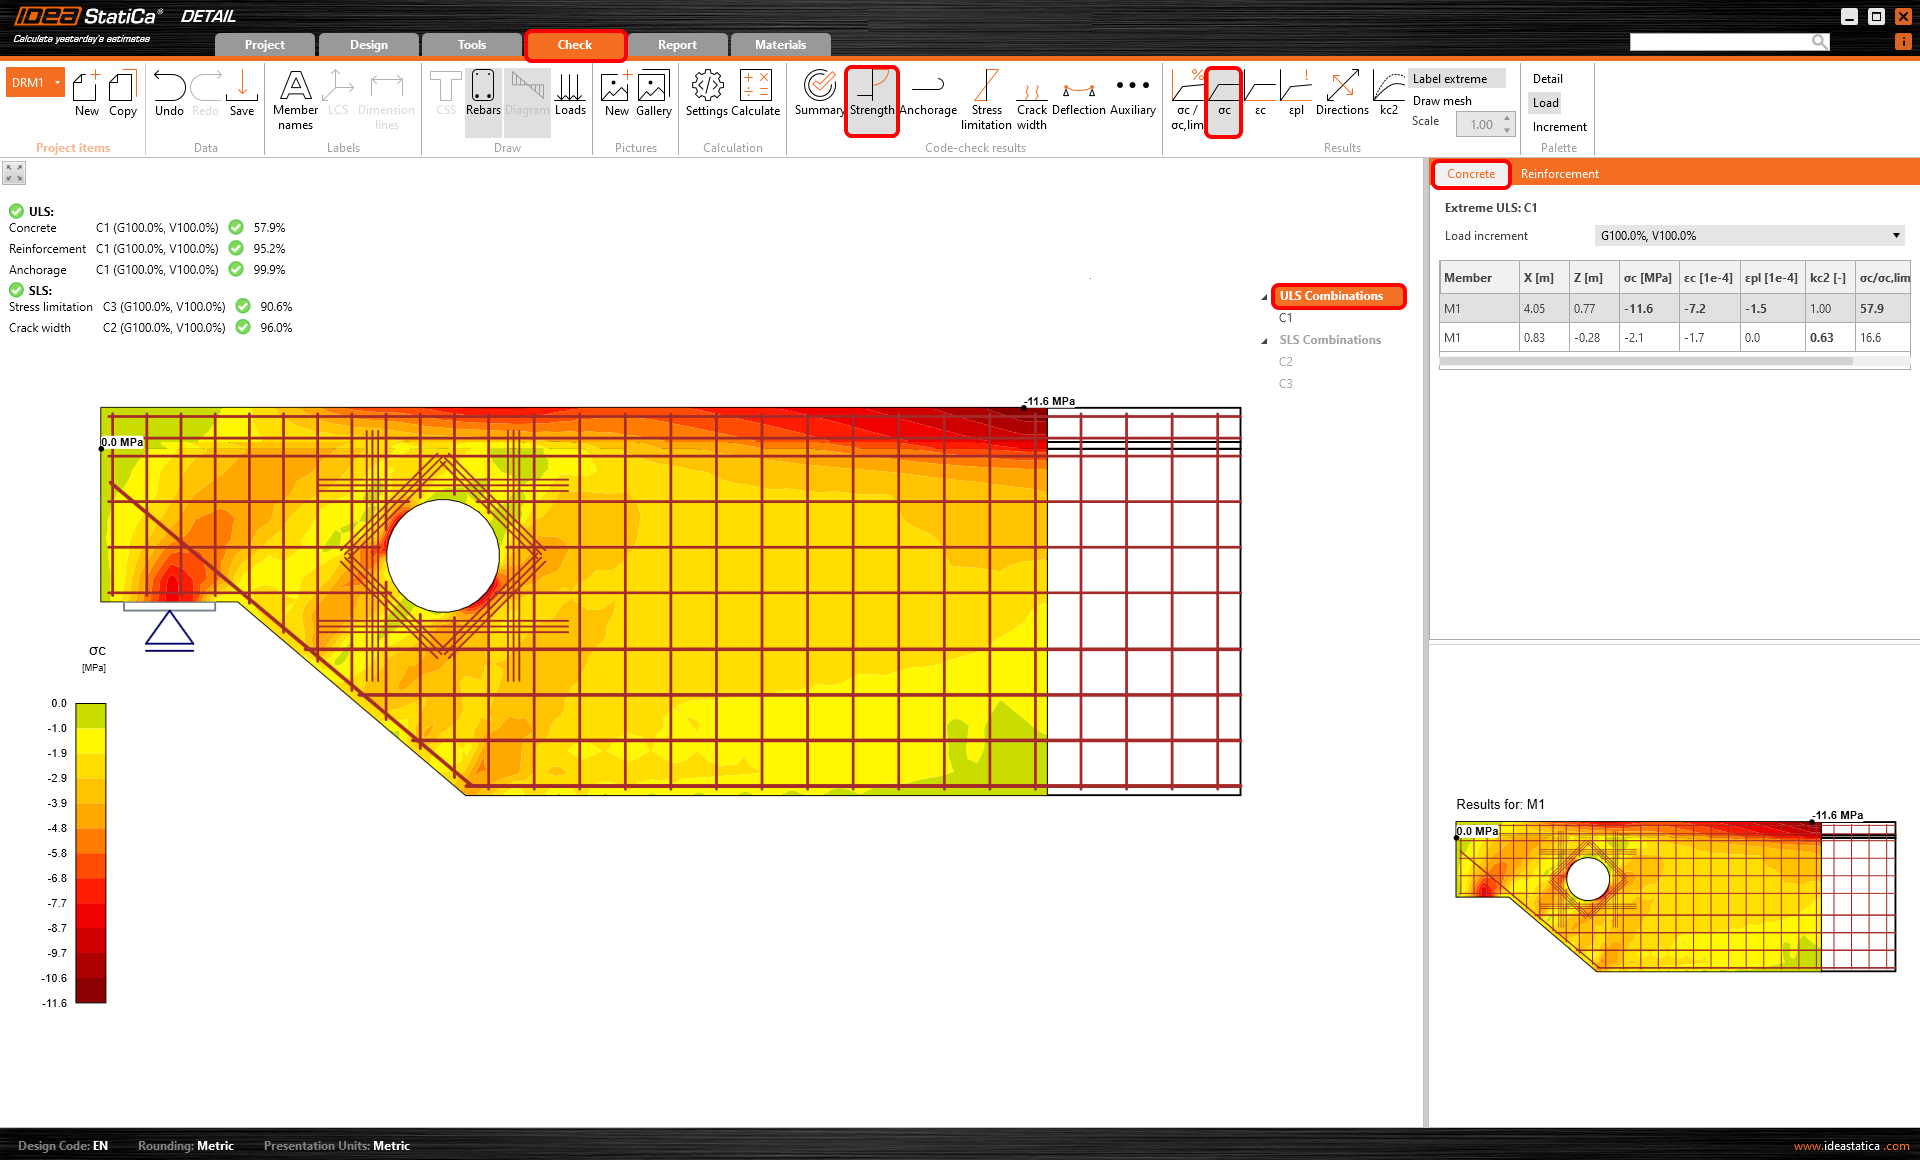
Drukrek in beton
Wanneer u op het derde pictogram in het resultaattabblad drukt, wordt de betonrek εc voor een toegepast deel van de belasting weergegeven. Ook bekend als hoofdrekken ε2.
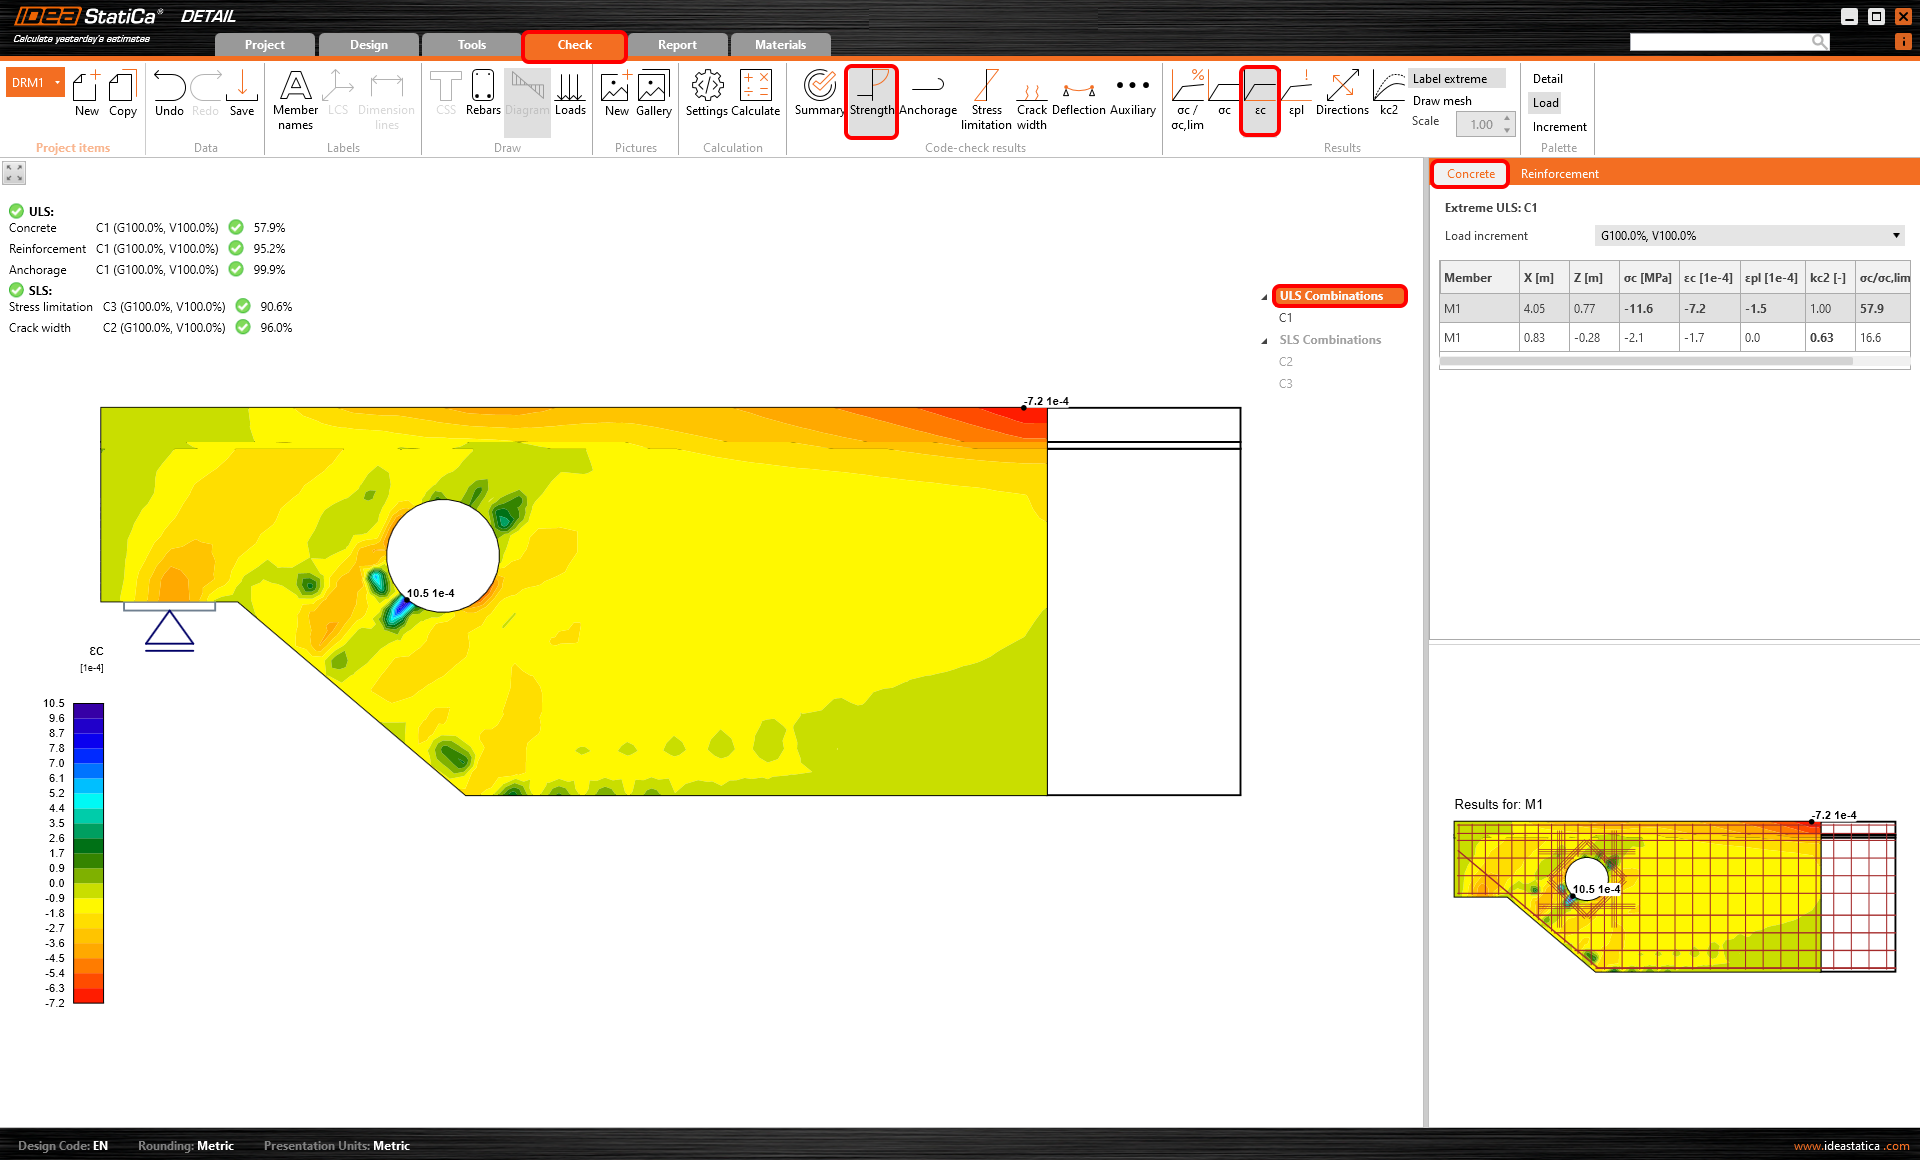
Plastische drukrek van beton
Om het optreden van plastisch gedrag in het beton te observeren, gaat u verder naar de Plastische drukrek van beton. U kunt de gebieden weergeven waar het beton zich in de plastische tak van het spanning-rek diagram bevindt.
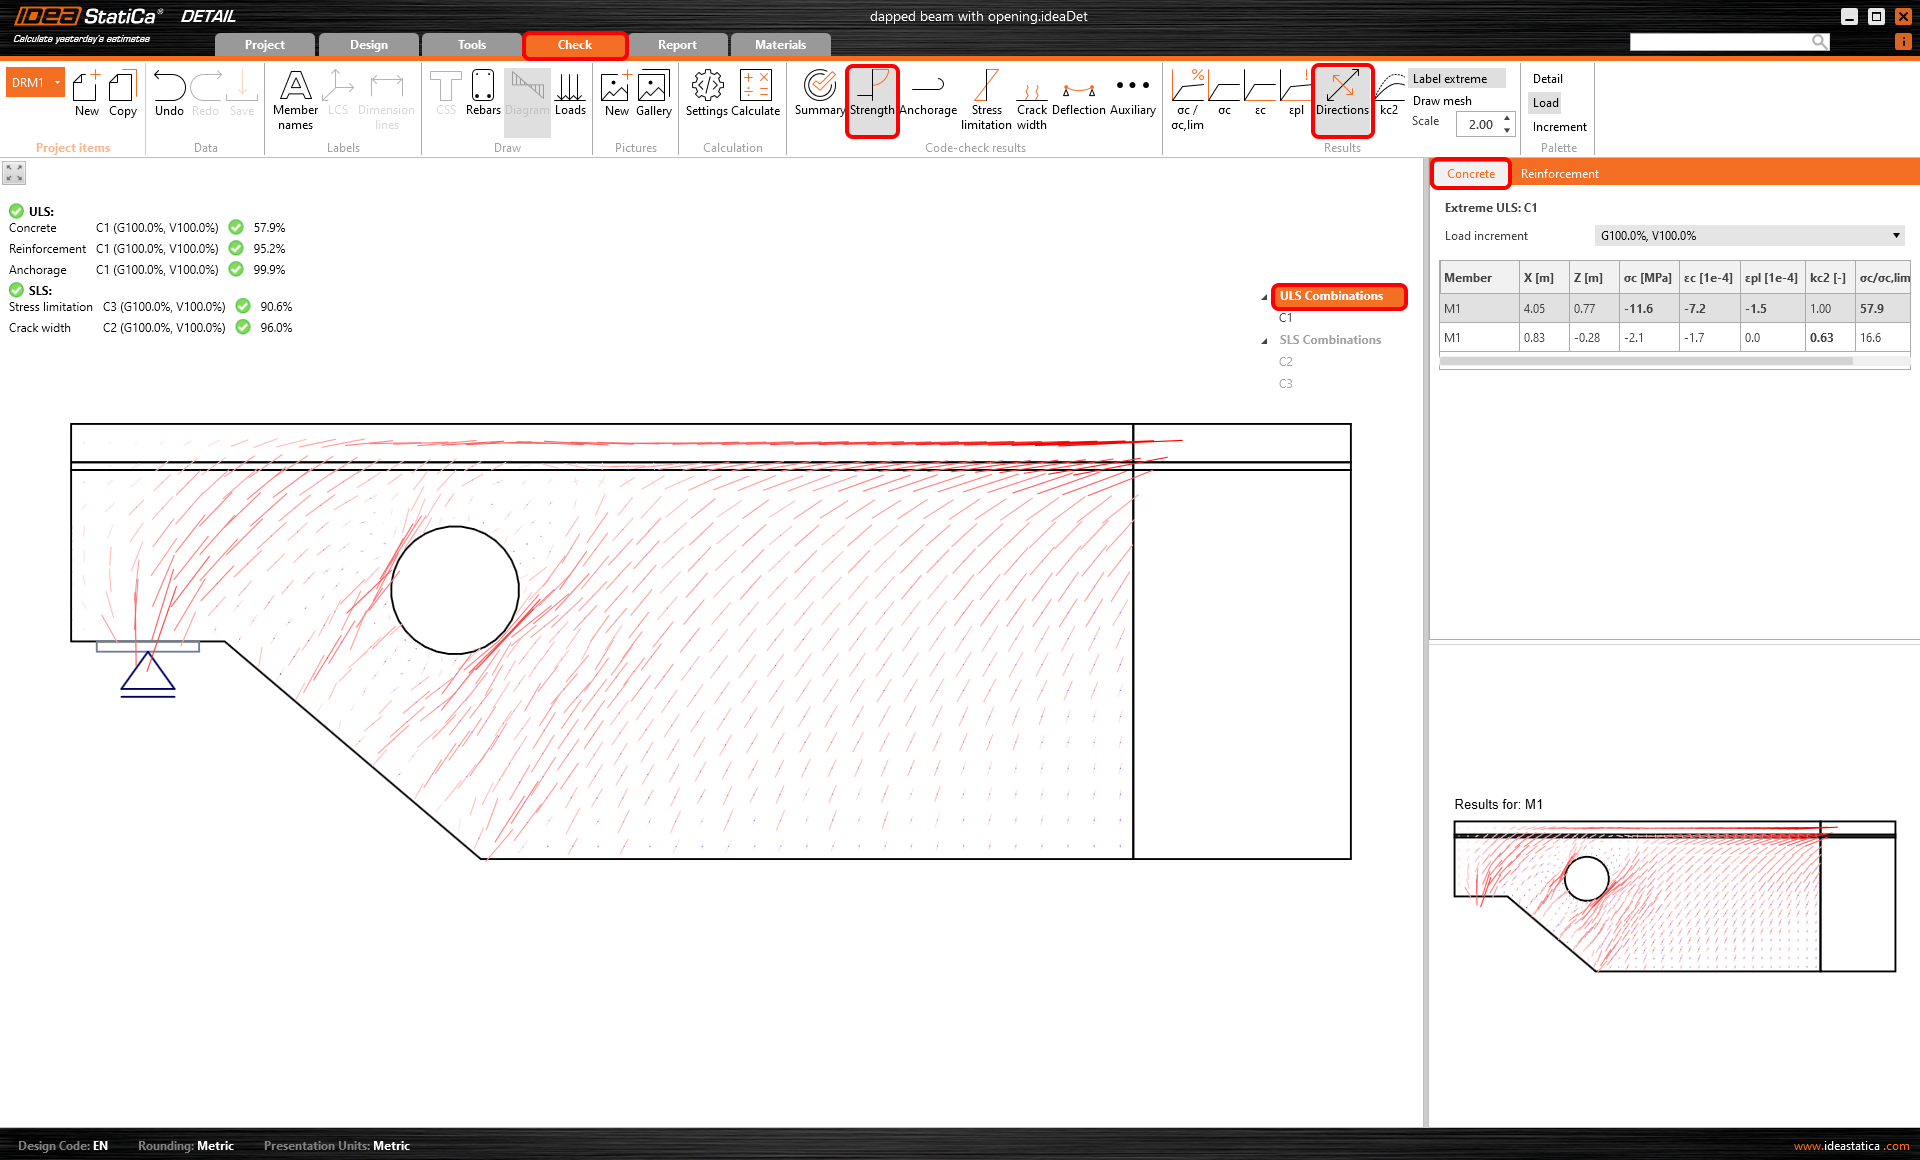
Richting van hoofdspanningen
Deze functionaliteit toont de richting van de hoofdspanningen. Omdat trek in beton is uitgesloten, worden alleen de drukvectoren weergegeven.
Reductiefactor voor druksterkte
De zesde optie toont de verdeling van de reductie van de betondruksterkte als gevolg van transversale rek. Dit is het compression softening effect. Dit verschijnsel (kc2), samen met de toenemende broosheid van beton met de sterkte, wordt in rekening gebracht via de factor kc.
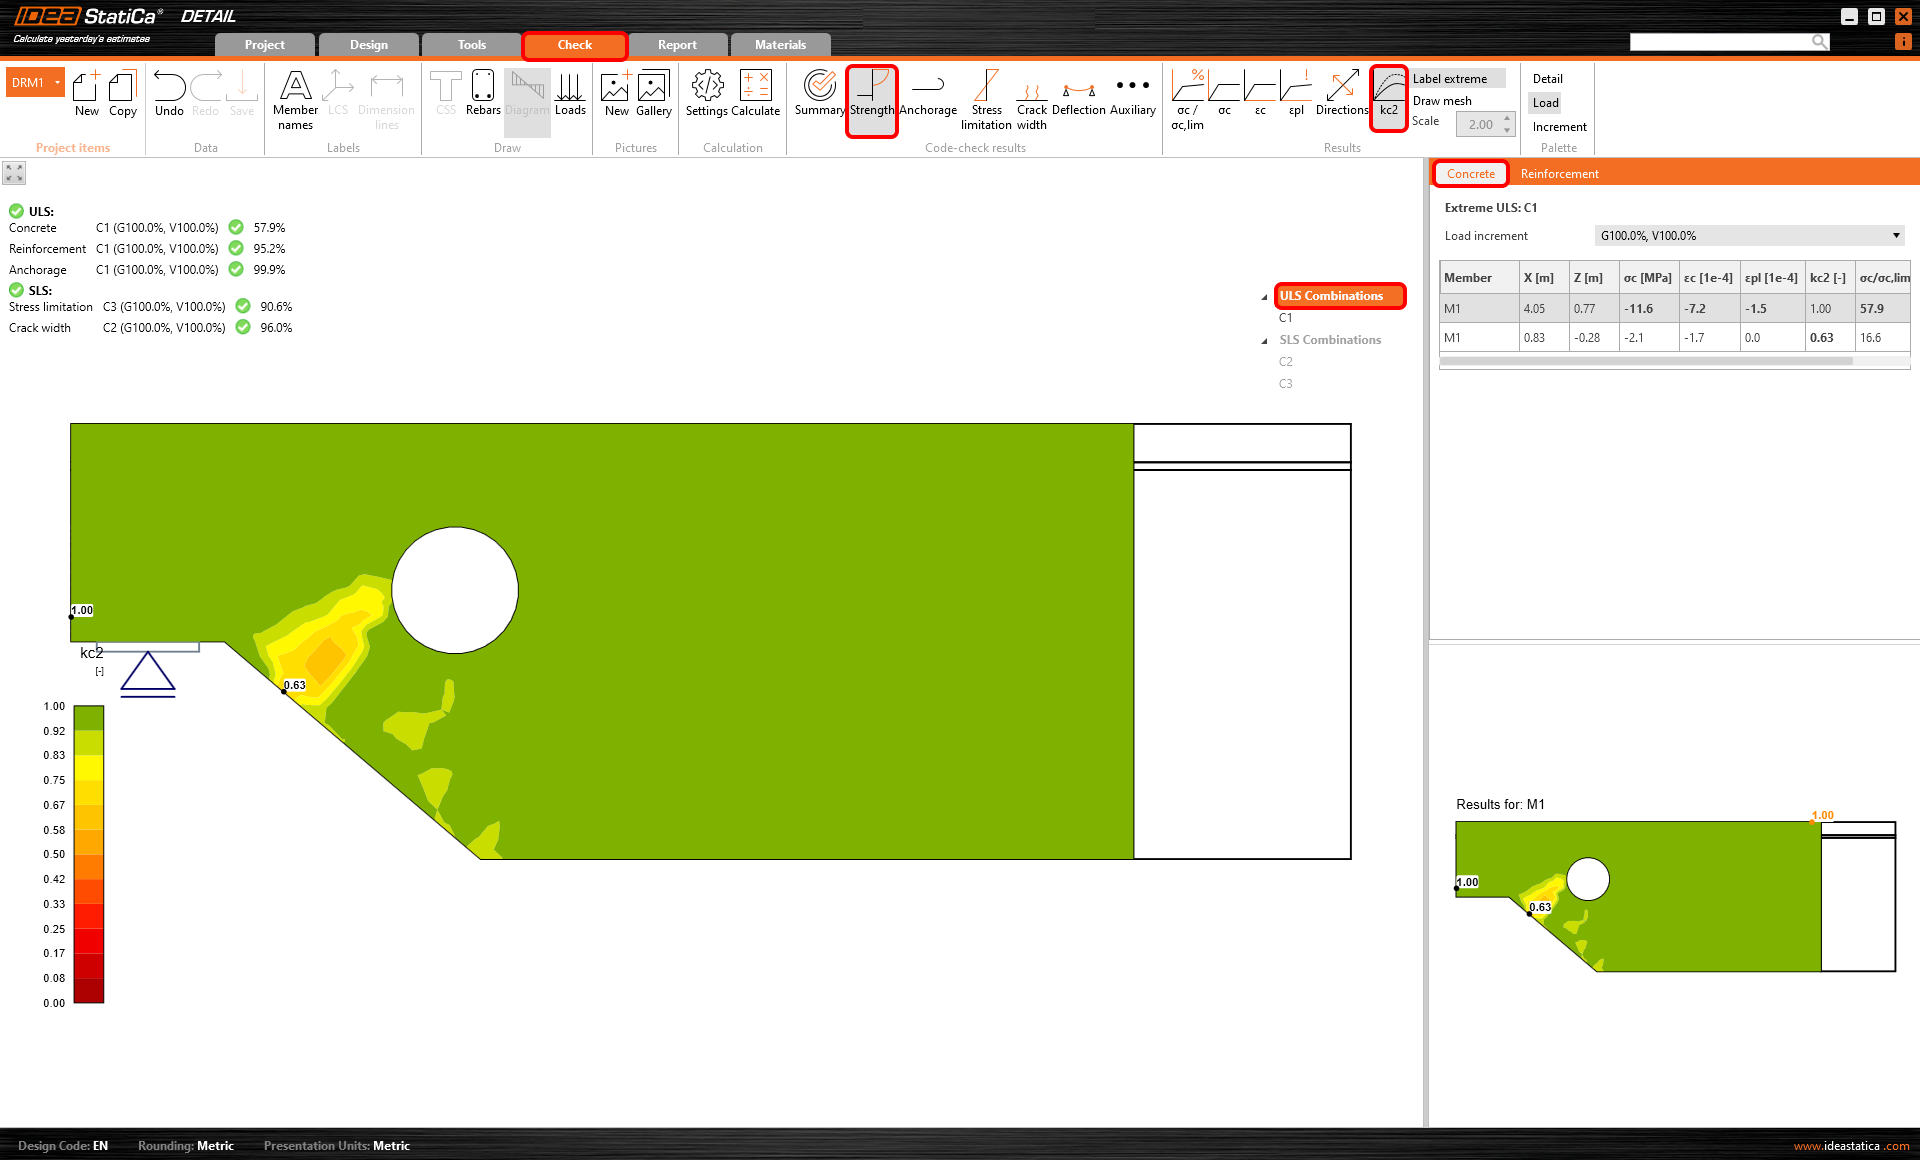
Lees voor meer informatie het artikel: Materiaalmodellen (EN).
Wapening
Voor staal hebben we, vergelijkbaar met beton, meer opties voor het weergeven van de resultaten. In het algemeen is het mogelijk om spanning en rek in de wapening weer te geven, evenals de verhouding van spanning of rek ten opzichte van de grenswaarden.
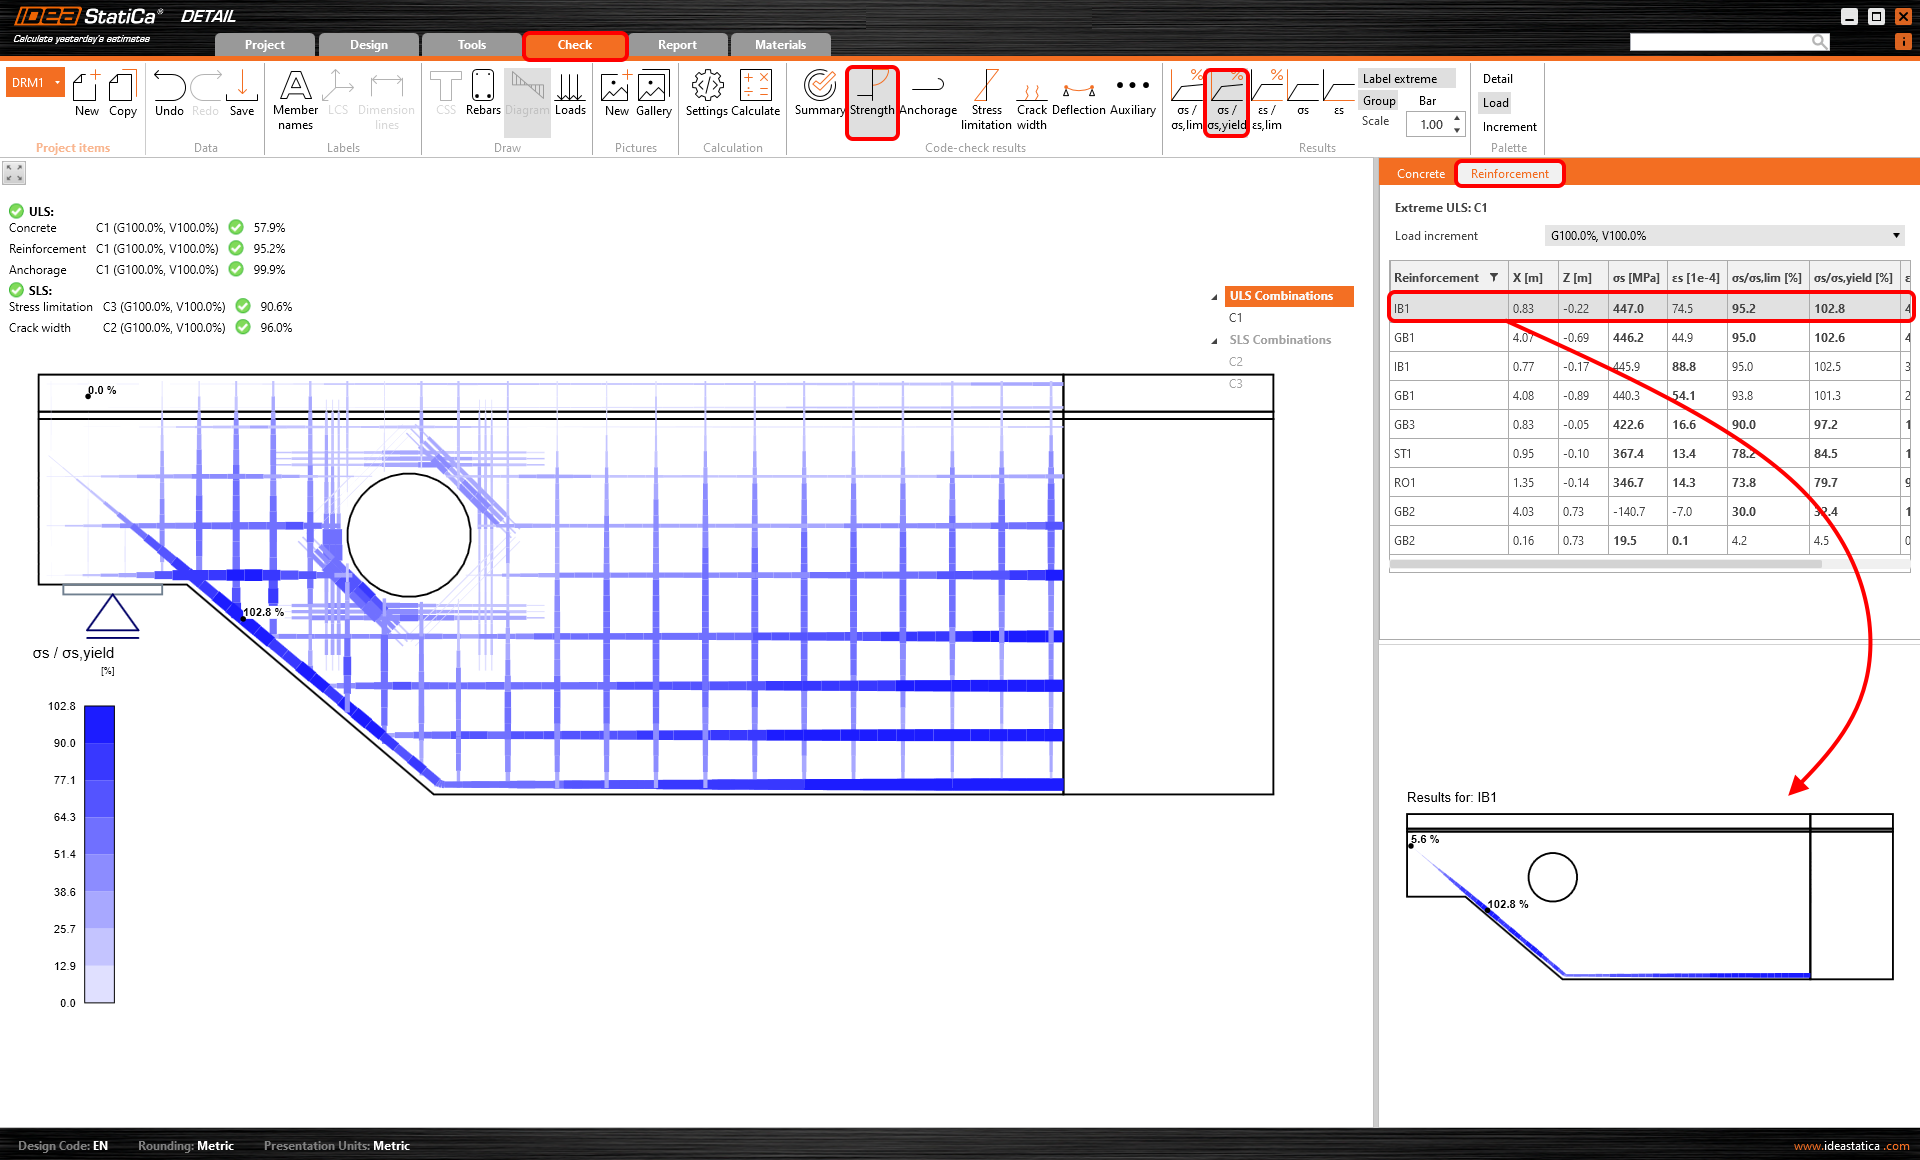
Verhouding van spanning of rek en grenswaarden
De eerste twee pictogrammen stellen u in staat de verhouding van spanning en rek ten opzichte van hun grenswaarden te controleren. Het derde pictogram toont een vergelijking van spanning en vloeigrens. Met andere woorden, u kunt het niveau van materiaalbenutting zien.
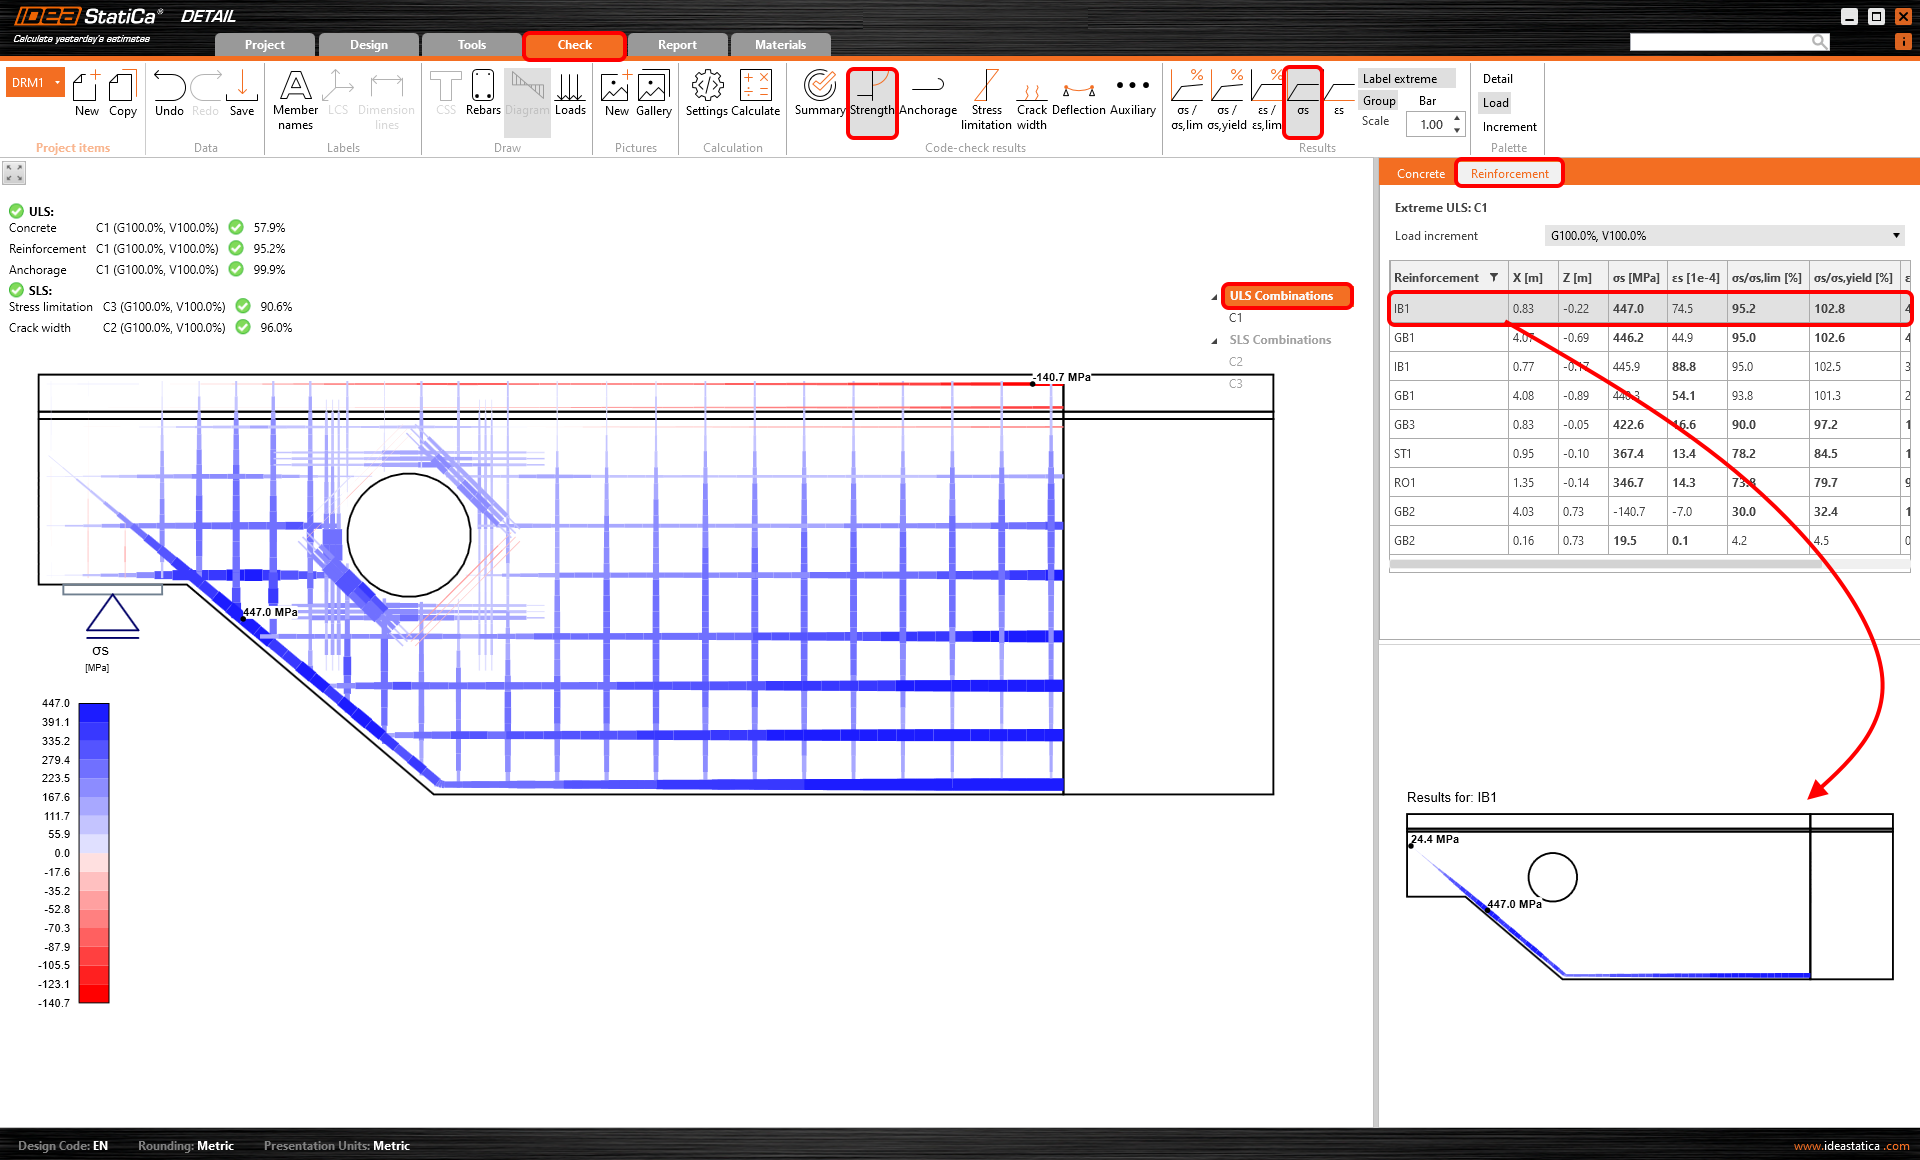
Spanning en rek
Naast de hierboven genoemde opties is er een mogelijkheid om de rek (εs) of de spanning (σ2) van de wapening weer te geven. In het gegevenstabblad kunt u de afzonderlijke staven één voor één bekijken. Of u kunt het model en het overzicht in het hoofdvenster controleren.
Verankering
Verankering is het laatste beschikbare resultaat voor UGT.
Om te begrijpen waar de krachten die de berekening ingaan vandaan komen, bespreken we eerst de afzonderlijke componenten.
Aanhechting spanning
De aanhechtingsspanning 𝜏b (spanning op het oppervlak van de wapeningsstaf) wordt berekend uit de vervorming van het aanhechtingselement dat de verbinding vertegenwoordigt tussen beton (2D-element) en wapening (1D-element). Deze relatie wordt uitgedrukt door de spanning-vervormingsfunctie, zie de onderstaande figuur.
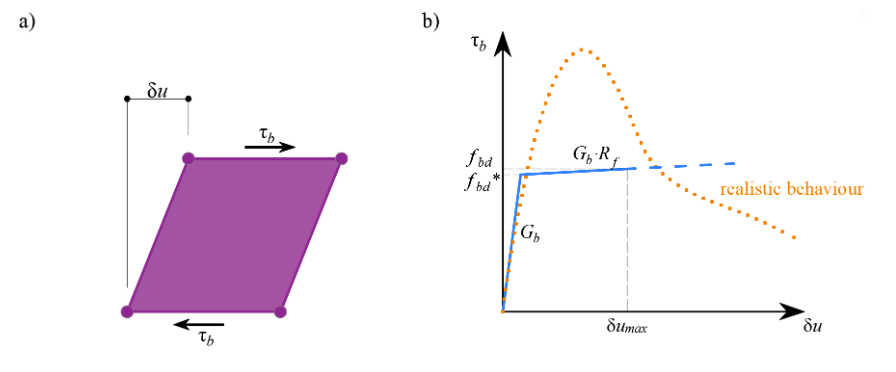
Merk op dat glijding is toegestaan.
fbd* - vloei-aanhechtingsspanning
fbd - grens-aanhechtingsspanning
Gb - afschuifstijfheid in het elastische deel
Rf - Coëfficiënt voor verharding
δu, max - Uiterste glijding
Zodra de plastische tak is bereikt - 𝜏b = fbd*, neemt de spanning (𝜏b) niet meer zo sterk toe in vergelijking met de vervorming (δu). Op dat punt (𝜏b = fbd*) krijgt u een aanhechtingsspanningsverhouding toetsing (𝜏b/fbd) boven 99 %. De toetsing slaagt totdat de grensvervorming δu, max is bereikt.
Verankeringskracht
De kracht die wordt overgedragen door de veer die het geselecteerde verankerings type van de wapening vertegenwoordigt, wordt de verankeringskracht genoemd. De maximale* verankeringskracht wordt berekend volgens de volgende formule - Fau=β⋅As⋅fyd, waarbij:
β de verankeringscoëfficiënt op basis van het verankeringstype,
As de doorsnede van de wapeningsstaf,
fyd de rekenwaarde van de vloeigrens van de wapening.
*De maximale kracht kan worden bereikt in de wapening bij volledige benutting. In werkelijkheid wordt de kracht die door de veer wordt overgedragen Fa berekend uit de werkelijke spanning in de wapening en wordt verder verminderd door de kracht die langs de lengte van de wapening wordt opgenomen, afhankelijk van het aanhechtingsmodel (cohesie) tussen beton en wapening.
Lees het volgende artikel voor meer theorie over verankering en om het aanhechtingsmodel te begrijpen:
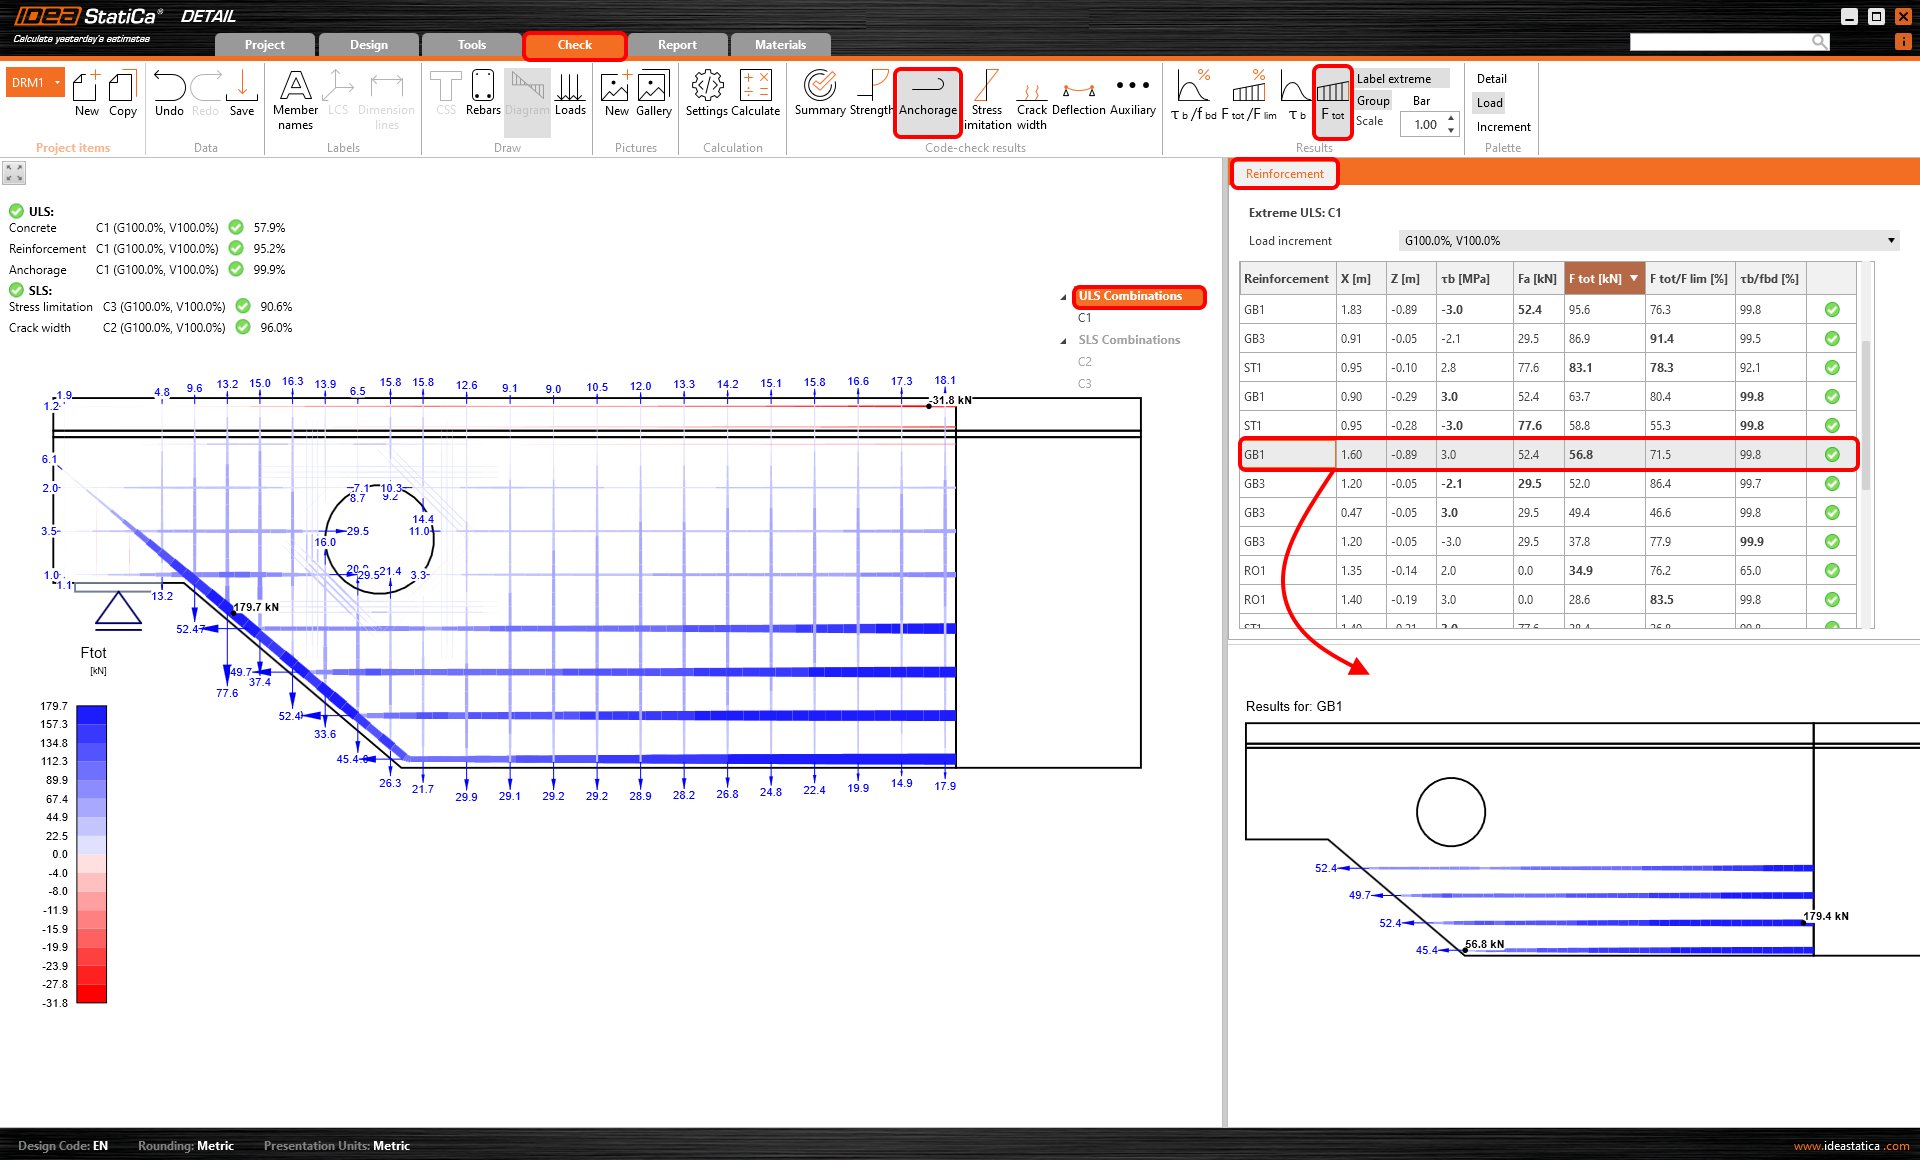
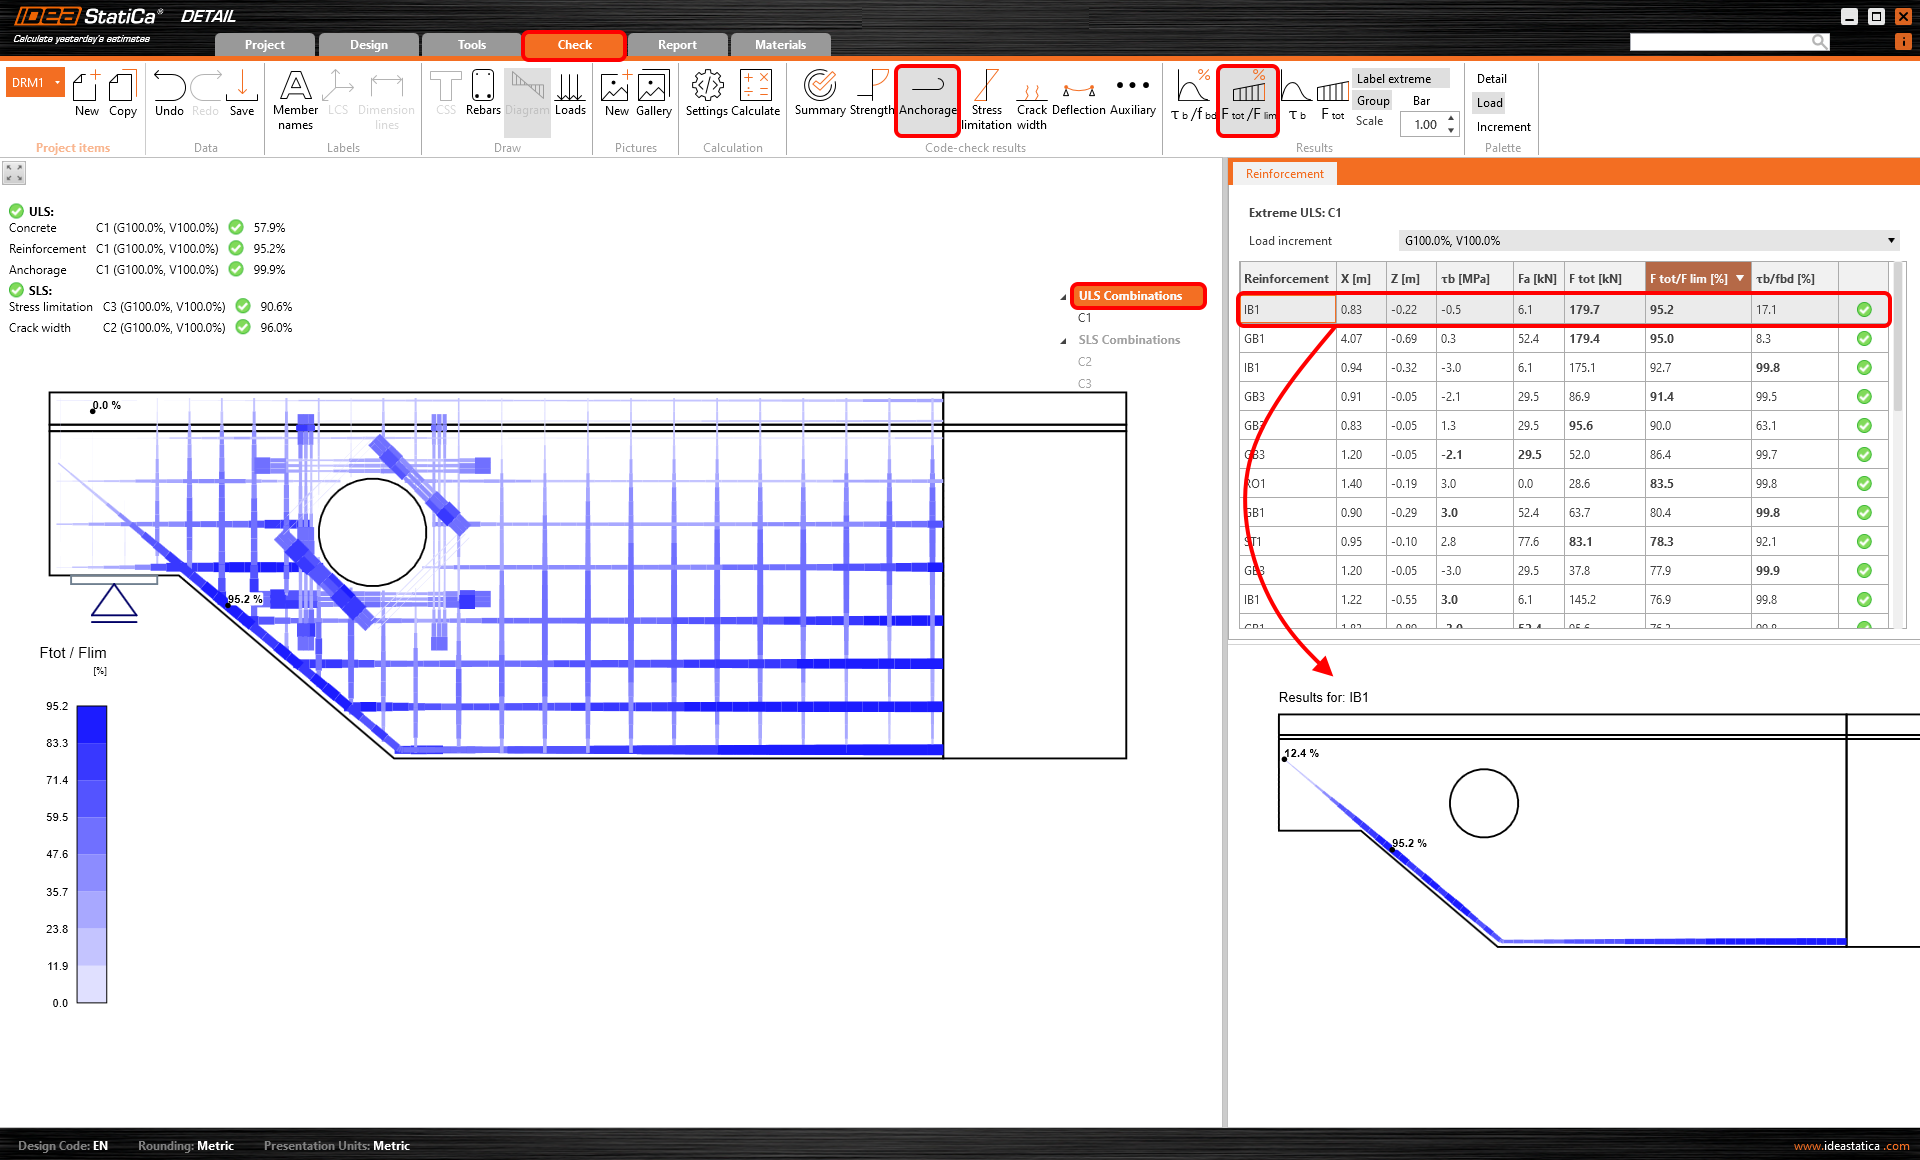
Totale kracht
De totale kracht Ftot is een resultaat van de Eindige Elementen Methode analyse en kan op twee manieren worden gedefinieerd.
\[F_{tot}=A_{s}\cdot \sigma_{s}\]
waarbij As de oppervlakte van de wapeningsstaf is en σs de spanning in de staf.
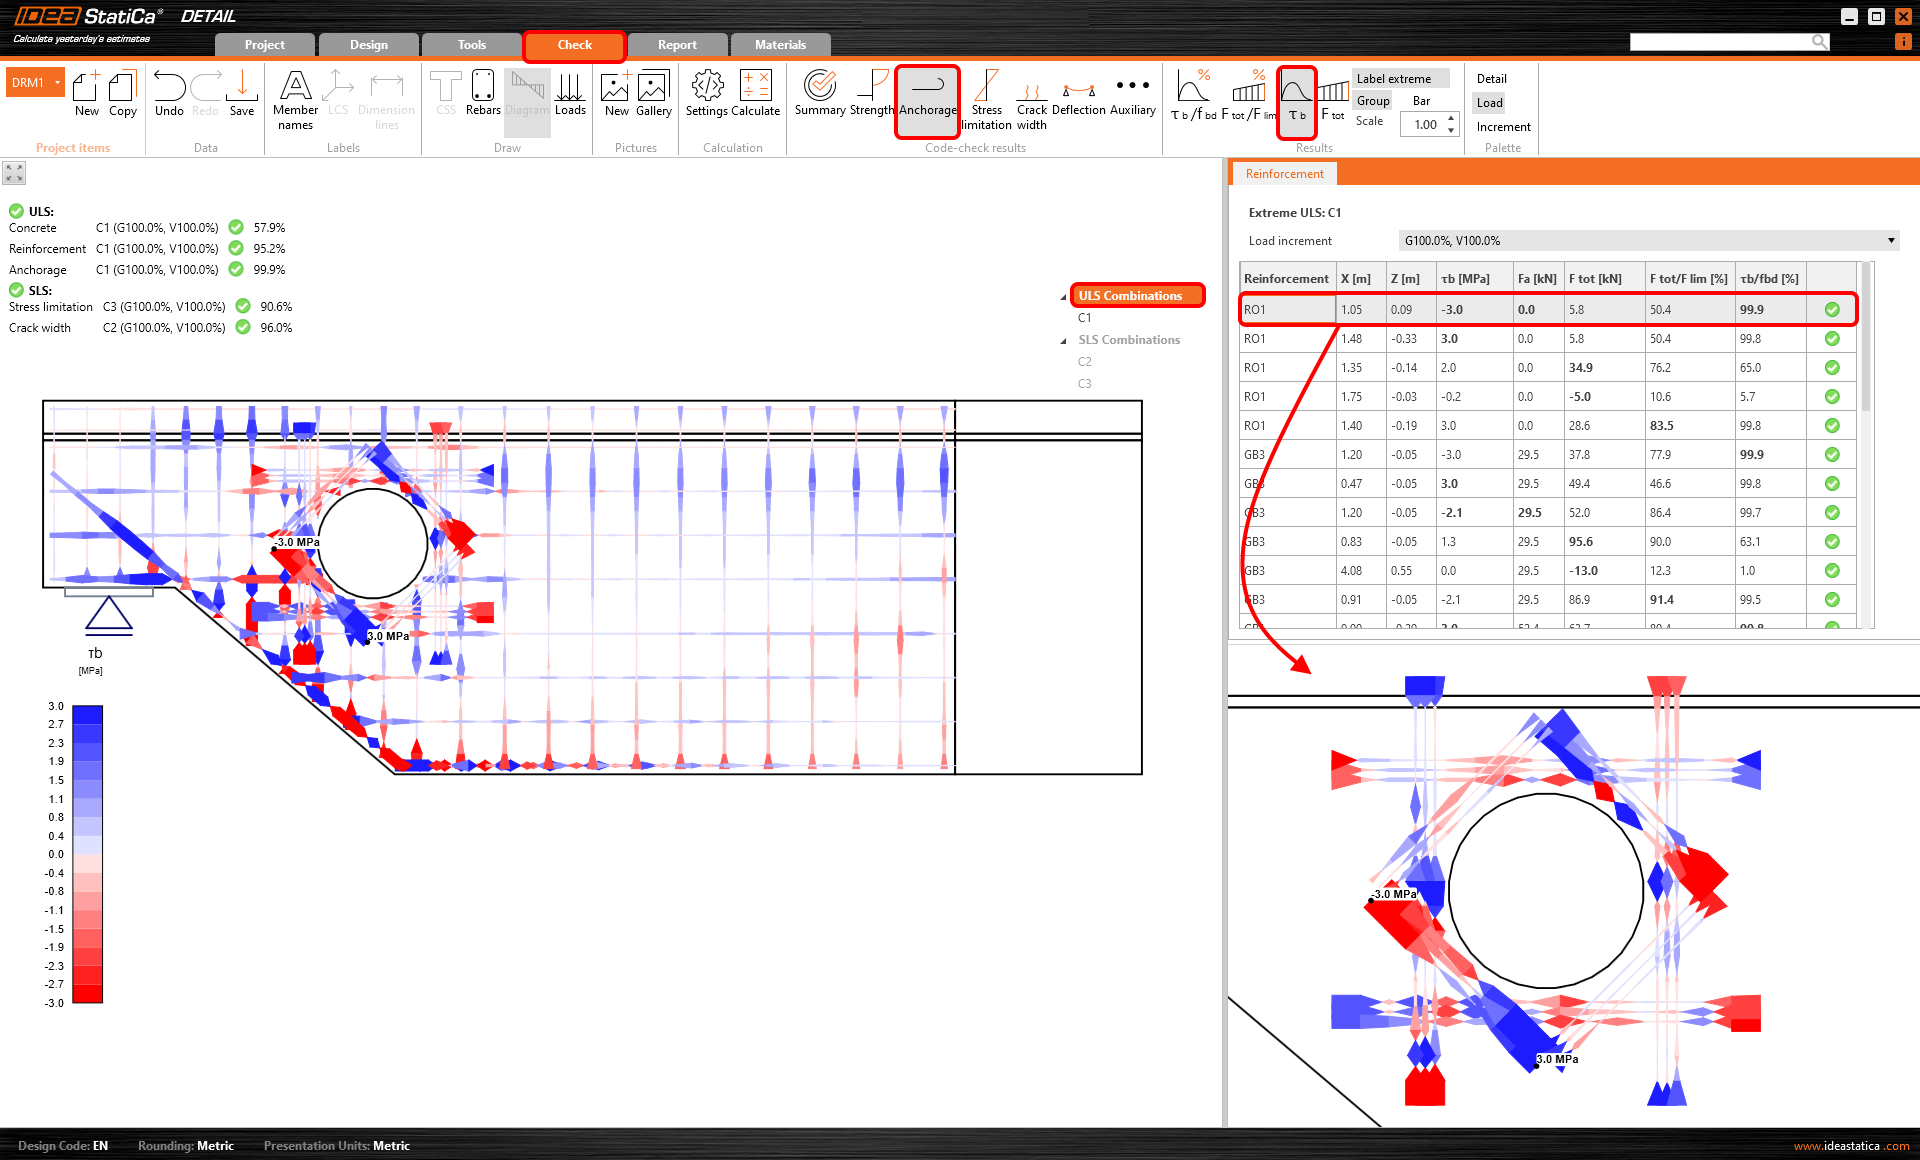
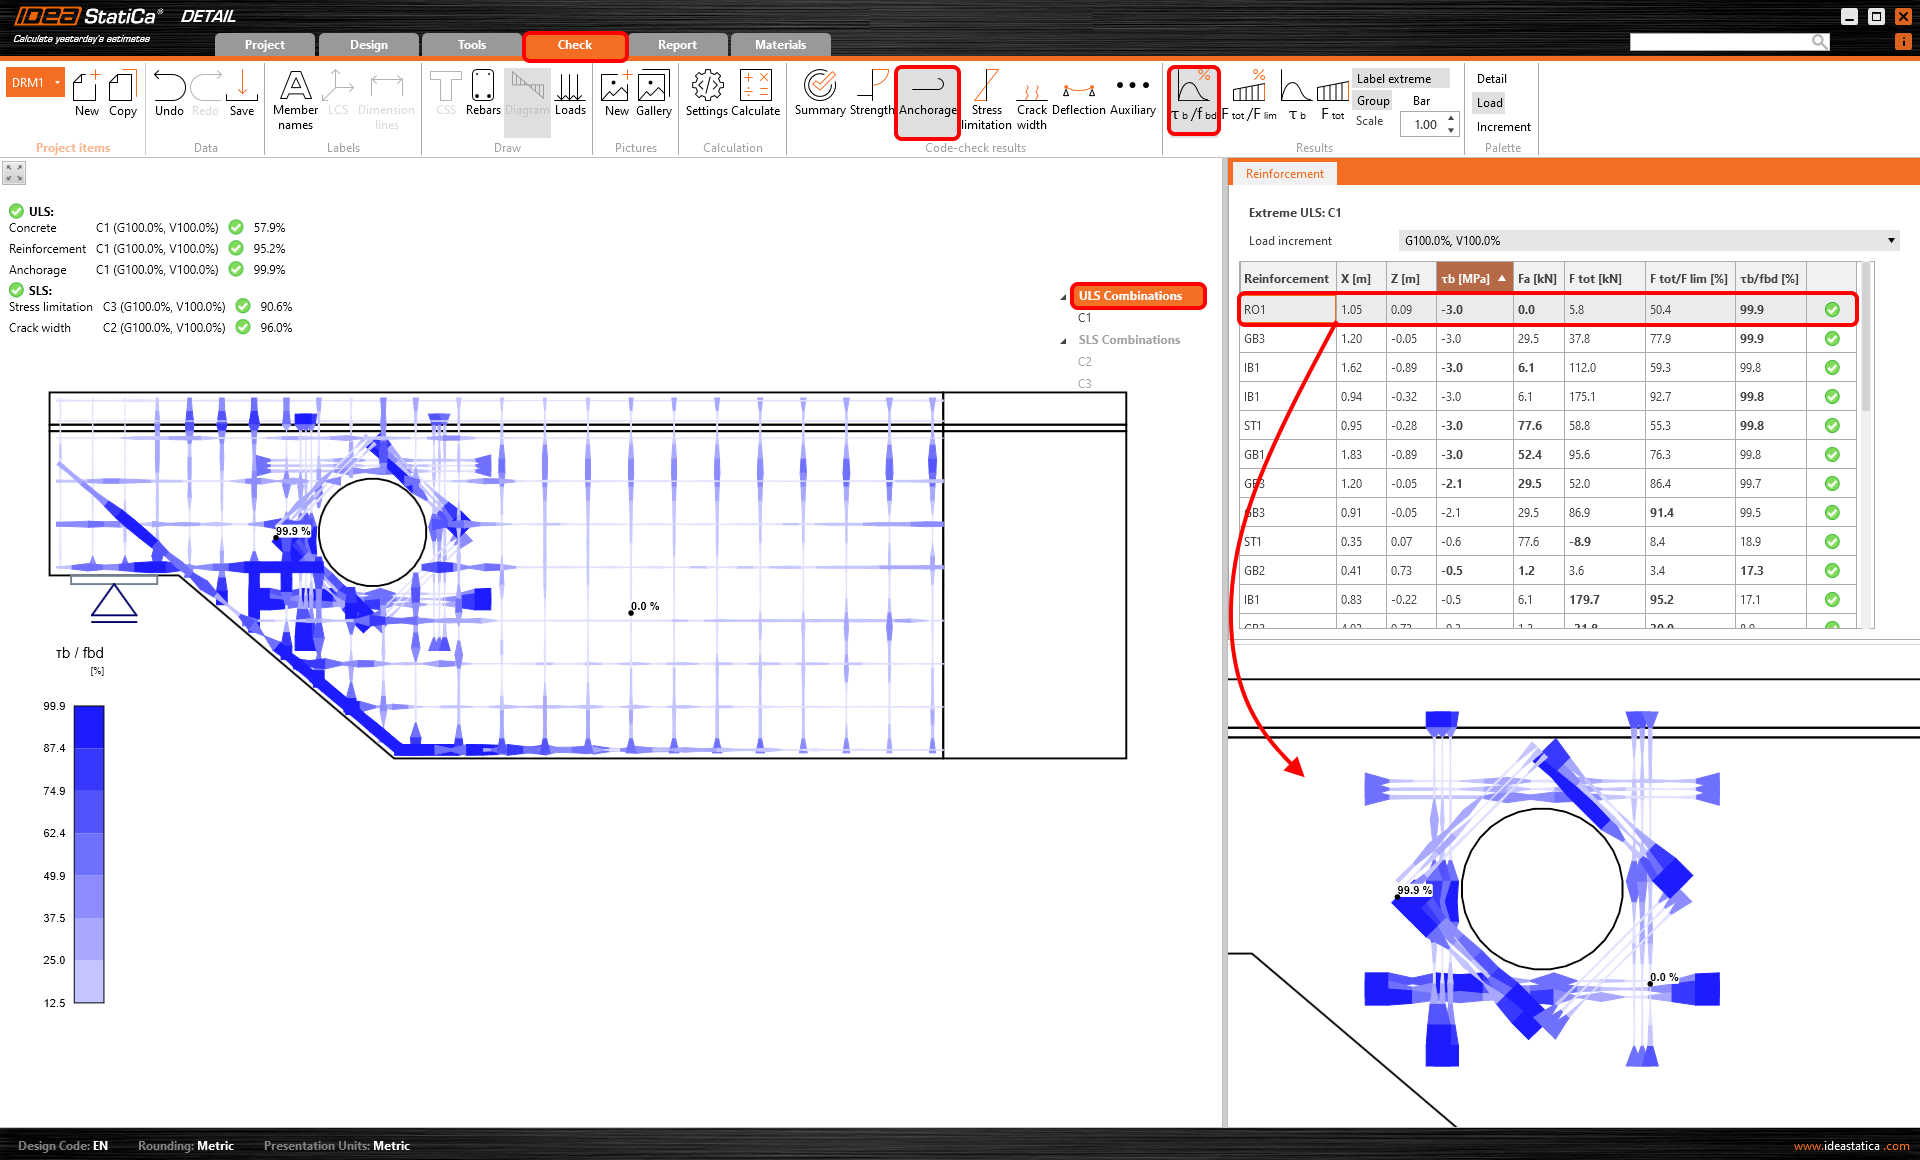
Aanhechtingsspanning toetsingswaarde
De verhouding van de aanhechtingsspanning (𝜏b) en de uiterste aanhechtingssterkte voor geselecteerde (groep van) staven wordt weergegeven. Het toont het niveau van benuttingsgraad ten opzichte van de uiterste aanhechtingssterkte tussen de wapeningsstaf en het aangrenzende beton.
Kracht toetsingswaarde
De kracht toetsingswaarde is de verhouding van de totale kracht (Ftot) in de staf en de grenswaarde. De grenswaarde van de kracht wordt berekend als het minimum van twee waarden:
- De kracht wordt berekend als de som van de uiterste verankeringskracht en de kracht die zich ontwikkelt van het uiteinde van de staf tot het beschouwde punt, uitgaande van de uiterste aanhechtingssterkte
- De uiterste sterkte van de staf
Met andere woorden, Flim is de uiterste kracht in de wapening, rekening houdend met de uiterste verankeringskracht en de uiterste weerstand van de wapeningsstaf.
Lees meer over Ftot en Flim in het volgende artikel: