CBFEM validatie: Blokverschuivingsgedrag
De blokverschuivingsweerstand wordt in elke norm iets anders berekend. In dit voorbeeld wordt de blokverschuivingsweerstand volgens CBFEM vergeleken met het experimentele programma beschreven in een gedetailleerd rapport opgesteld aan de Universiteit van Alberta in Canada.
Materiaal en geometrie
Plaatmateriaal: 350W (\(f_y = 350\,\textrm{MPa},\,f_u = 450\,\textrm{MPa}\))
Staalweerstandsfactor: \(\phi=0.9\)
De werkelijke materiaaleigenschappen zijn verrassend genoeg lager dan de nominale waarden (tabel overgenomen uit het rapport). In CBFEM worden de nominale waarden met de weerstandsfactor gebruikt.

Plaatdikte: 6,4 mm
Bouten: 1/2 inch diameter, klasse A325, boutgatdiameter = boutdiameter
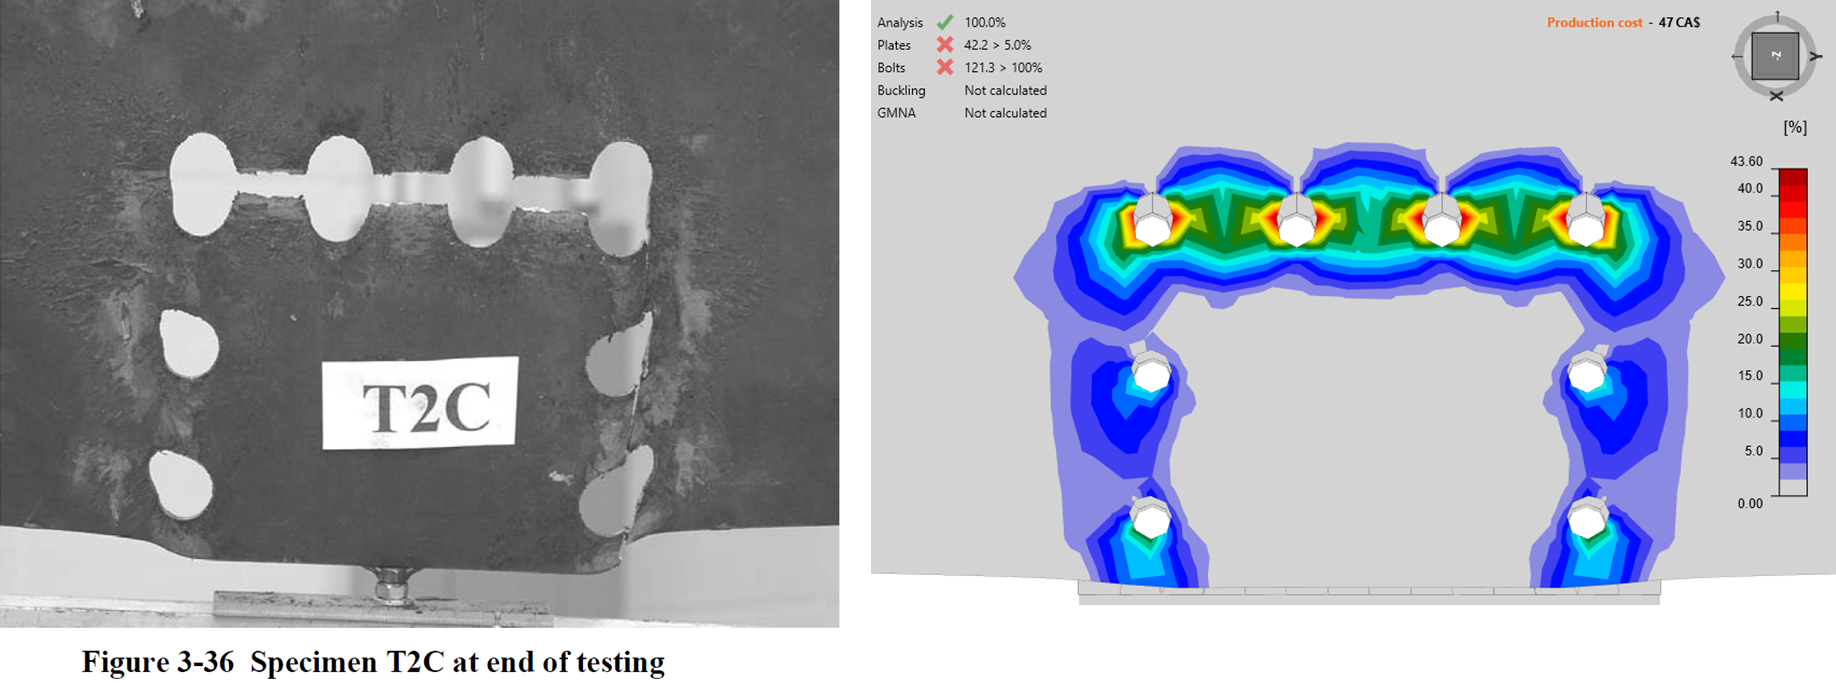
De proefopstelling bestaat uit een versterkte verbinding (bovenste deel) en een proefverbinding (onderste deel). In CBFEM wordt alleen de proefverbinding gemodelleerd. De onderstaande figuur is overgenomen uit het rapport.

Er waren twee geometrievarianten:
- Bouten dicht bij elkaar (hartafstand 51 mm; proefstukken T1A, T1B en T1C)

- Bouten met grotere hartafstand, 152 mm (proefstukken T2B en T2C)

Resultaten
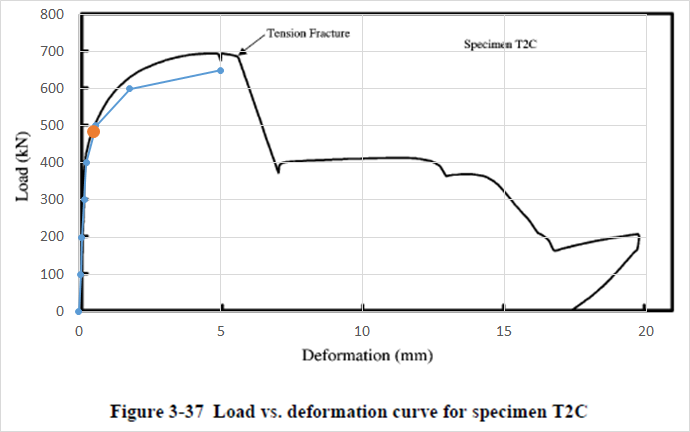
De vervorming in CBFEM wordt afgelezen op vergelijkbare locaties als in het experiment, in een ontwikkelaarsmodus waarbij vervormingen kunnen worden gevisualiseerd. De waarden worden afgelezen van de schaal, zodat de vervormingen niet exact nauwkeurig zijn.

De belasting-vervormingscurven komen vrij goed overeen met de experimentele grafieken uit het rapport. De verschillen zijn te wijten aan de gebruikte nominale waarden en weerstandsfactor in CBFEM. Het model maakt ook gebruik van een bilineair materiaaldiagram met verwaarloosbare rekversteviging. Bovendien komt de vervormde vorm volgens CBFEM goed overeen met het experiment, en is de plastische rek geconcentreerd rondom het bovenste deel tussen de bouten, wat erop wijst dat trekbreuk zal optreden vóór afschuivingsbreuk aan de zijkanten.

Het is belangrijk op te merken dat de 5% grens voor plastische rek (oranje punt in de onderstaande grafieken) wordt bereikt bij zeer kleine vervorming en ruim vóór enige breuk. De trekbreuk treedt op bij respectievelijk 45% en 42% plastische rek voor geometrie T1 en T2B/C. De afschuivingsvlakken zijn nog ductielere, maar de belastingsweerstand is dan al aanzienlijk afgenomen.

Conclusie
In CBFEM wordt de blokverschuivingsweerstand van een boutgroep bepaald door eindige elementenanalyse en gecontroleerd door de 5% grens voor plastische rek. Deze vergelijking met experimentele resultaten uit het onderzoeksrapport toont aan dat het belasting-vervormingsdiagram goed overeenkomt, ook al worden een relatief grof mesh en een vereenvoudigd materiaalmodel gebruikt in CBFEM. Een andere belangrijke bevinding is dat de 5% grens voor plastische rek wordt bereikt bij zeer kleine vervorming, ruim vóór enige breuk.
CBFEM is bedoeld om de rekenwaarde van de weerstand te bepalen en niet om het werkelijke gedrag van verbindingen perfect te beschrijven. Hoewel de 5% grens voor plastische rek in deze twee gevallen van blokverschuivingsweerstand zeer conservatief is, mogen gebruikers deze grens niet verhogen.
Referenties:
Huns, Bino Baljit Singh, Grondin, Gilbert Y., Driver, Robert G. Block shear behaviour of bolted gusset plates, Structural engineering report SER 248 | SER-ID SER248, University of Alberta, 2002. Beschikbaar op: https://era.library.ualberta.ca/items/cf9bf338-36ca-4557-9bb2-ee198954bd00