Résultats CSFM détaillés disponibles
Toutes les sorties CSFM sont disponibles
Tous les résultats CSFM peuvent être affichés sous forme d'info-bulle en maintenant le pointeur de la souris sur le point d'intérêt pendant quelques secondes, ou simplement en utilisant le bouton gauche de la souris. La valeur affichée correspond toujours au résultat du nœud le plus proche du maillage en éléments finis du modèle en béton armé. Cette fonctionnalité est disponible pour toutes les sorties et vérifications CSFM pour toutes les entités du modèle en éléments finis, c'est-à-dire le béton, le ferraillage et le câble de précontrainte.
Résultats dans un graphique
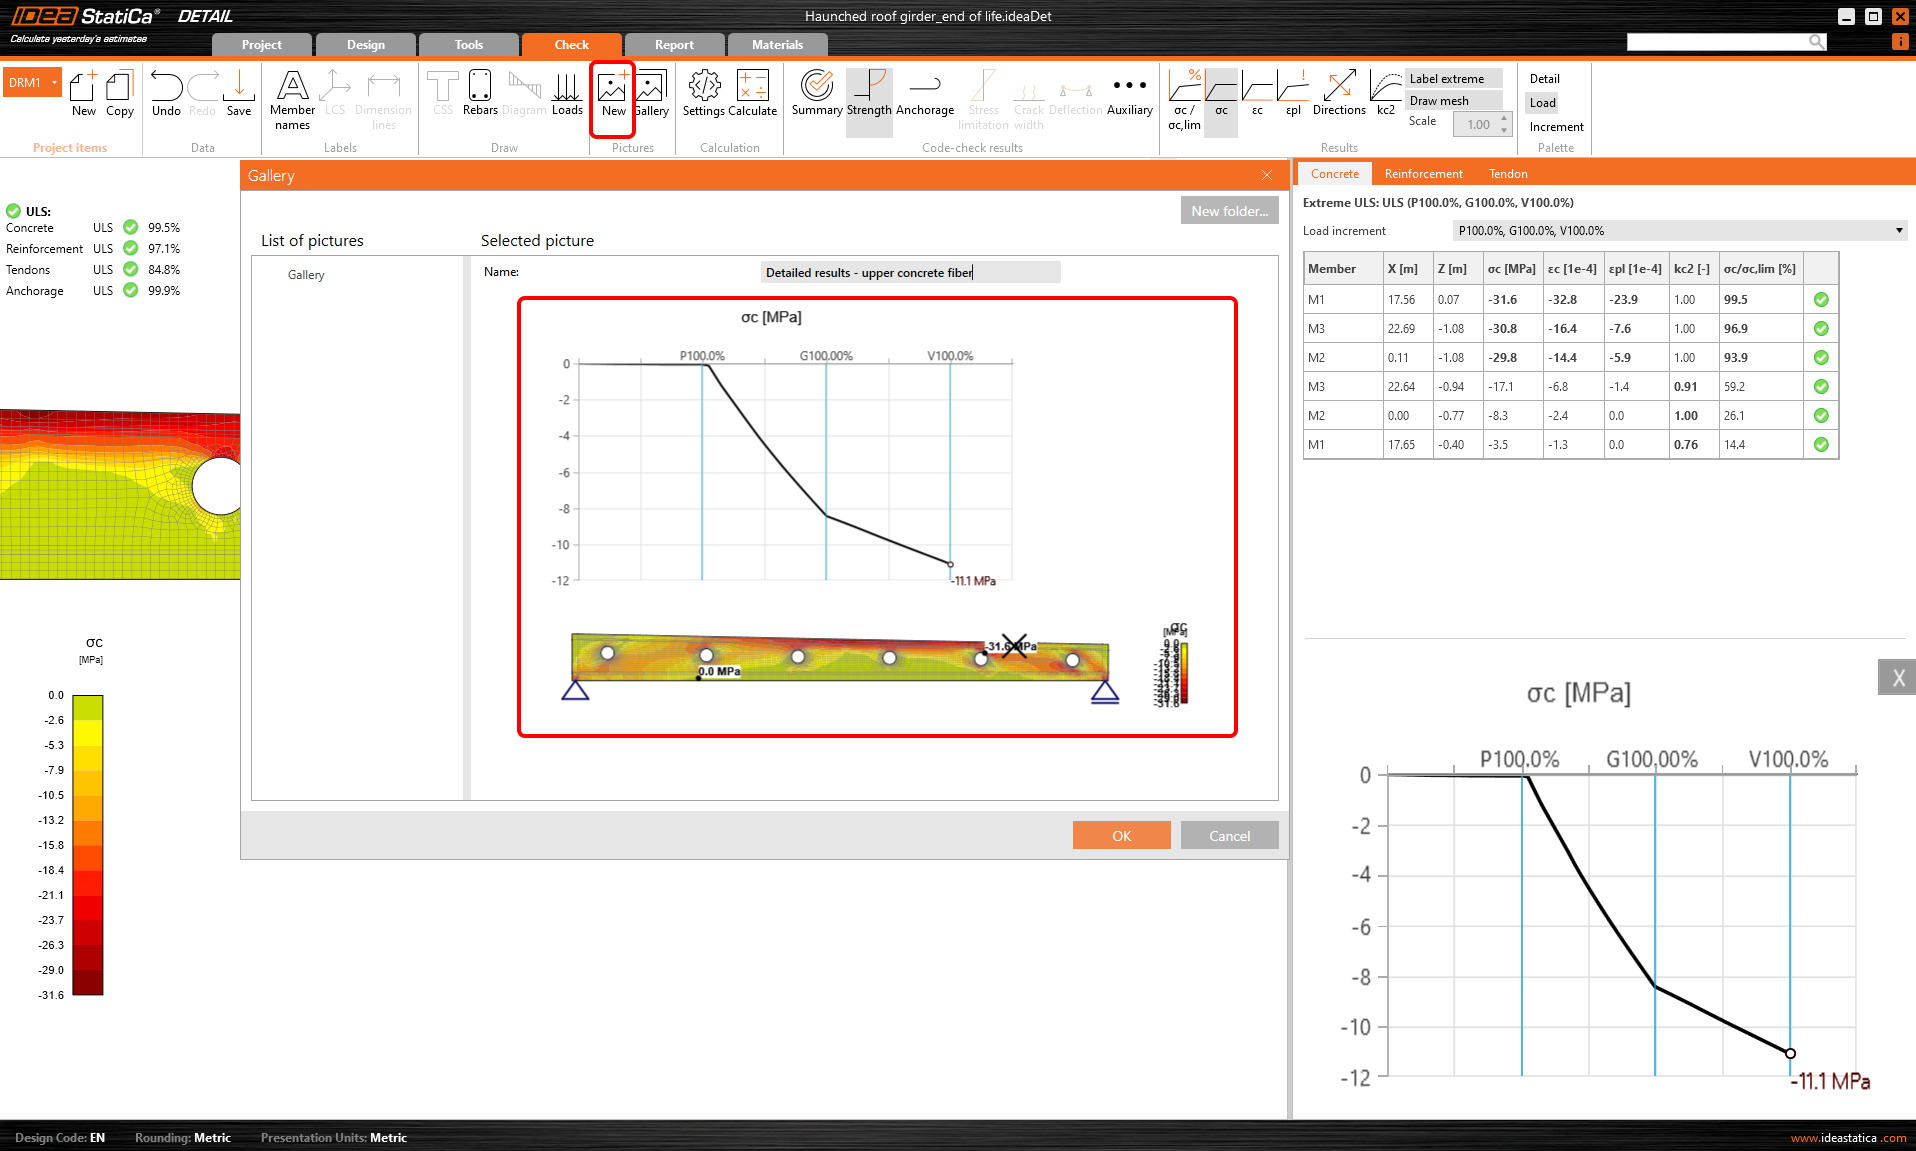
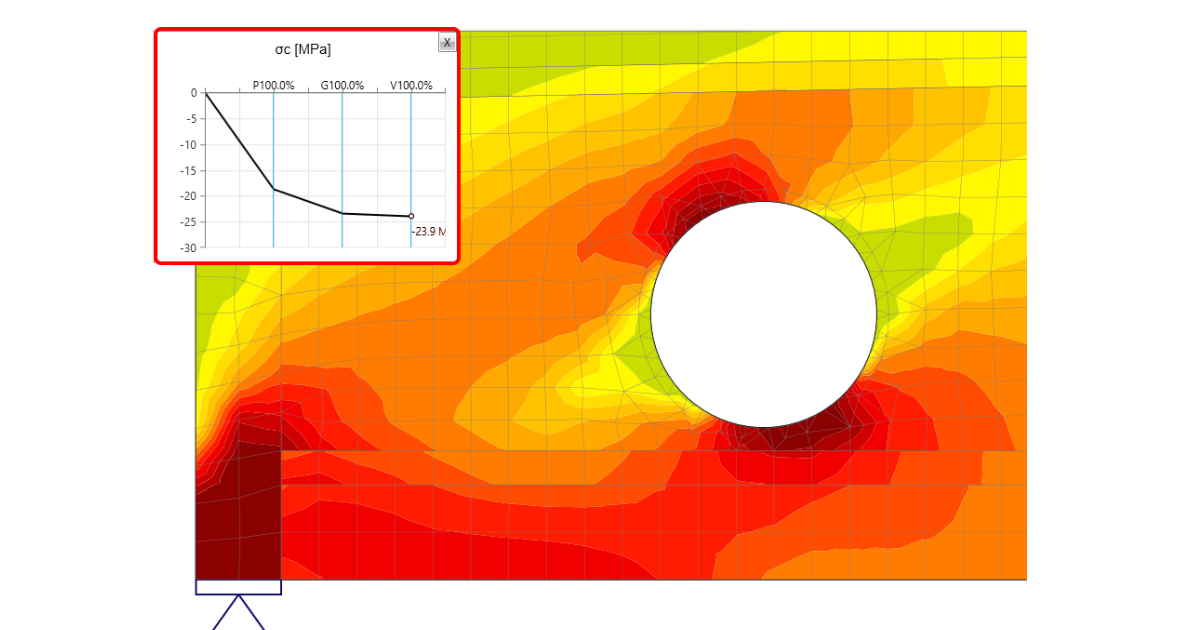
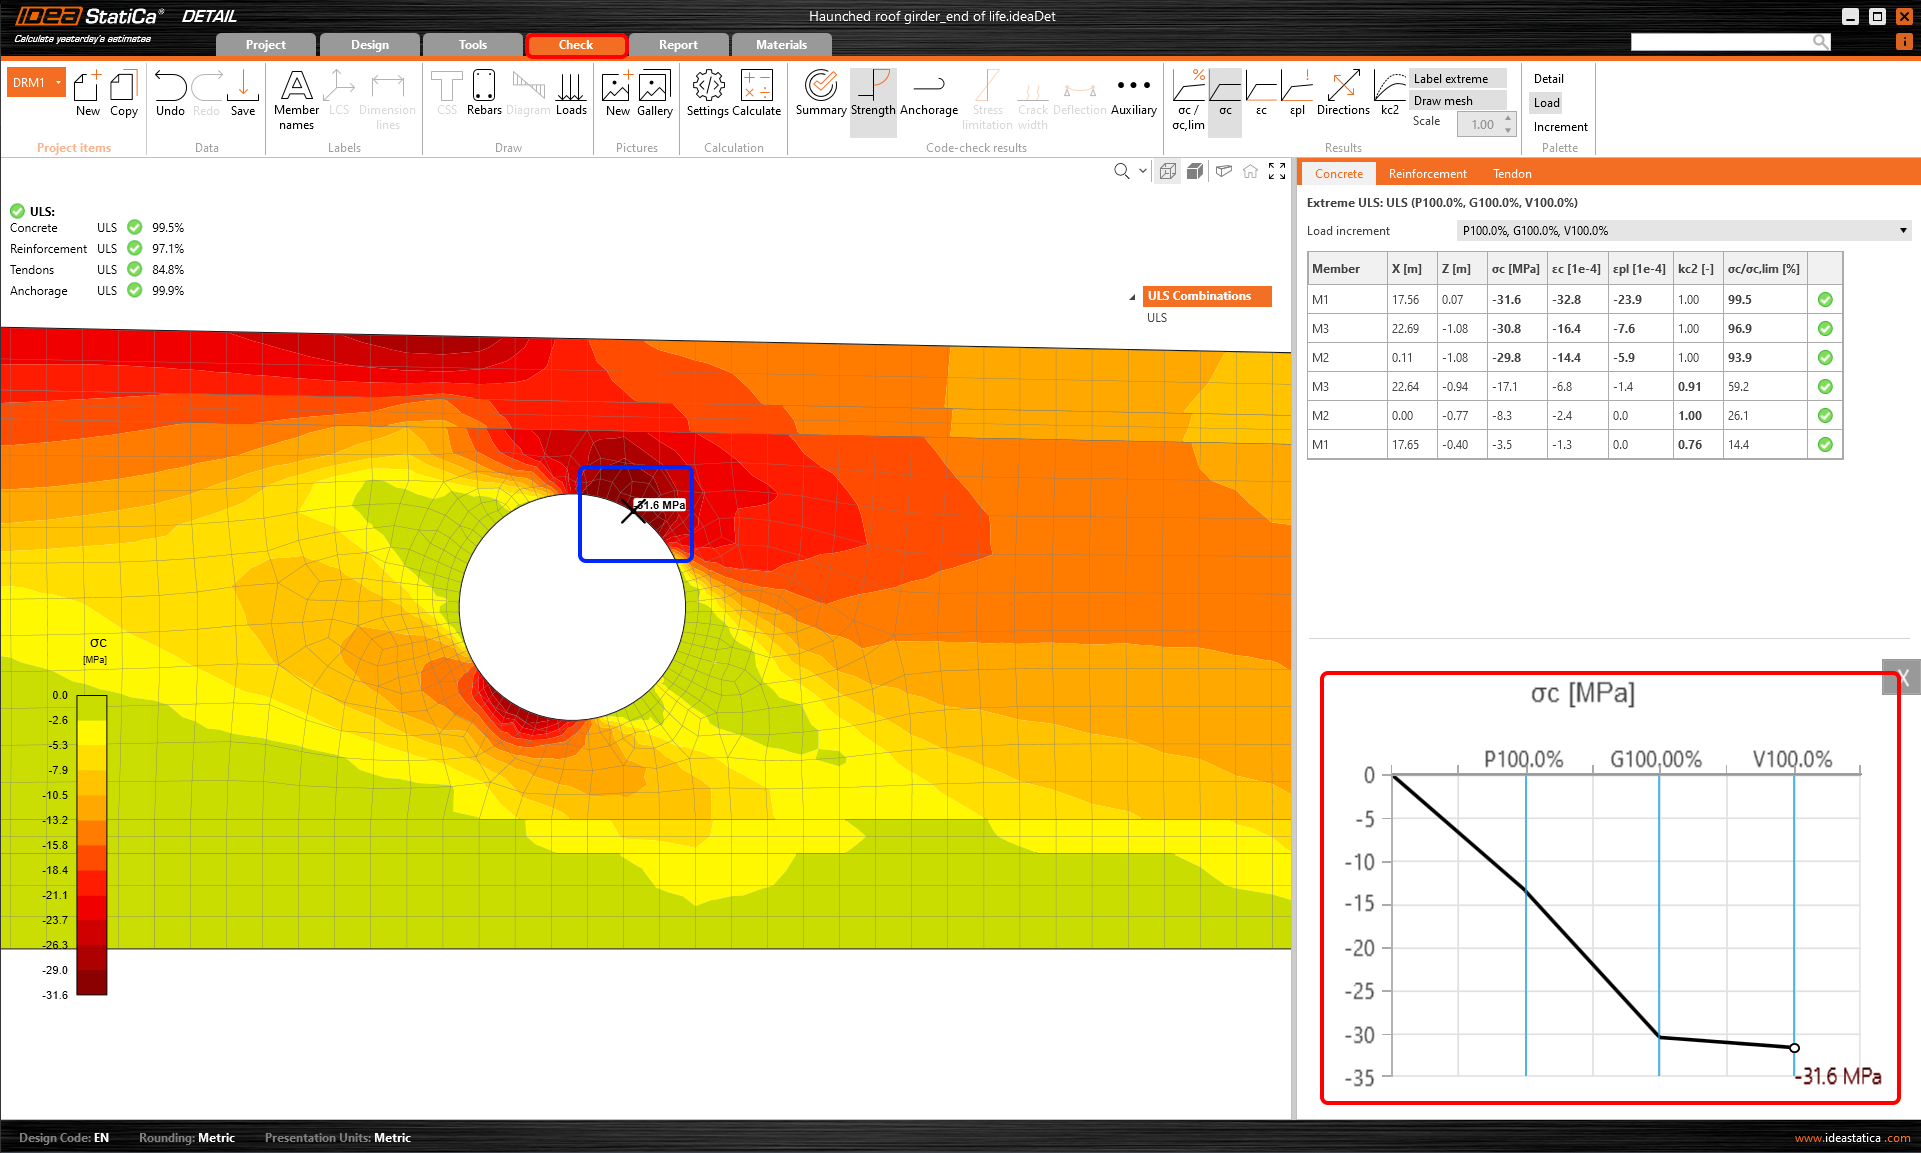
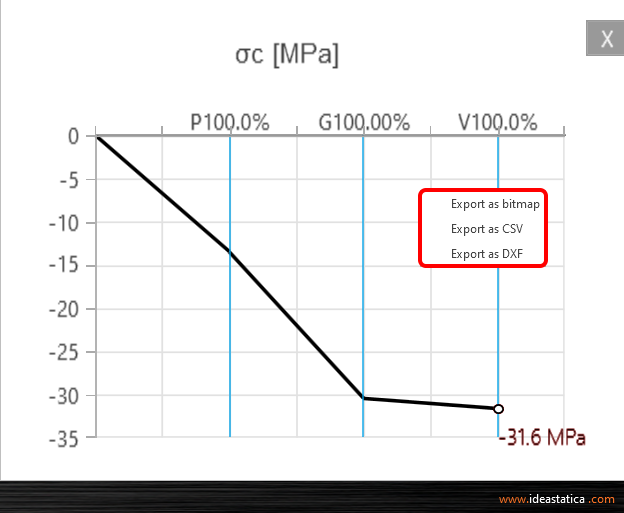
Et ce n'est pas tout ! Utilisez le bouton droit de la souris et découvrez une autre fonctionnalité avancée : l'interprétation des résultats dans un graphique. Après avoir cliqué sur une partie de la structure (Shift+ bouton gauche de la souris ou en ouvrant le menu contextuel par un clic droit), la courbe charge-déformation ou la courbe présentant l'évolution de la variable observée (contrainte, déformation, ouverture de fissure, etc.) est tracée dans le coin supérieur gauche de la scène principale. La courbe présente tous les incréments de charge appliqués dans l'analyse CSFM pour le cas de charge ou la combinaison en cours. La valeur de l'incrément de charge sélectionné dans le ruban Résultats est mise en évidence en rouge dans le graphique. L'axe horizontal représente l'incrément de charge appliqué (P = 100 % de la précontrainte appliquée, G = 100 % de la charge permanente appliquée, V = 100 % de la charge variable appliquée). L'axe vertical représente les résultats CSFM observés, tels que les contraintes, les déformations, les déplacements, l'ouverture de fissure, les forces d'ancrage, et autres. Les données du graphique peuvent être exportées vers un fichier bitmap, CSV ou DXF via le menu contextuel du graphique (bouton droit de la souris).
La courbe charge-déformation est en réalité la courbe de capacité (ou courbe pushover) de la région de discontinuité analysée. Vous pouvez donc utiliser ces sorties graphiques lorsque la conception parasismique de la structure est nécessaire pour votre projet. Dans ce cas, vous apprécierez l'export des données vers un fichier CSV.
Conseils pour travailler efficacement avec les résultats détaillés dans IDEA StatiCa Detail
- rester sur un point affiche l'info-bulle avec le résultat actuellement observé
- utiliser le bouton gauche de la souris affiche l'info-bulle avec le résultat actuellement observé
- utiliser le menu contextuel (clic droit) dans la scène principale offre la possibilité d'afficher les résultats détaillés dans le graphique, en plus des fonctionnalités existantes (Imprimer, exporter en Bitmap, DXF et presse-papiers)
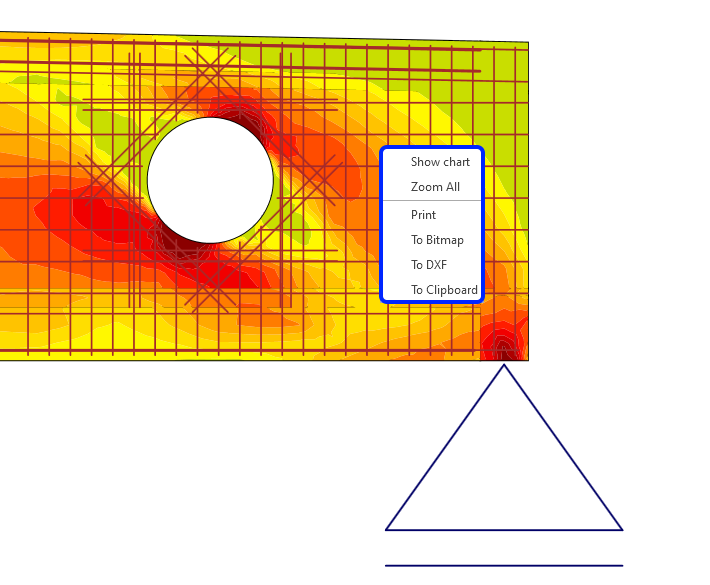
- utiliser le menu contextuel (clic droit) dans le graphique permet d'exporter le graphique en bitmap, CSV ou DXF
- définir le nombre d'incréments de charge pour obtenir des courbes de capacité lisses
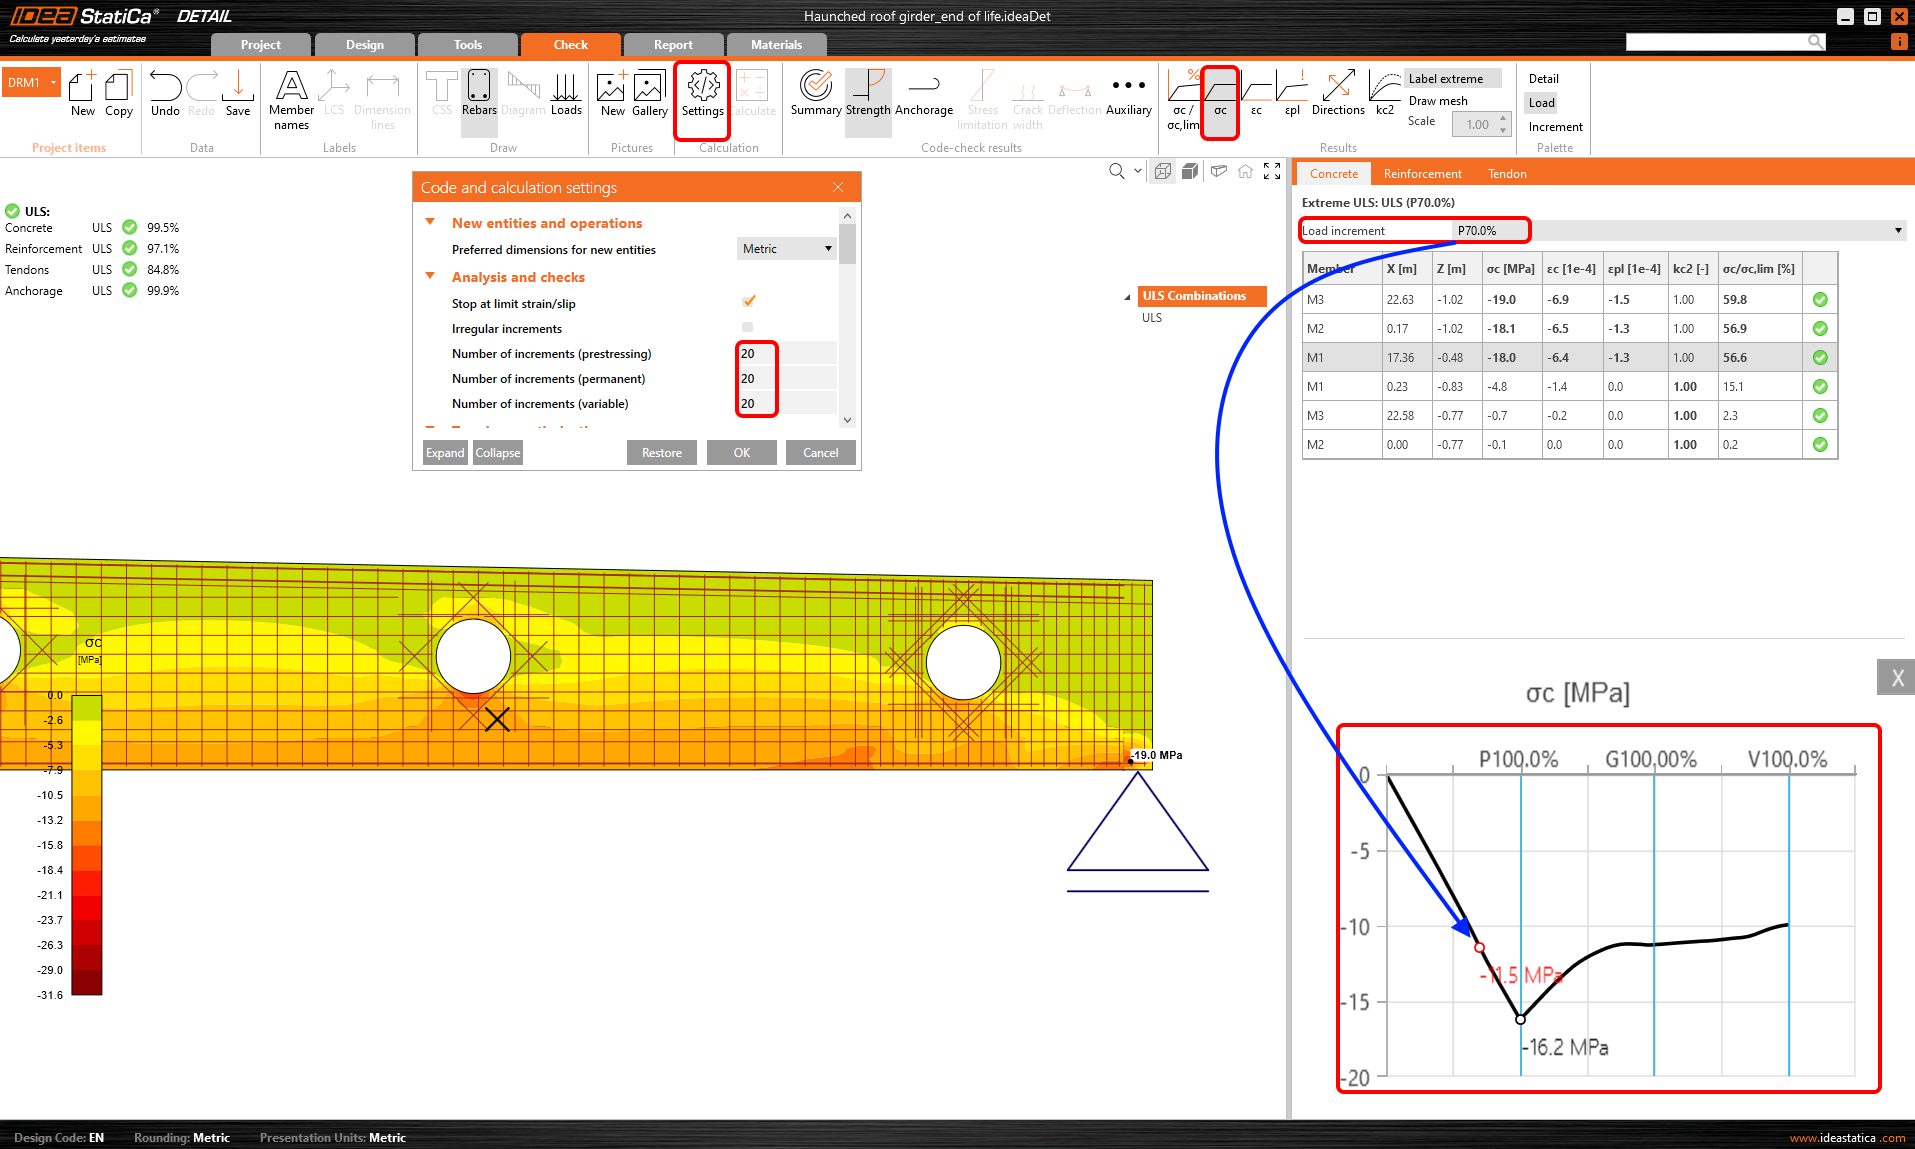
- en appuyant sur la touche Maj + bouton gauche de la souris dans la structure analysée, vous obtenez le résultat correspondant dans le graphique
- enregistrez les résultats détaillés dans la Galerie et joignez ces captures d'écran à votre rapport