Descriere generală a rezultatelor sumare în aplicația Detail
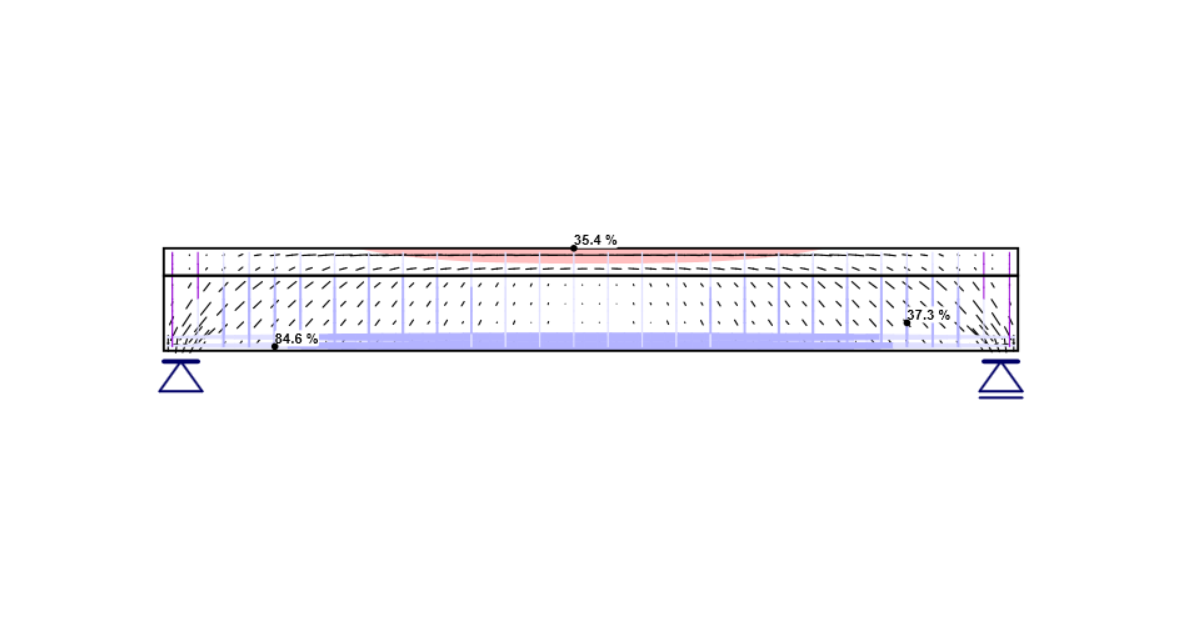
Să începem cu reacțiunile. Puteți afișa reacțiunile făcând clic pe butonul din bara de instrumente superioară.
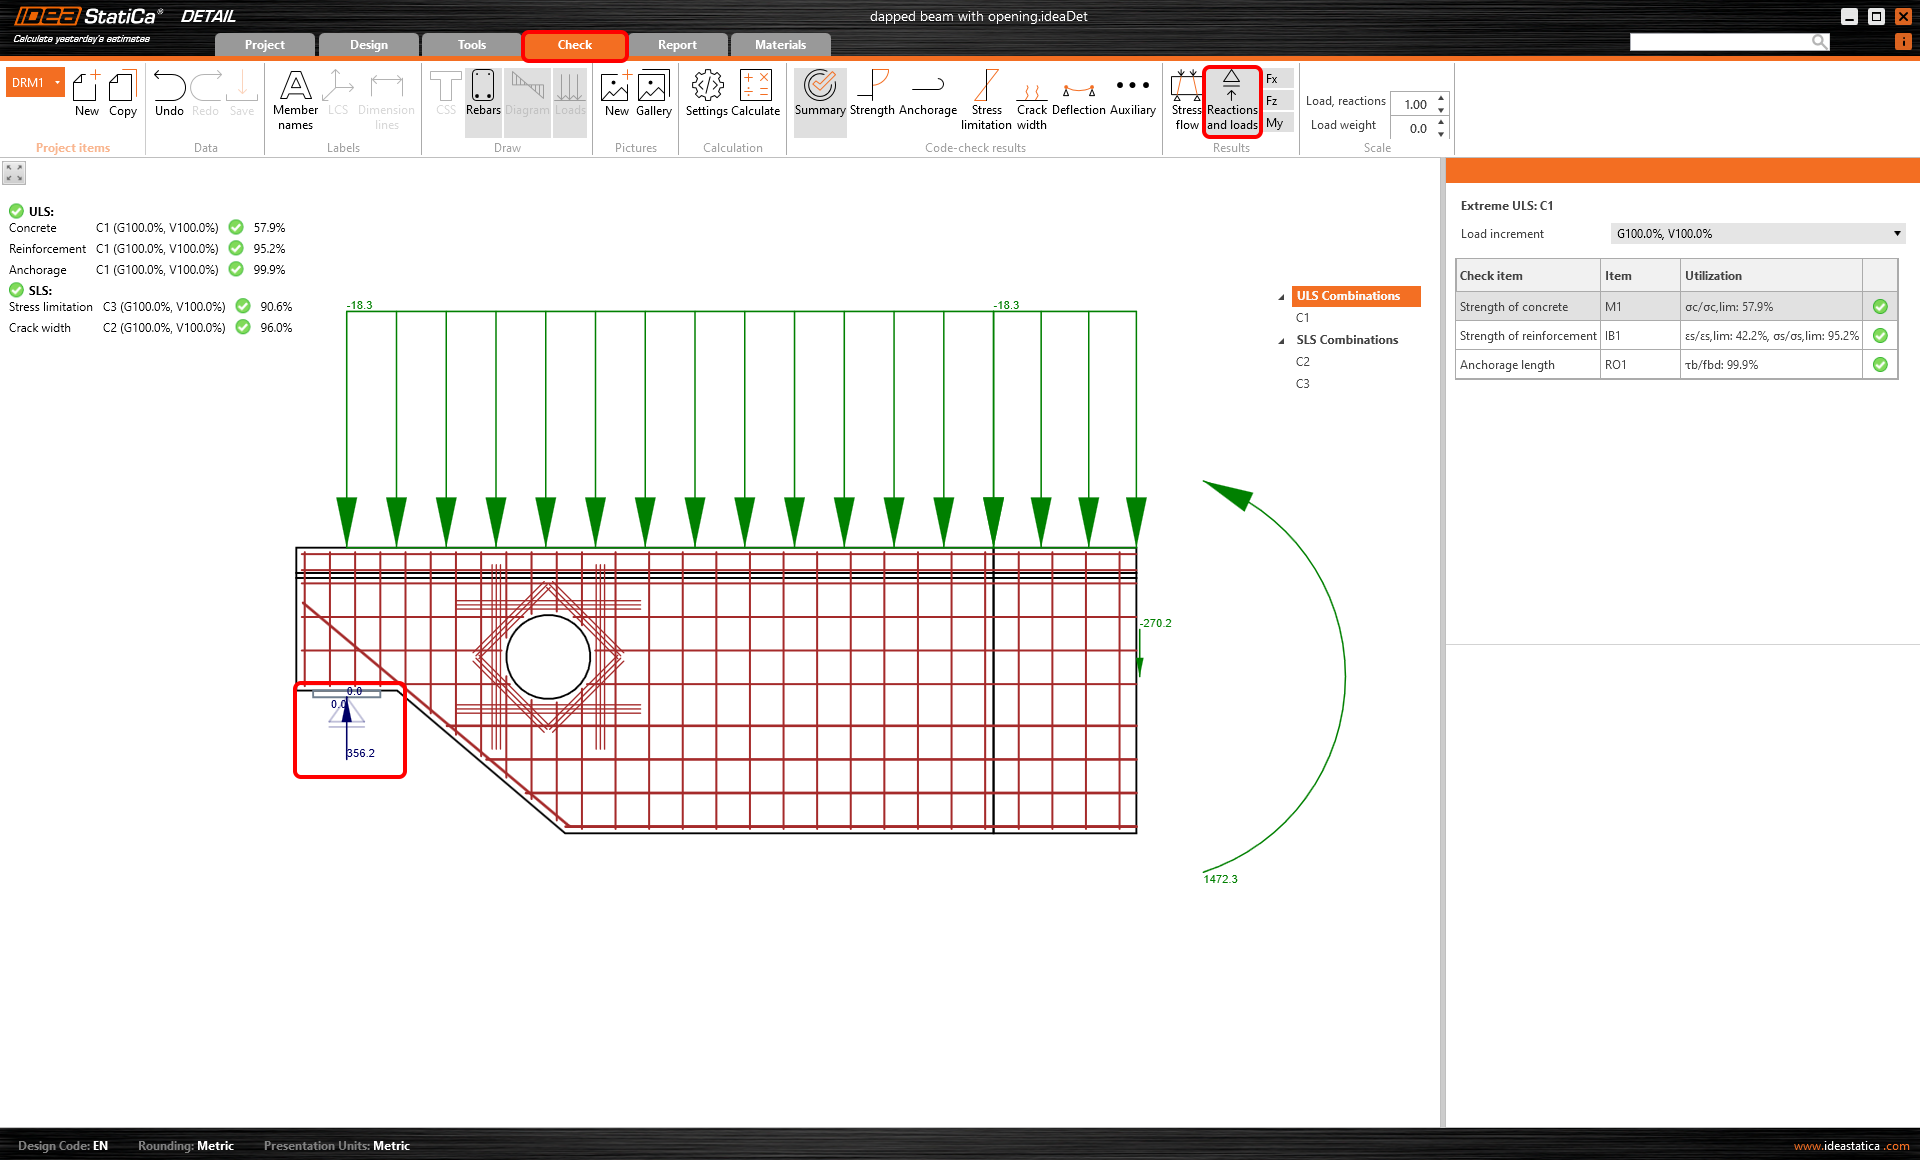
Rezistența betonului și a armăturii, precum și lungimea de ancoraj pot fi afișate pe rând în fereastra grafică a filei de date. Consultați fereastra Main pentru rezumat.
După cum puteți observa, 100% din încărcarea permanentă și 100% din încărcarea variabilă (G100.0%, V100.0%) au fost aplicate structurii.
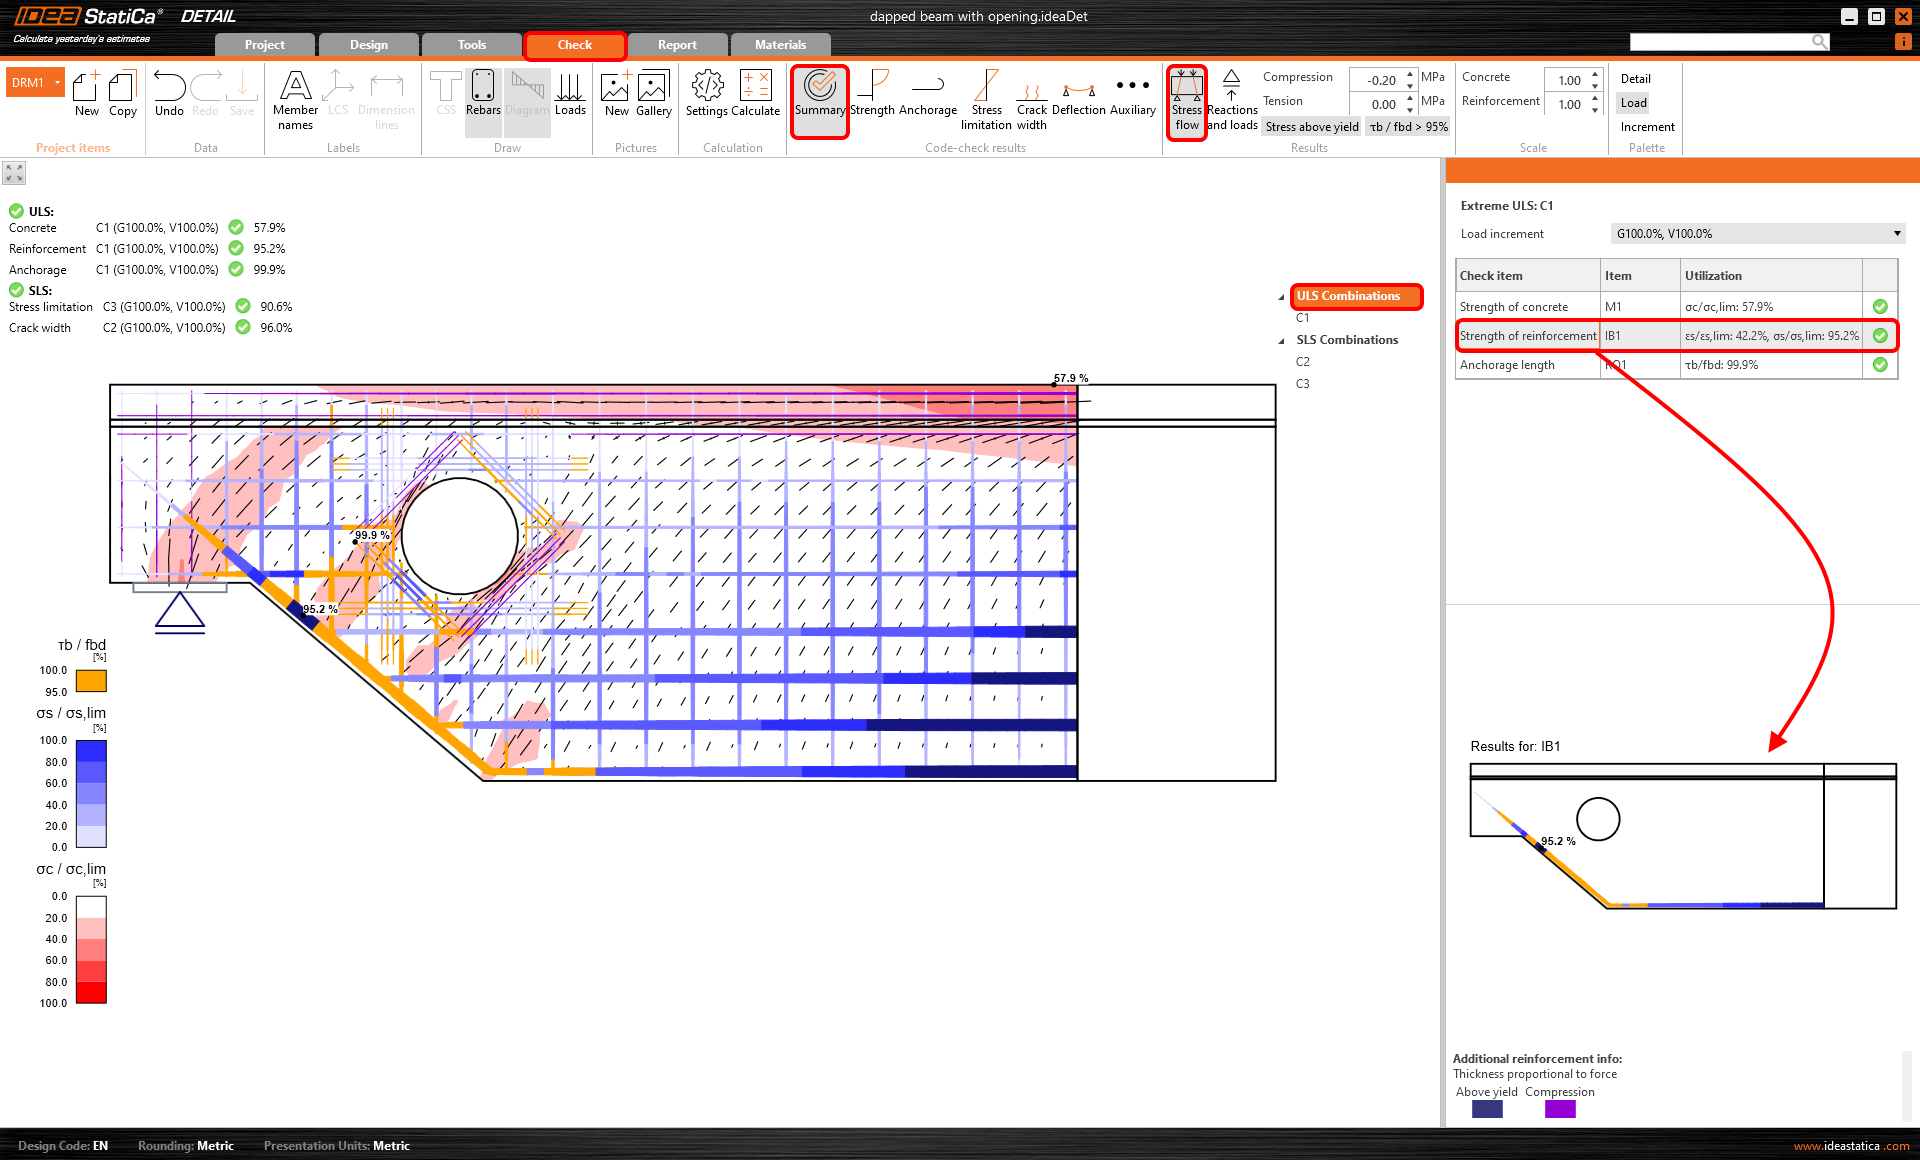
Pentru verificările SLS, puteți vizualiza de asemenea un rezumat al rezultatelor. Faceți clic pe SLS și consultați valorile pentru limitarea tensiunilor și lățimea fisurilor.
Culoarea verde înseamnă că gradul de utilizare este de până la 90%, portocaliu reprezintă 90-100% din gradul de utilizare, iar roșu depășește 100%.
Dacă doriți să vizualizați rezultatele pentru un anumit increment de tip de încărcare, accesați bara de instrumente superioară și alegeți proporția necesară de încărcări. În acest fel, puteți afișa rezultatele doar pentru tipul de încărcare permanentă sau pentru tipurile de încărcare permanentă și variabilă. Această opțiune este valabilă pentru toate rezultatele.