In this chapter, the behavior of four reinforced concrete (RC) shear wall specimens with openings is examined. Their lateral load capacity and drift angle (displacement / length) were evaluated using IDEA StatiCa software and compared with experimental data reported by Taleb et al. (2012). The results were also compared with design capacities calculated using the strut and tie model (STM) included in ACI 318-19 (2019). One of the tested shear wall specimens was selected as a baseline model for further analysis using ABAQUS software (2023), where drift angle, principal stress distribution, and crack patterns were computed and compared with those measured during experiments. Additionally, the Mander et al. (1988) confinement model was applied to examine the effect of confined concrete on the shear wall capacities in detail.
Experimental Study
To evaluate the structural performance of shear walls with openings, four RC single-span structural wall specimens, identified as N1, S1, M1, and L1, were studied. These specimens were constructed and tested by Taleb et al. (2012) at the structural laboratory of Kyoto University under lateral reversed cyclic loading. The walls were scaled to 40%, representing the lower three stories of a six-story RC building. The main goals of these experiments were to analyze the lateral behavior and understand the effects of different opening sizes and locations on crack distribution and shear strength of RC structural walls. Consistency in primary reinforcement was maintained across all specimens, with variations in the opening ratios. Among these specimens, L1 was selected as the baseline model for further analysis using ABAQUS software.
Experimental Setup
The experimental setup and loading system details are shown in Figures 3.1 and 3.2, respectively. The lateral load Q, was applied to the loading beam using two 2 MN (449.6 kips) hydraulic jacks, delivering cyclic reversed horizontal loads to the specimens. These loads were applied in both directions, simulating real-world earthquake conditions. In addition to the horizontal loads, vertical axial loads were applied to the columns using two 1 MN (224.8 kips) hydraulic jacks, replicating the loads on the lower three stories of a six-story RC building. The vertical load levels were chosen to reflect the long-term axial loads expected in such a structure, with each jack initially applying a 400 kN (89.9 kips) load to represent the upper stories weight.
The two vertical hydraulic jacks were adjusted to apply axial forces, Nw and Ne, which varied with the lateral load Q, to maintain a shear span ratio (M/Ql) of 1.0. Here, M represents the moment at the base of the wall, Q is the horizontal load, and l is the distance between the centers of the side columns. This setup ensured that shear failure would occur before any flexural yielding of the wall.
The axial load's impact on shear capacity was minimal since the side columns remained intact until the tests concluded.
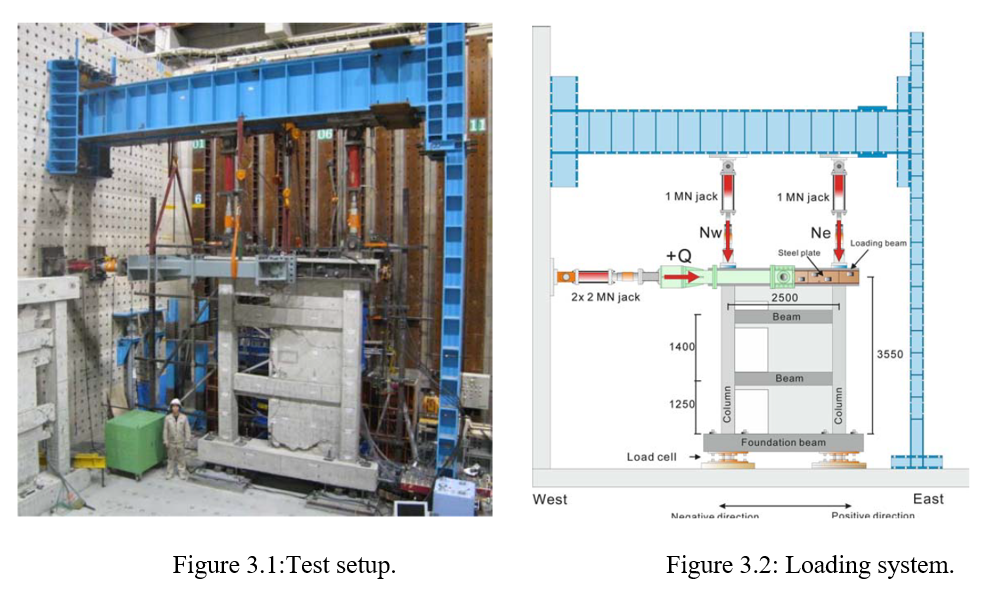
Figure 3.1, 3.2 Test set up , Loading System
Test Specimens
Four reinforced concrete wall specimens were constructed and tested at Kyoto University. As illustrated in Figure 3.3, three specimens (S1, M1, L1) featured eccentric openings, while one specimen (N1) had no openings. The primary variables for the three-story specimens with openings were the opening ratio and the location of the openings. One of the main objectives of the experimental tests were to assess the impact of different opening ratios on shear strength of the structural walls. The opening ratios for specimens S1, M1, and L1 were 0.30, 0.34, and 0.46, respectively.
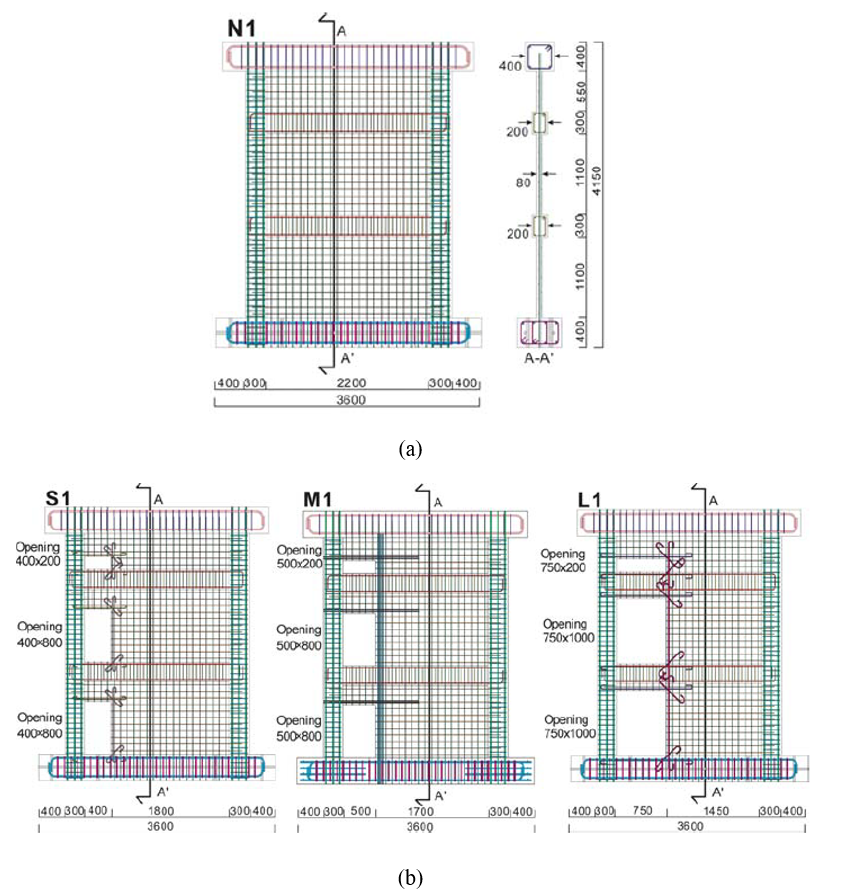
Figure 3.3: Specimen configurations and reinforcing bar arrangement: a) details and dimension for specimen N1 without opening, and b) dimension and opening details for specimens S1, M1, and L1.
IDEA StatiCa Analysis
The behavior of reinforced concrete shear wall specimens with openings, as explored in Section 3.3.1, was analyzed using IDEA StatiCa Detail. This study extends previous research by Taleb et al. (2012) and centers on specimens N1, S1, M1, and L1. These specimens were specifically chosen to investigate the influence of varying opening ratios and locations on their structural performance. The modeling methodology in IDEA StatiCa Detail integrated the actual compressive strength of concrete and the yield and ultimate strengths of reinforcing steel bars, following the parameters outlined by Taleb et al. (2012).
In the IDEA StatiCa analysis, load factors of 1.0 were utilized for both load patterns - the self-weight and the applied lateral load - focused on the ultimate limit state (ULS) load combination. To ensure the accuracy of the simulations and their alignment with experimental findings, material factors for concrete (fc) and reinforcing steel (fs) within IDEA StatiCa were set to 1.0.
The capacity calculation process for IDEA StatiCa involved incrementally increasing the applied lateral load at the middle of the top beam until reaching any of the following conditions:
- The concrete at any point in the model reached 100% of its strength capacity under the applied load.
- The reinforcing steel reached 100% of its strength capacity under the applied load.
- The anchorage steel reached 100% of its strength capacity under the applied load.
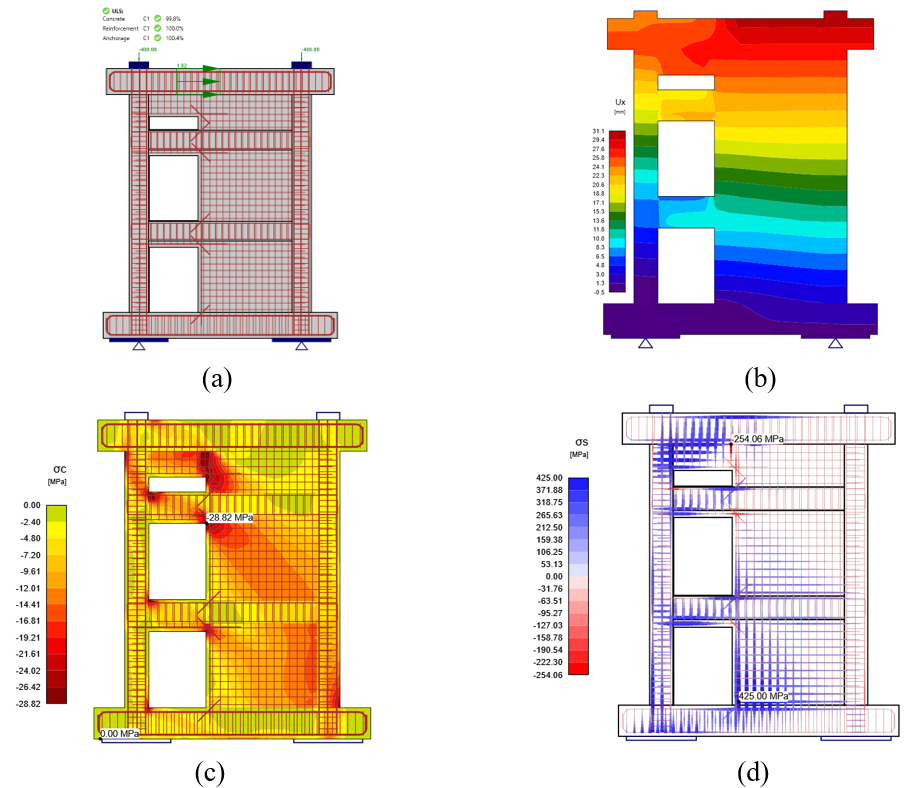
Figure 3.5: Shear wall with openings L1 at 1.82 kN/mm (10.4 kip/in.) lateral load: a) IDEA StatiCa Detail model with results, b) deflection contour, c) concrete principal stresses (σc), and d) stresses in the reinforcement (σs).
Capacity Calculation Using Strut and Tie Model
The capacities for all shear walls with openings were determined following the provisions for the Strut and Tie Model (STM) as outlined in the American Concrete Institute (ACI 318-19) code, specifically described in Section 2.2. Depending on the location of nodal zones and struts in the, strut and node confinement modification factor (βc), strut coefficient (βs), and nodal zone coefficient (βn) were taken from Tables 2.1 through 2.3 in Chapter 2, respectively. The effective compressive strength of concrete (fce) in a strut and nodal zone were calculated using Equations 2.4 and 2.9, respectively.
Multiple strut and tie models were developed to identify the best model that would yield the maximum lateral load capacity and location of failure as accurately as possible. To construct the truss models (or STM with struts as compressive truss members and ties as tensile truss members), stress flow diagrams and topology optimization plots from IDEA StatiCa analysis were utilized for all shear wall specimens. The effective volume was 20% in the topology optimization plots generated by IDEA StatiCa.
Developing a truss model or STM involves creating a simplified representation of complex structural behavior using principles of force equilibrium and stress distribution. The specific approach to designing the truss model can vary significantly, depending on the judgement, preferences and expertise of the structural engineers involved. Engineers select from a variety of methods to construct the truss model, with the goal of accurately depicting how stresses and forces are transmitted and distributed within the structure. This process aims to ensure that the truss model effectively represents the overall physical behavior and structural integrity, and it is consistent with the load-bearing requirements of the design.
Navigating the requirements outlined in codes and standards, such as those in the ACI 318-19 (particularly in Chapter 23), presents several challenges in developing a truss model or STM. These standards specify critical factors including member sizing, connectivity, and load paths to ensure structural integrity and safety under varying load conditions. Specific requirements include ensuring all nodes are in equilibrium, balancing vertical and horizontal forces on inclined struts at nodal zones, and preventing struts and ties from intersecting. Additionally, struts must maintain a minimum inclination angle of 25 degrees, and both struts and nodal zones must be adequately sized to withstand applied loads. The dimensions of struts and nodal zones are determined based on effective concrete strengths defined in Sections 2.3 and 2.4 of the Chapter 2.
Based on the topology optimization plot and stress flow diagrams determined from the IDEA StatiCa analysis for shear wall specimen N1, several truss models were developed. Then, these trusses were analyzed using SAP2000 software (2024). This process focused on two main objectives: (a) identifying critical struts, ties, and nodal zones (using stress flow plots from IDEA StatiCa analysis), and (b) assessing the load-bearing capacity of each model (using truss member and reaction forces from SAP2000 analysis). After multiple iterations, the results from the final STM were reported and compared with the measured test data.
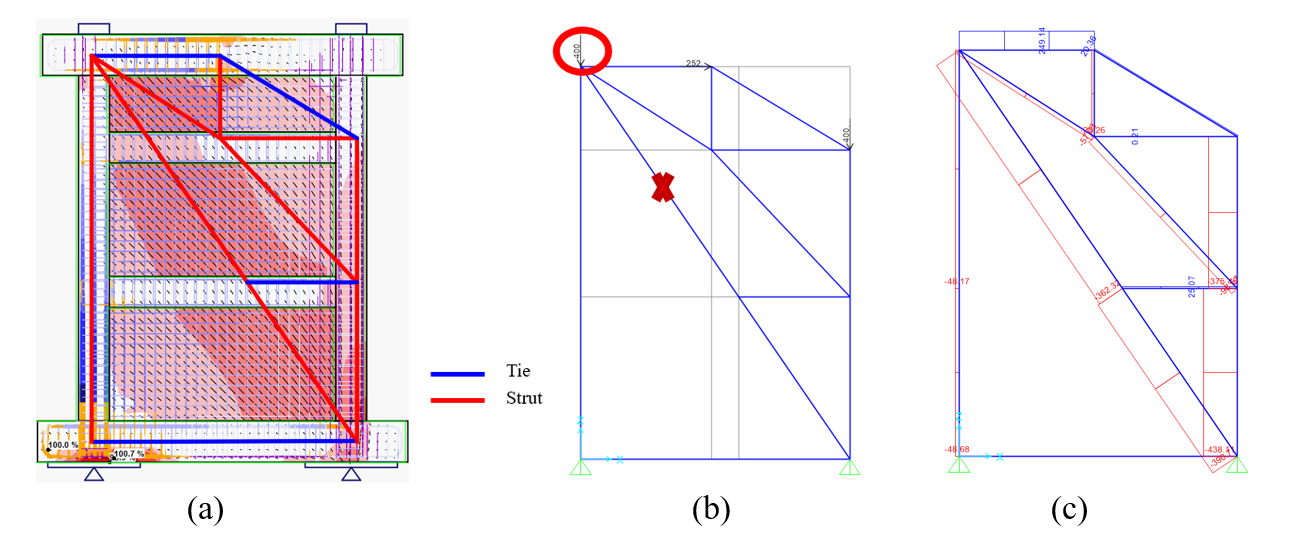
Figure 3.269: Strut and tie model for specimen N1: a) STM with stress flow, b) STM in SAP2000, and c) axial forces in STM members calculated in SAP2000.
ABAQUS Model Development and Analysis
In this section, the specimen L1, which was modeled and analyzed in Section 3.5.1, was remodeled using ABAQUS software (2023) for finite element (FE) analysis. The results were then compared with those obtained from IDEA StatiCa. Due to the complexity of the structure, the CAD model, including concrete and reinforcement bars, was drawn in Rhino software (McNeel, 2020) and then exported to ABAQUS as a STEP file. The version of Rhino used will be included in the References. Similar to the IDEA StatiCa model, in ABAQUS, in addition to the self-weight (i.e., Load 1), two vertical loads (i.e., Loads 2 and 3), each 400 kN, were applied to two load-bearing plates with a thickness of 4 in., as shown in Figure 3.34. Since the line load can only be used for beam elements in ABAQUS, to mimic the lateral load imposed on the structure in the experimental test and IDEA StatiCa, a horizontal force (i.e., Load 4) was applied to a defined reference point (i.e., RF2) that was coupled to the edges of the top beam to resemble the line load.
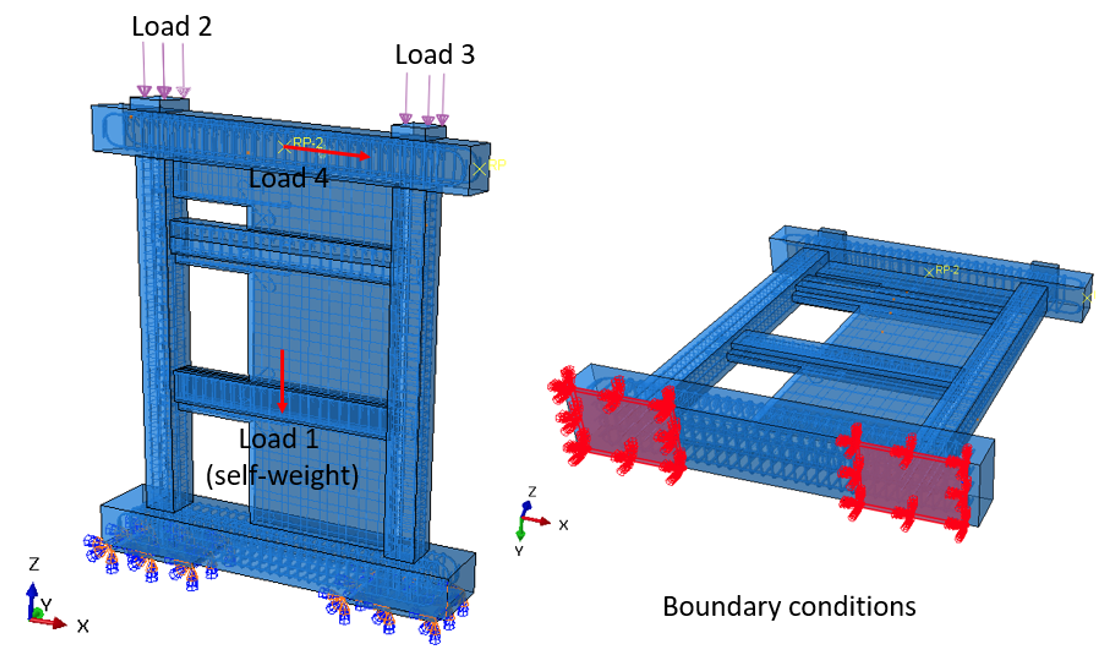
Figure 3.34: Model setup in ABAQUS showing the locations and details of the applied load and boundary conditions.
Two support plates under the structure were fixed to restrain vertical and lateral displacement (see Figure 3.34). To accurately capture the crack initiation and evolution, the element size was chosen to be 20 mm, resulting in a total of 396,505 elements in the model (see Figure 3.35). The 3D stress, 8-node linear brick reduced integration (i.e., C3D8R) element type was selected for the concrete, while the truss element was chosen for the reinforcing bars.
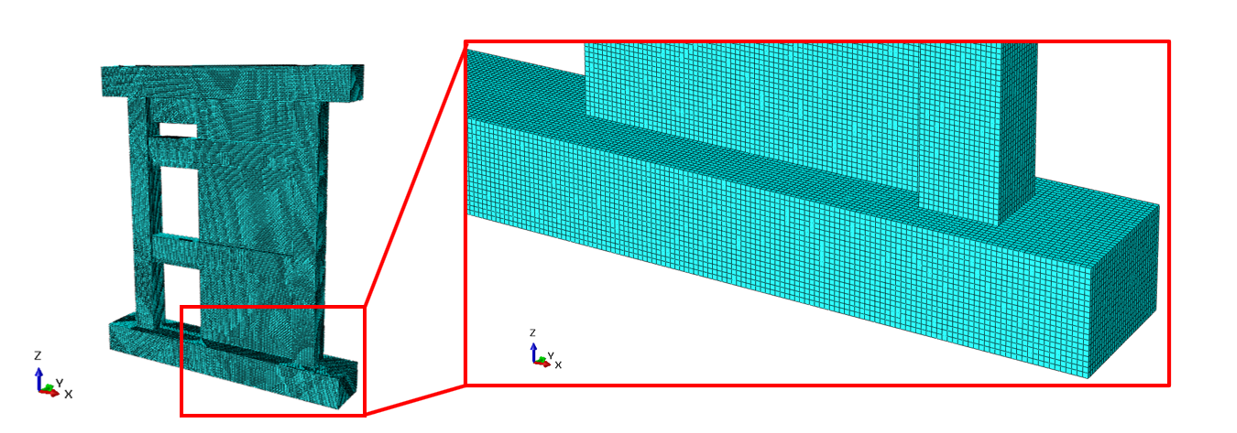
Figure 3.35: Mesh density with element size of 20 mm.
In ABAQUS, the Concrete Damage Plasticity (CDP) constitutive model was used. The required parameters to describe this model were obtained after calibration from various sources (Federal Highway Administration, 2006, and Watanabe et al., 2004) as they were not explicitly indicated in Taleb et al. (2012). For the steel bars, the material behavior was modeled using bi-linear plasticity. Other parameters, including density, elastic modulus, and Poisson’s ratio, were taken exactly from the IDEA StatiCa materials library. The numerical simulation was carried out on a virtual machine with 16 processors (Intel Xeon® Gold Processor 6430 @2.10GHz) and took approximately 185 minutes to finish, while IDEA StatiCa completed the calculation in less than two minutes.
Summary
In conclusion, the capacities of reinforced concrete shear walls with openings were evaluated using IDEA StatiCa Detail, comparing the strut and tie model from ACI 318-19, ABAQUS, the Compatible Stress Field Method (CSFM), and experimental data. The study revealed that the STM significantly underestimated the load-carrying capacity due to its conservative design assumptions. In contrast, both the CSFM and ABAQUS provided results that aligned closely with the measured capacities, especially under positive loading conditions. Additionally, the analysis considered the effects of confined versus unconfined concrete material on strength and drift behavior. The results showed that confinement generally improves shear wall capacity, although the impact on drift angles varied among specimens. Overall, the findings highlight the importance of selecting appropriate prediction methods, with CSFM and ABAQUS demonstrating superior accuracy compared to STM and underscore the need for careful consideration of confinement effects in design and analysis.
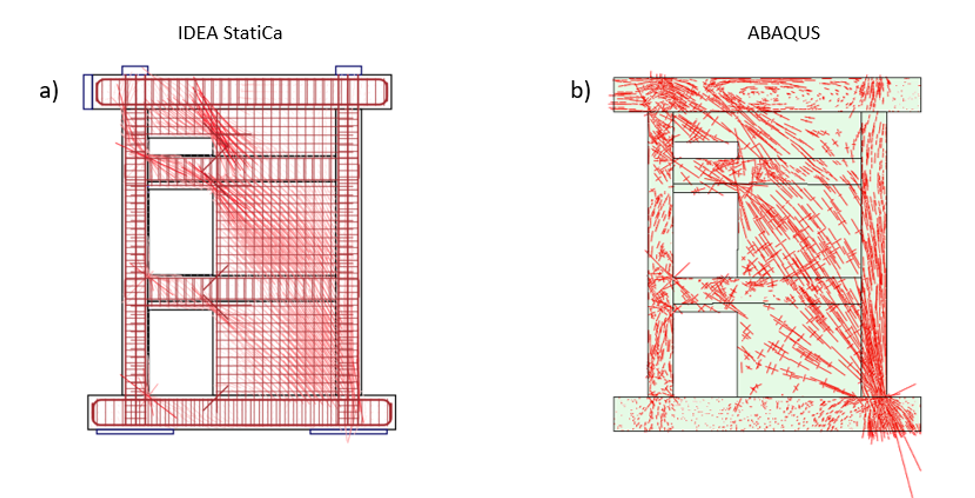
Figure 3.39: Comparison of the direction of principal stresses between IDEA StatiCa and ABAQUS.
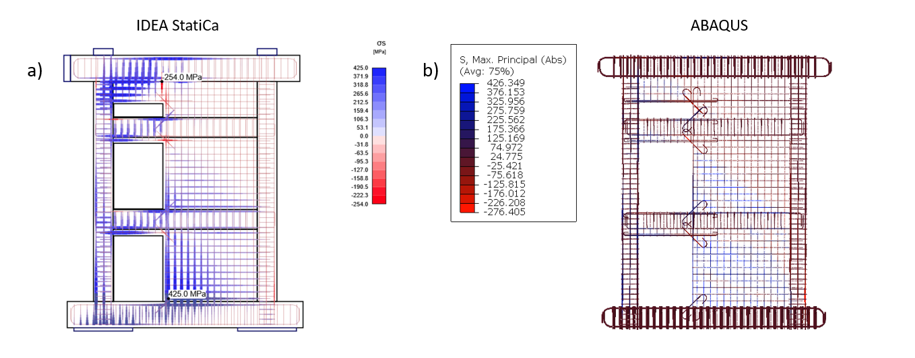
Figure 3.41: Comparison of the stresses in the steel bars between a) IDEA StatiCa, and b) ABAQUS.