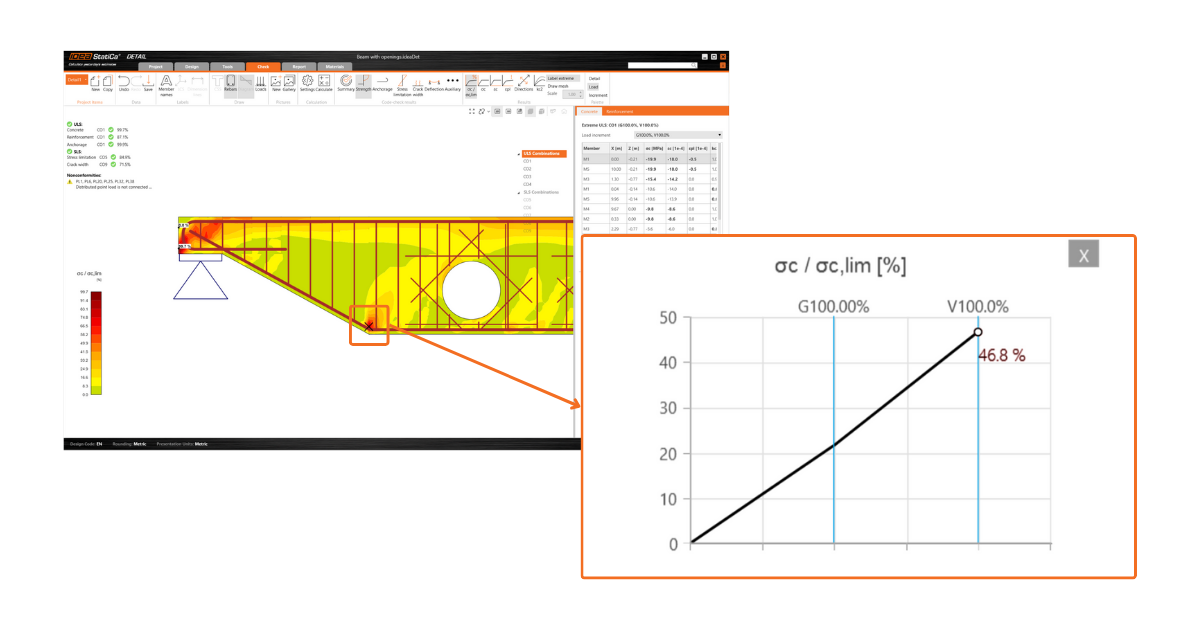
Présentation des résultats de courbes pertinents dans des graphiques détaillés dans IDEA StatiCa Detail
Cela est réalisable grâce à une combinaison de "Maj" + clic gauche de la souris ou du menu contextuel du clic droit de la souris. La courbe affichée englobe tous les incréments de charge calculés pour le cas de charge ou la combinaison choisi(e). Un incrément de charge spécifique, tel que sélectionné dans le ruban, est clairement marqué sur le graphique.
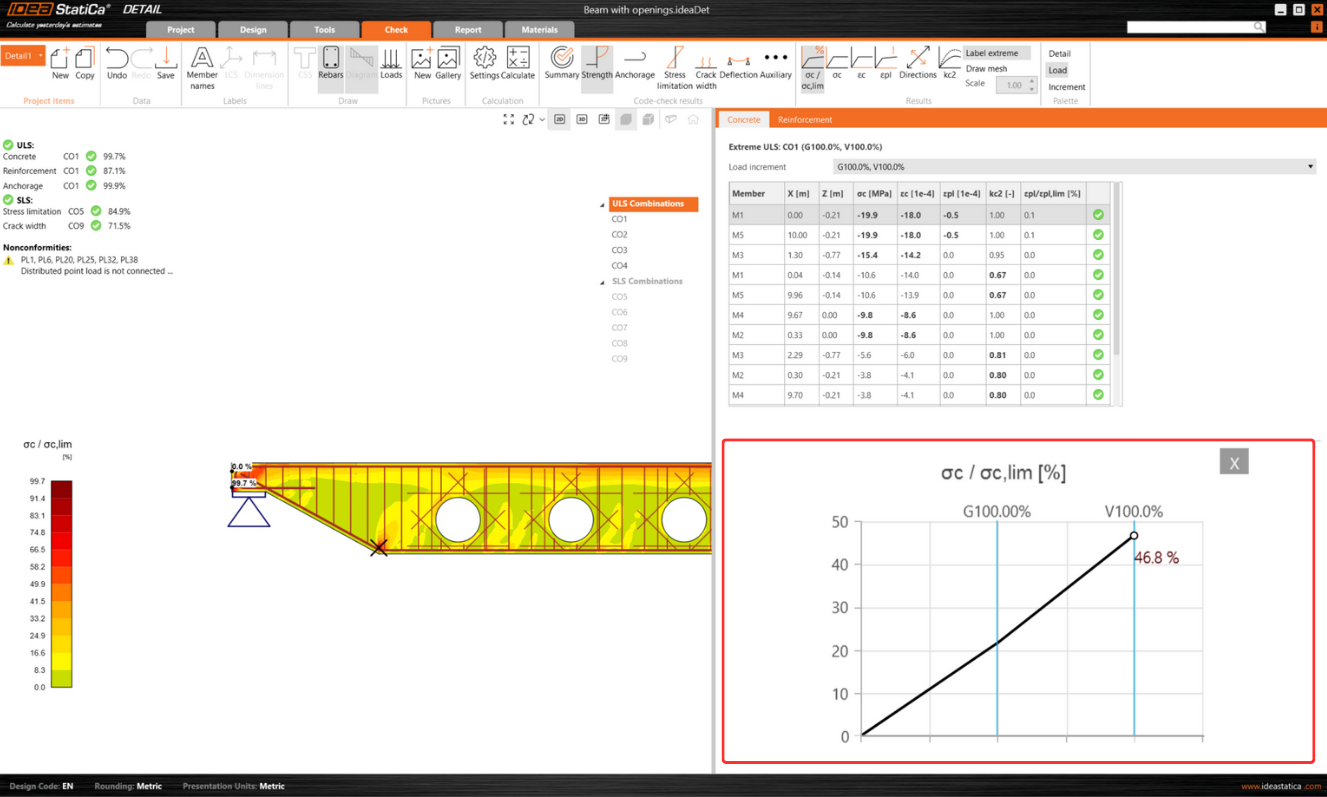
L'axe horizontal du graphique indique la charge appliquée, avec des symboles représentant 100 % de la précontrainte appliquée (P), la charge permanente (G) et la charge variable (V).
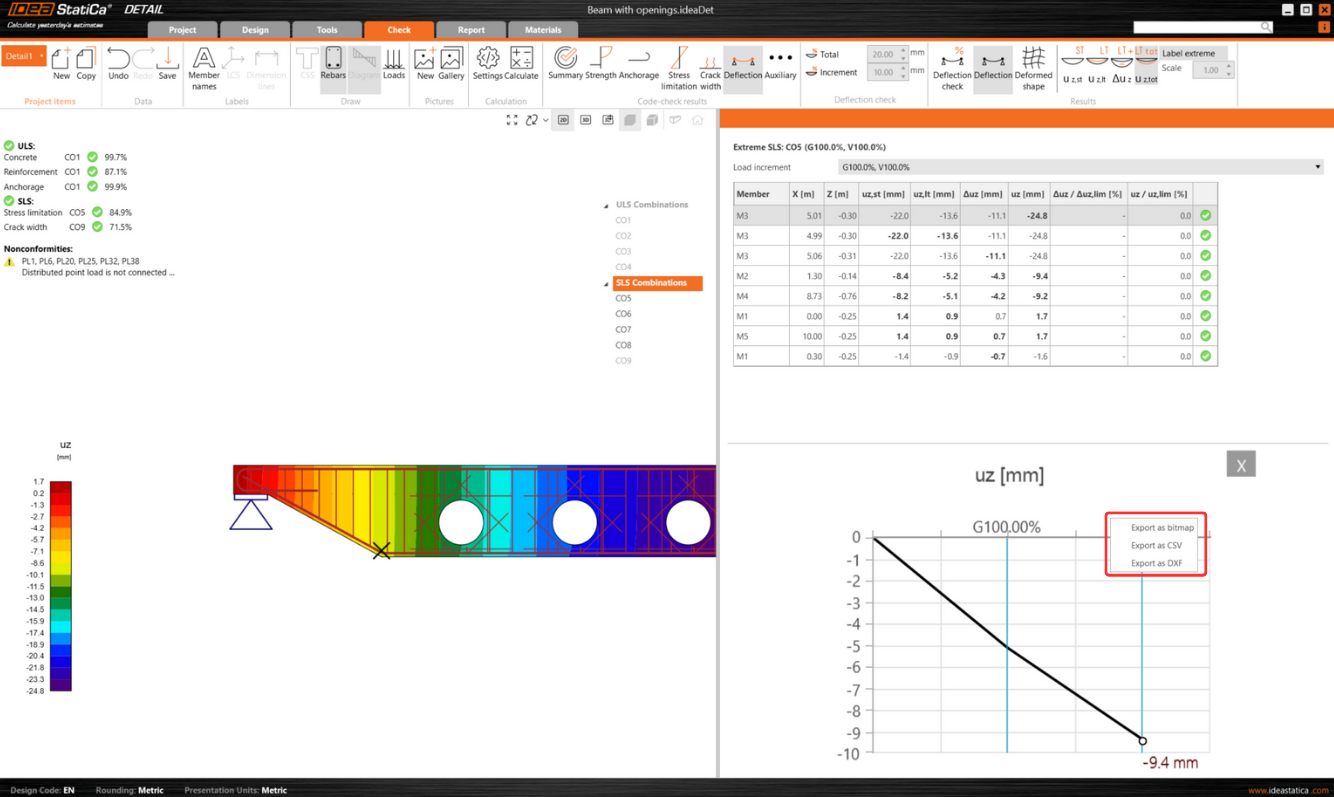
Le système fournit des informations détaillées sur les contraintes, les déformations, la déformation, la largeur des fissures et les forces d'ancrage, entre autres paramètres.
De plus, vous pouvez exporter les données affichées dans le graphique aux formats bitmap, CSV ou DXF. Cette option est accessible via le menu contextuel du graphique, permettant une analyse et une documentation supplémentaires des données en dehors de l'environnement du logiciel.
Publié dans le patch 23.1.3 d'IDEA StatiCa.