Material models (EN)
Concrete - ULS
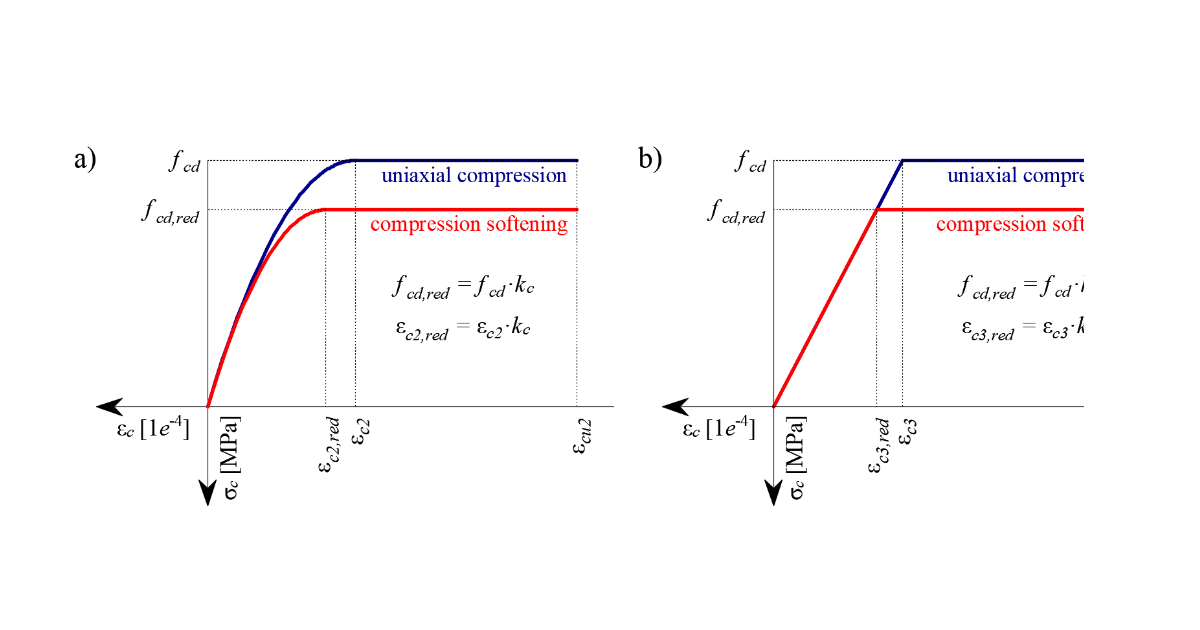
The concrete model implemented in the CSFM is based on the uniaxial compression constitutive laws prescribed by EN 1992-1-1 for the design of cross-sections, which only depend on compressive strength. The parabola-rectangle diagram specified in EN 1992-1-1 (Fig. 26a) is used by default in the CSFM, but designers can also choose a more simplified elastic ideal plastic relationship (Fig. 26b). The tensile strength is neglected, as it is in classic reinforced concrete design.
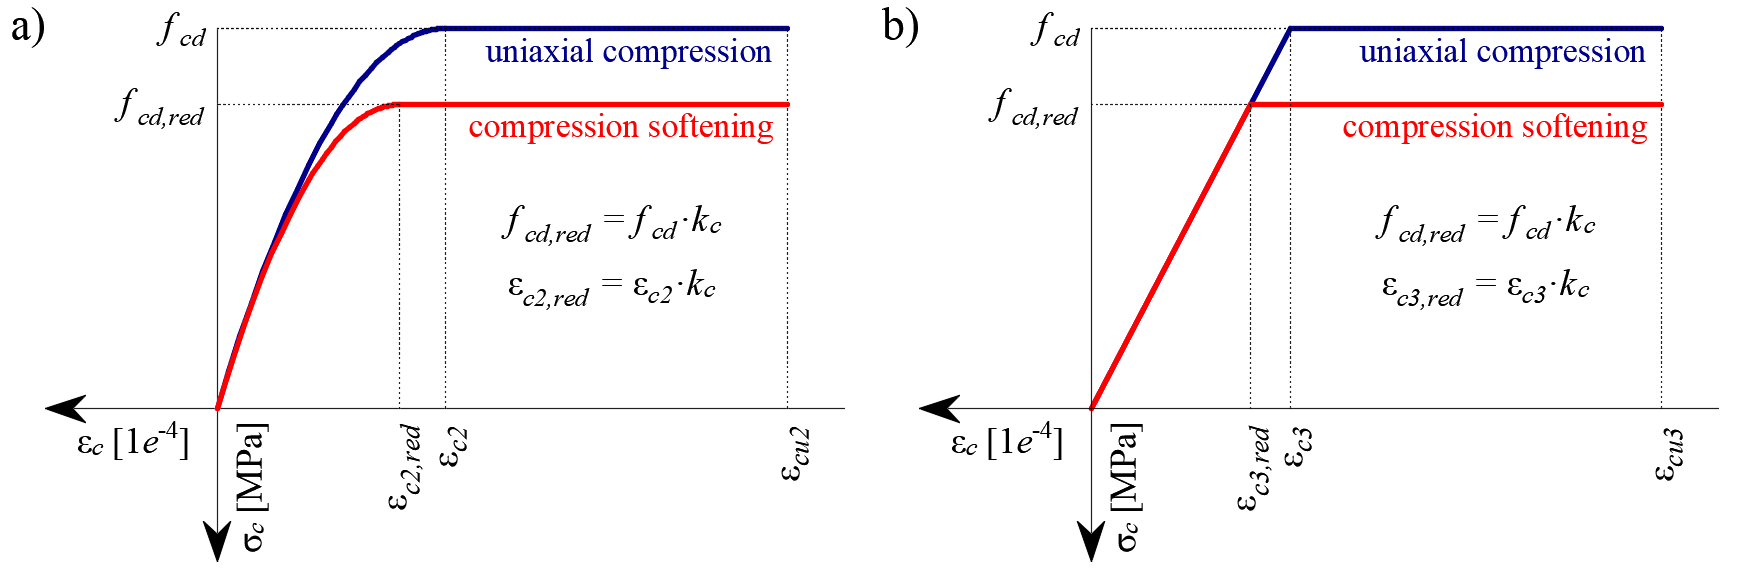
\[ \textsf{\textit{\footnotesize{Fig. 26\qquad The stress-strain diagrams of concrete for ULS: a) parabola-rectangle diagram; b) bilinear diagram.}}}\]
Using default settings, the current implementation of the CSFM in IDEA StatiCa Detail does not consider an explicit failure criterion in terms of strains for concrete in compression (i.e., after the peak stress is reached it considers a plastic branch with εcu2 (εcu3) in value 5% while EN 1992-1-1 assumes ultimate strain less than 0,35%). This simplification does not allow the deformation capacity of structures failing in compression to be verified. However, their ultimate capacity is properly predicted when, in addition to the factor of cracked concrete (kc2 defined in (Fig. 27)), the increase in the brittleness of concrete as its strength rises is considered by means of the \(\eta_{fc}\) reduction factor defined in fib Model Code 2010 as follows:
\[f_{cd}=\frac{f_{ck,red}}{γ_c} = \frac{k_c \cdot f_{ck}}{γ_c} = \frac{\eta _{fc} \cdot k_{c2} \cdot f_{ck}}{γ_c}\]
\[{\eta _{fc}} = {\left( {\frac{{30}}{{{f_{ck}}}}} \right)^{\frac{1}{3}}} \le 1\]
where:
kc is the global reduction factor of the compressive strength
kc2 is the reduction factor due to the presence of transverse cracking
fck is the concrete cylinder characteristic strength (in MPa for the definition of \( \eta_{fc} \)).
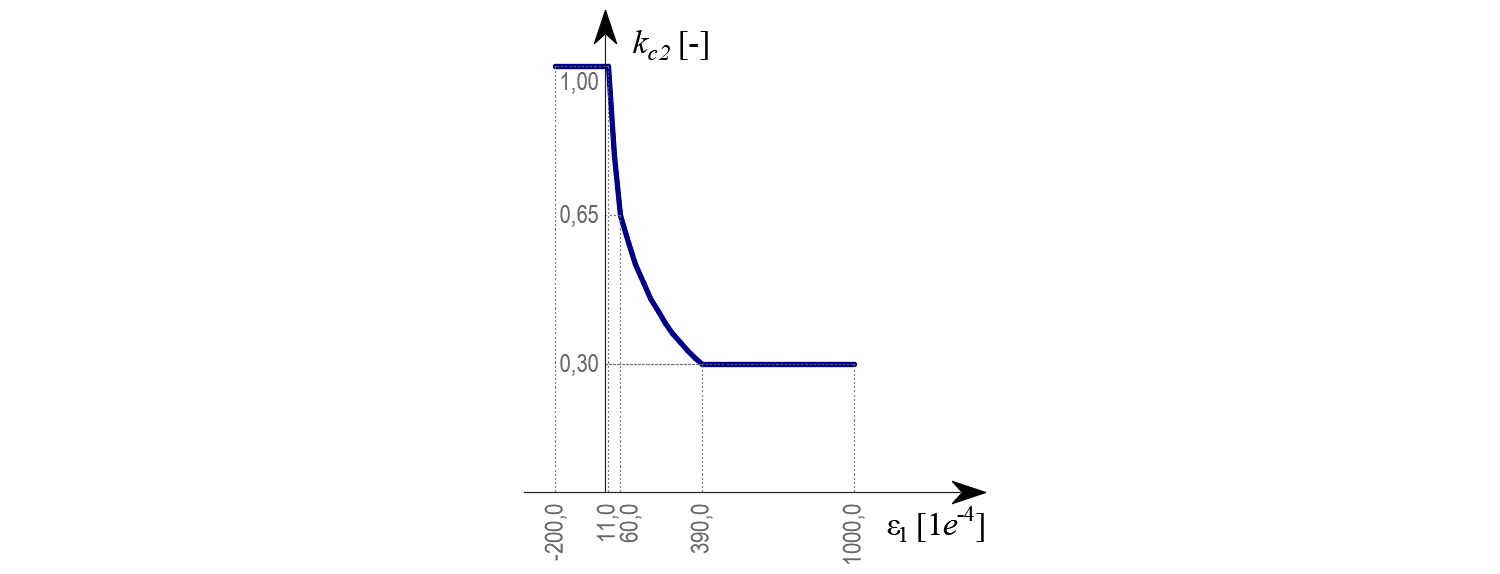
\[ \textsf{\textit{\footnotesize{Fig. 27\qquad The compression softening law.}}}\]
Concrete - SLS
The serviceability analysis contains certain simplifications of the constitutive models which are used for ultimate limit state analysis. A perfect bond is assumed, i.e., the anchorage length is not verified at serviceability. Furthermore, the plastic branch of the stress-strain curve of concrete in compression is disregarded, while the elastic branch is linear and infinite. Compression softening law is not considered. These simplifications enhance the numerical stability and calculation speed and do not reduce the generality of the solution as long as the resultant material stress limits at serviceability are clearly below their yielding points (as required by Eurocode). Therefore, the simplified models used for serviceability are only valid if all verification requirements are fulfilled.
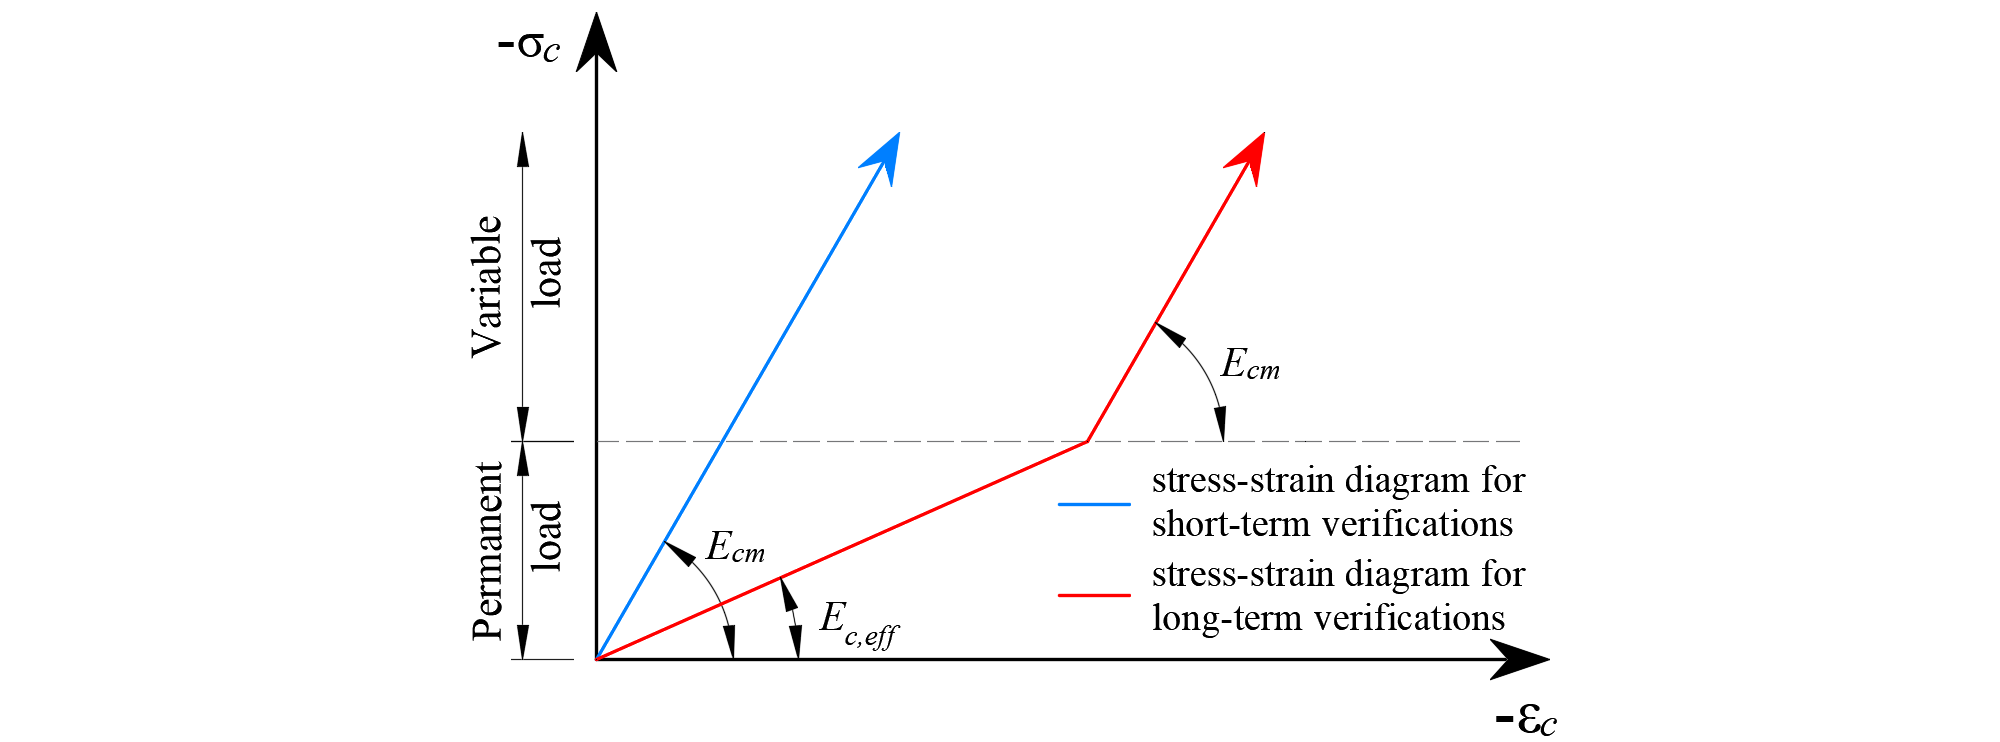
\[ \textsf{\textit{\footnotesize{Fig. 28\qquad Concrete stress-strain diagrams implemented for serviceability analysis: short- and long-term verifications.}}}\]
Long term effects
In serviceability analysis, the long-term effects of concrete are considered using an effective infinite creep coefficient (\(\varphi\), taken as a value of 2.5 by default) which modifies the secant modulus of elasticity of concrete (Ecm) as follows:
\[E_{c,eff} = \frac{E_{cm}}{1+\varphi}\]
When considering long-term effects, a load step with all permanent loads is first calculated considering the creep coefficient (i.e., using the effective modulus of elasticity of concrete, Ec,eff) and, then, the additional loads are calculated without the creep coefficient (i.e., using Ecm). In addition, to conduct short-term verifications, another calculation is performed in which all loads are calculated without the creep coefficient. Both calculations for long and short-term verifications are depicted in Fig. 28.
Reinforcement
By default, the idealized bilinear stress-strain diagram for the bare reinforcing bars typically defined by design codes (Fig. 29) is considered. The definition of this diagram only requires basic properties of the reinforcement to be known during the design phase (strength and ductility class). Whenever known, the actual stress-strain relationship of the reinforcement (hot-rolled, cold-worked, quenched and self-tempered, …) can be considered. The reinforcement stress-strain diagram can be defined by the user, but in this case, it is impossible to assume tension stiffening effect (it is impossible to calculate crack width). Using the stress-strain diagram with horizontal top branch does not allow to the verification of structural durability. Therefore, manual verification of standard ductility requirements is necessary.
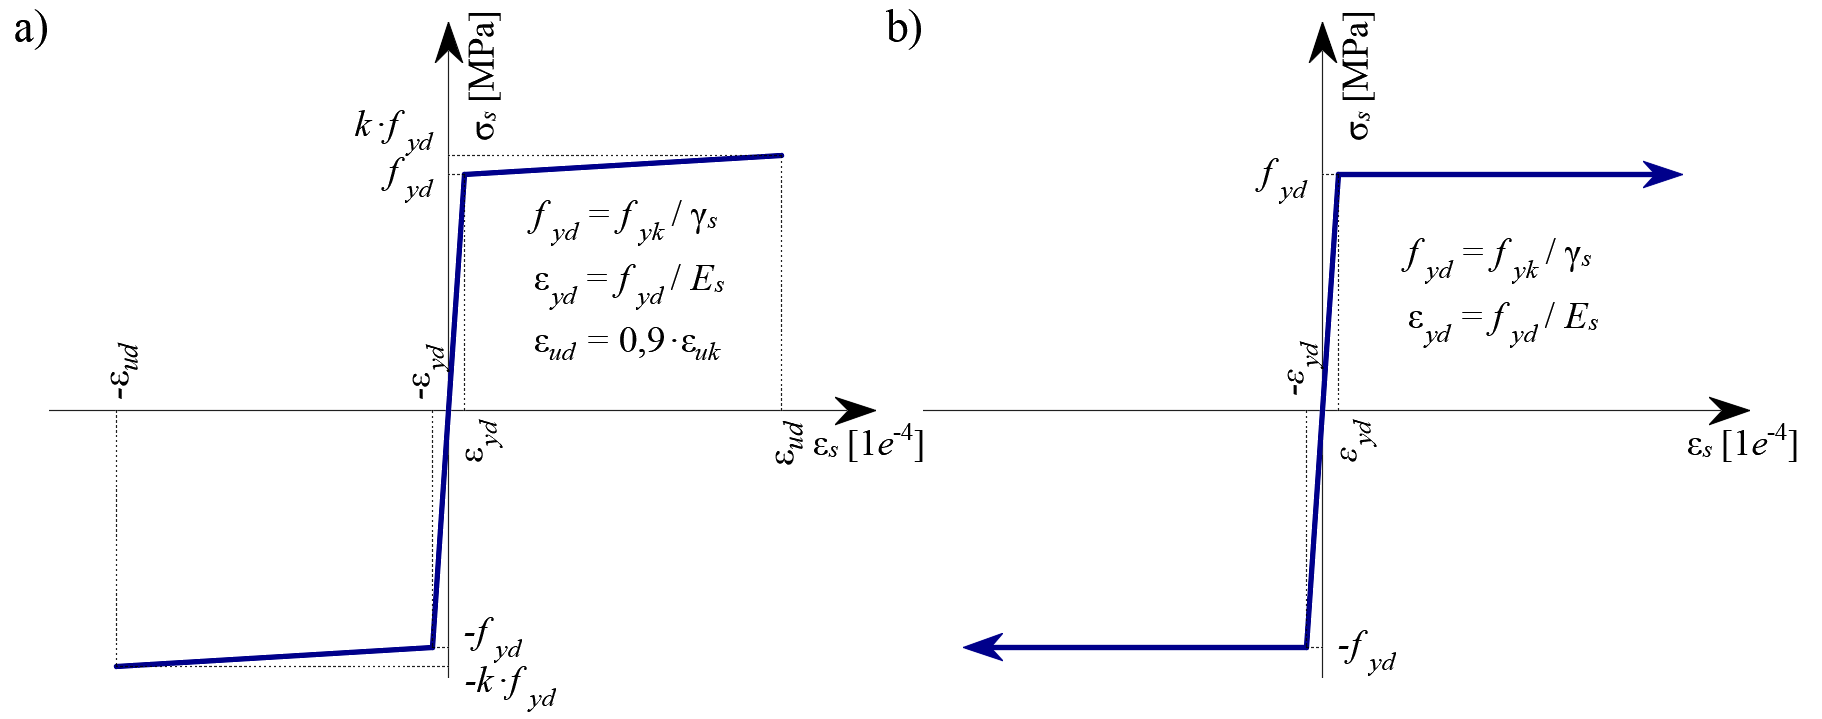
\( \textsf{\textit{\footnotesize{Fig. 29 \qquad Stress-strain diagram of reinforcement: a) bilinear diagram with an inclined top branch; b) bilinear diagram}}}\) \( \textsf{\textit{\footnotesize{with a horizontal top branch.}}}\)
Tension stiffening (Fig. 30) is accounted for automatically by modifying the input stress-strain relationship of the bare reinforcing bar in order to capture the average stiffness of the bars embedded in the concrete (εm), following the approaches presented in Section 1.2.4.
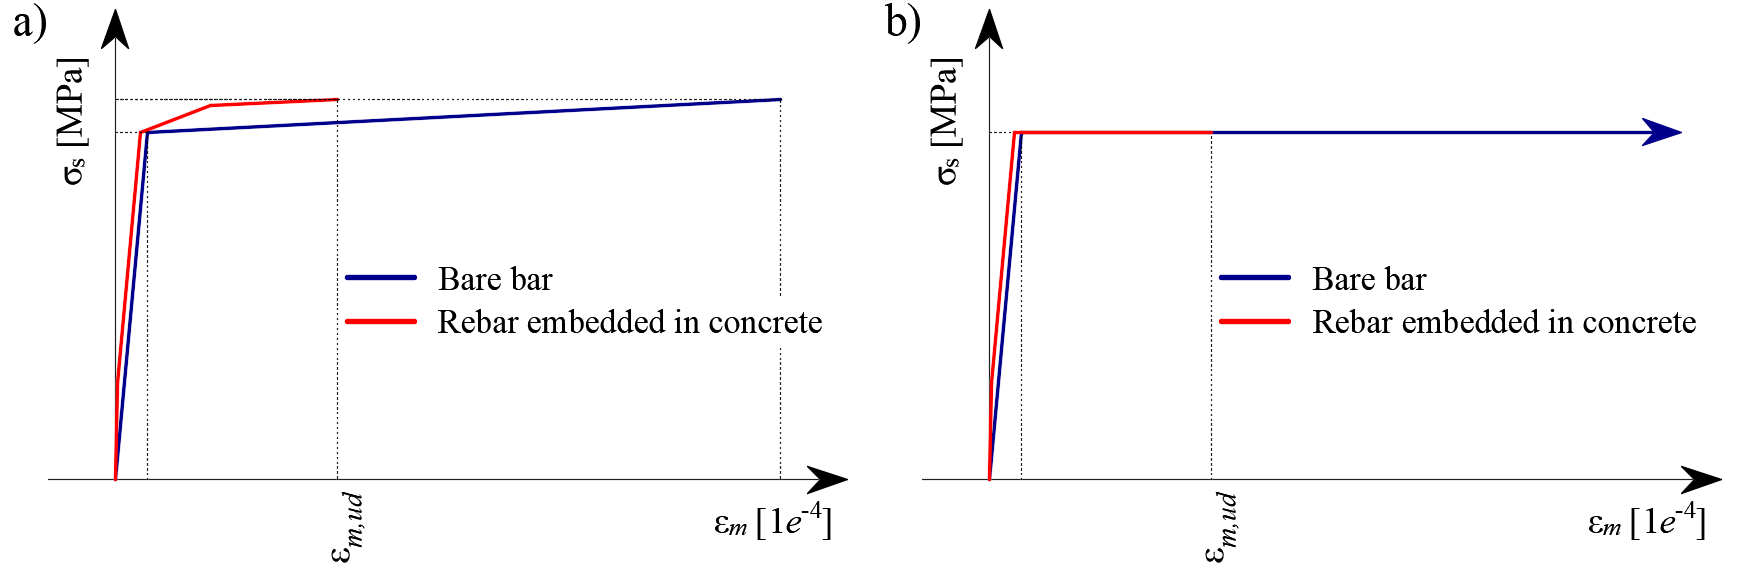
\[ \textsf{\textit{\footnotesize{Fig. 30\qquad Scheme of tension stiffening.}}}\]