Structural element verification in IDEA StatiCa Detail
Assessment of the structure using the CSFM is performed by two different analyses: one for serviceability and one for ultimate limit state load combinations. The serviceability analysis assumes that the ultimate behavior of the element is satisfactory, and the yield conditions of the material will not be reached at serviceability load levels. This approach enables the use of simplified constitutive models (with a linear branch of concrete stress-strain diagram) for serviceability analysis to enhance numerical stability and calculation speed. Therefore, it is recommended the use the workflow presented below, in which the ultimate limit state analysis is carried out as the first step.
Ultimate limit state analysis
The different verifications required by specific design codes are assessed based on the direct results provided by the model. ULS verifications are carried out for concrete strength, reinforcement strength, and anchorage (bond shear stresses).
To ensure a structural element has an efficient design, it is highly recommended to run a preliminary analysis which takes into account the following steps:
- Choose a selection of the most critical load combinations.
- Calculate only Ultimate Limit State (ULS) load combinations.
- Use a coarse mesh (by increasing the multiplier of the default mesh size in Setup (Fig. 23)).
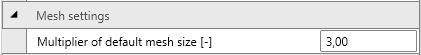
\[ \textsf{\textit{\footnotesize{Fig. 23\qquad Mesh multiplier.}}}\]
Such a model will calculate very quickly, allowing designers to review the detailing of the structural element efficiently and re-run the analysis until all verification requirements are fulfilled for the most critical load combinations. Once all the verification requirements of this preliminary analysis are fulfilled, it is suggested that the complete ultimate load combinations be included and the use of fine mesh size (the mesh size recommended by the program). User can change mesh size by the multiplier, which can reach values from 0.5 to 5 (Fig. 23).
The basic results and verifications (stress, strain, and utilization (i.e., the calculated value/limit value from the code), as well as the direction of principal stresses in the case of concrete elements) are displayed by means of different plots where compression is generally presented in red and tension in blue. Global minimum and maximum values for the entire structure can be highlighted as well as minimum and maximum values for every user-defined part. In a separate tab of the program, advanced results such as tensor values, deformations of the structure, and reinforcement ratios (effective and geometric) used for computing the tension stiffening of reinforcing bars can be shown. Furthermore, loads and reactions for selected combinations or load cases can be presented.
Serviceability limit state analysis
SLS assessments are carried out for stress limitation, crack width, and deflection limits. Stresses are checked in concrete and reinforcement elements according to the applicable code in a similar manner to that specified for the ULS.
The serviceability analysis contains certain simplifications of the constitutive models which are used for ultimate limit state analysis. A perfect bond is assumed, i.e., the anchorage length is not verified at serviceability. Furthermore, the plastic branch of the stress-strain curve of concrete in compression is disregarded, while the elastic branch is linear and infinite. These simplifications enhance the numerical stability and calculation speed, and do not reduce the generality of the solution as long as the resultant material stress limits at serviceability are clearly below their yielding points (as required by standards). Therefore, the simplified models used for serviceability are only valid if all verification requirements are fulfilled.
Crack width calculation
There are two ways of computing crack widths - stabilized and non-stabilized cracking. According to the geometrical reinforcement ratio in each part of the structure is decided, which type of crack calculation model will be used (TCM for stabilized cracking and POM for non-stabilized cracking model).
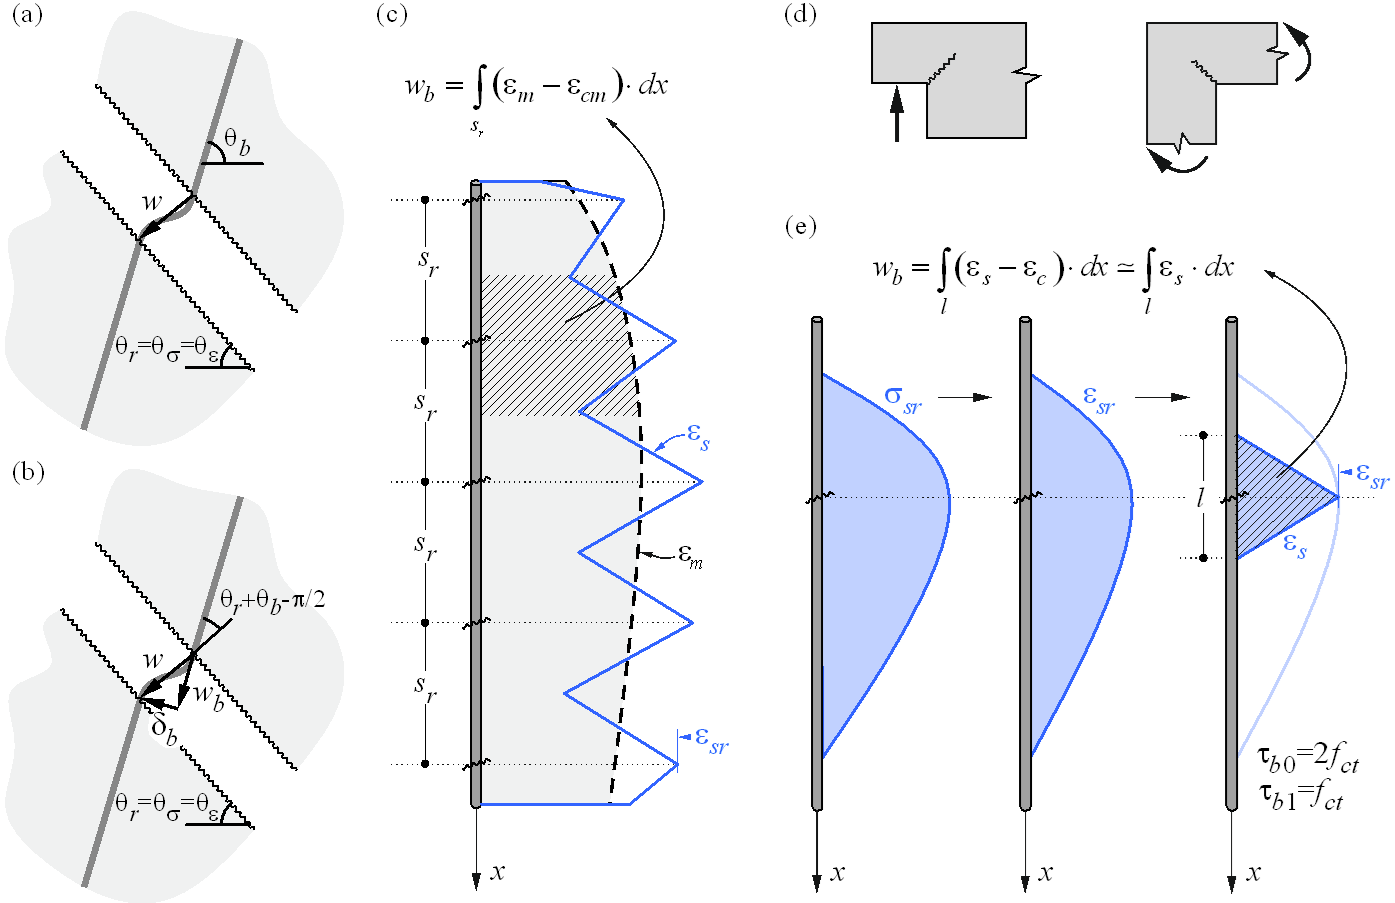
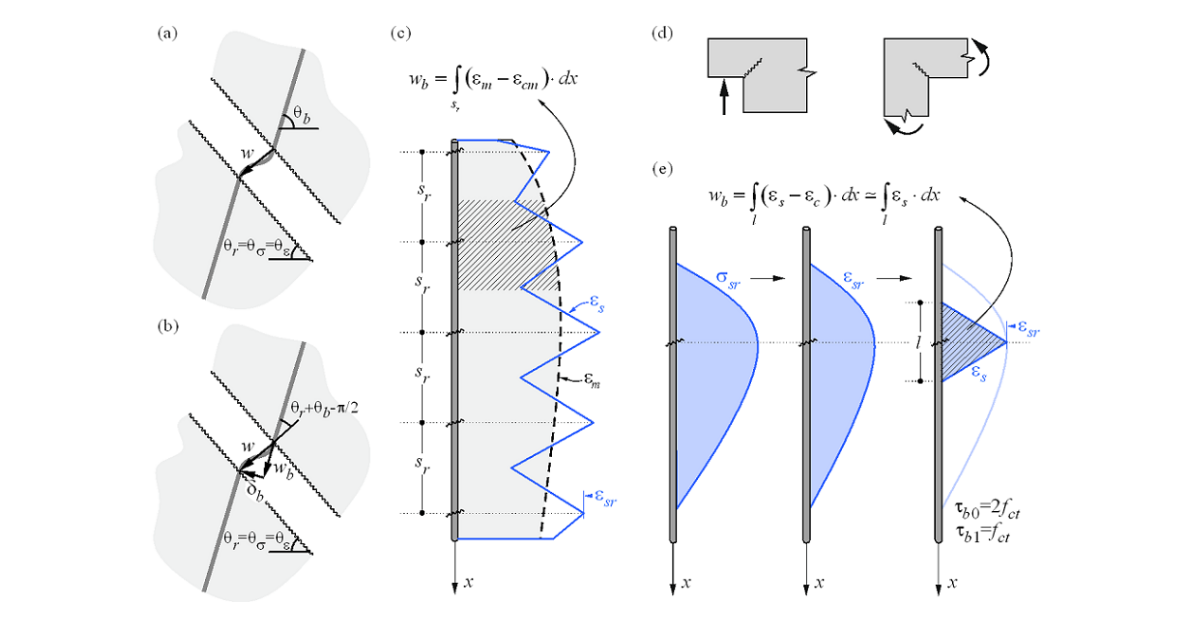
\( \textsf{\textit{\footnotesize{Fig. 24 \qquad Crack width calculation: (a) considered crack kinematics; (b) projection of crack kinematics into the principal}}}\) \( \textsf{\textit{\footnotesize{directions of the reinforcing bar; (c) crack width in the direction of the reinforcing bar for stabilized cracking; (d) cases with}}}\) \( \textsf{\textit{\footnotesize{local non-stabilized cracking regardless of the reinforcement amount; (e) crack width in the direction of the reinforcing bar}}}\)\( \textsf{\textit{\footnotesize{for non-stabilized cracking.}}}\)
While the CSFM yields a direct result for most verifications (e.g., member capacity, deflections…), crack width results are calculated from the reinforcement strain results directly provided by FE analysis following the methodology described in Fig. 24. A crack kinematic without slip (pure crack opening) is considered (Fig. 24a), which is consistent with the main assumptions of the model. The principal directions of stresses and strains define the inclination of the cracks (θr = θs= θe). According to (Fig. 24b), the crack width (w) can be projected in the direction of the reinforcing bar (wb), leading to:
\[w = \frac{w_b}{\cos\left(θ_r + θ_b - \frac{π}{2}\right)}\]
where θb is the bar inclination.
The component wb is consistently calculated based on the tension stiffening models presented in Section 1.2.4 by integrating the reinforcement strains. For those regions with fully developed crack patterns, the calculated average strains (em) along the reinforcing bars are directly integrated along the crack spacing (sr), as indicated in (Fig. 24c). While this approach to calculating the crack directions does not correspond to the real position of the cracks, it still provides representative values that lead to crack width results that can be compared to code-required crack width values at the position of the reinforcing bar.
Special situations are observed at concave corners of the calculated structure. In this case, the corner predefines the position of a single crack that behaves in a non-stabilized fashion before additional adjacent cracks develop. These additional cracks generally develop after the serviceability range (Mata-Falcón 2015), which justifies calculating the crack widths in such a region as if they were non-stabilized (Fig. 25) by means of the model presented in Section 1.2.4.
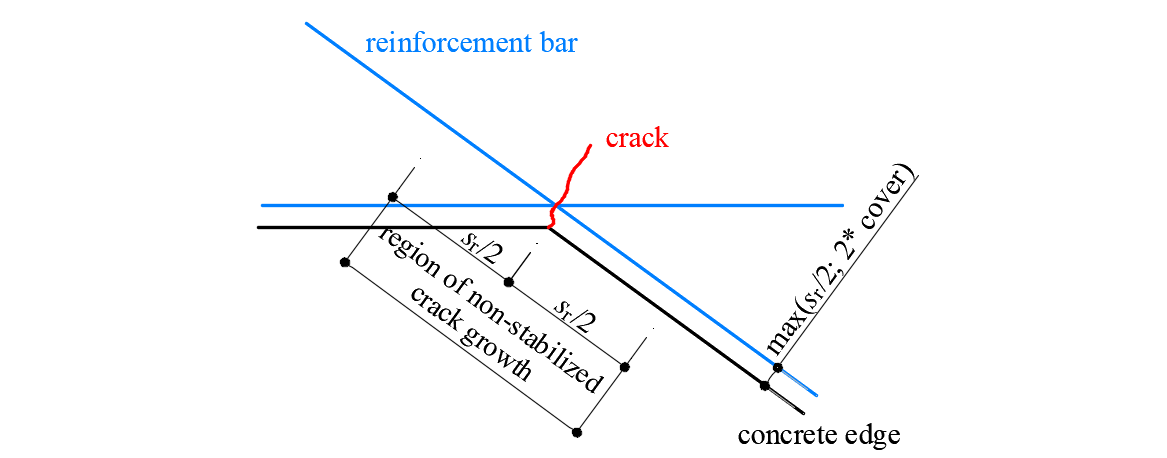
\[ \textsf{\textit{\footnotesize{Fig. 25\qquad Definition of the region at concave corners in which the crack width is computed as if it were non-stabilized.}}}\]