
1.3 Instrumente de proiectare pentru armătură
Flux de lucru și obiective
Scopul instrumentelor de proiectare a armăturii în CSFM este de a ajuta proiectanții să determine locația și cantitatea necesară de bare de armătură în mod eficient. Următoarele instrumente sunt disponibile pentru a ajuta/ghida utilizatorul în acest proces: calculul liniar și optimizarea topologică.
Instrumentele de proiectare a armăturii utilizează modele constitutive mai simplificate decât modelele folosite pentru verificarea finală a structurii. Prin urmare, definirea armăturii în această etapă trebuie considerată un pre-proiect care urmează să fie confirmat/rafinat în etapa de verificare finală. Utilizarea diferitelor instrumente de proiectare a armăturii va fi ilustrată pe modelul prezentat în Fig. 3, care constă dintr-un capăt al unei grinzi simplu rezemate cu înălțime variabilă, supusă unei încărcări uniform distribuite.
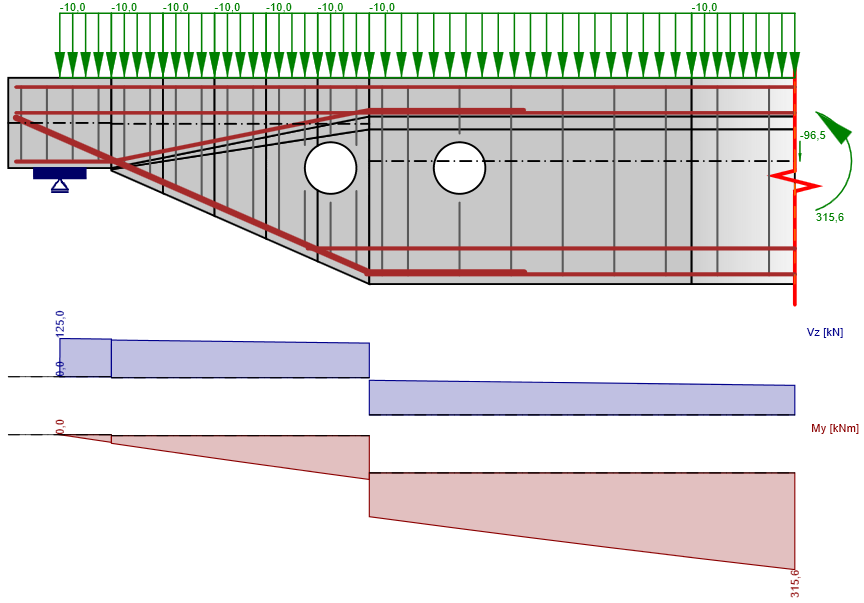
\[ \textsf{\textit{\footnotesize{Fig. 3\qquad Model used to illustrate the use of the reinforcement design tools.}}}\]
Analiză liniară
Analiza liniară consideră proprietăți de material liniar elastice și neglijează armătura în zona de beton. Prin urmare, este un calcul foarte rapid care oferă o primă imagine a locațiilor zonelor de întindere și compresiune. Un exemplu al unui astfel de calcul este prezentat în Fig. 4.
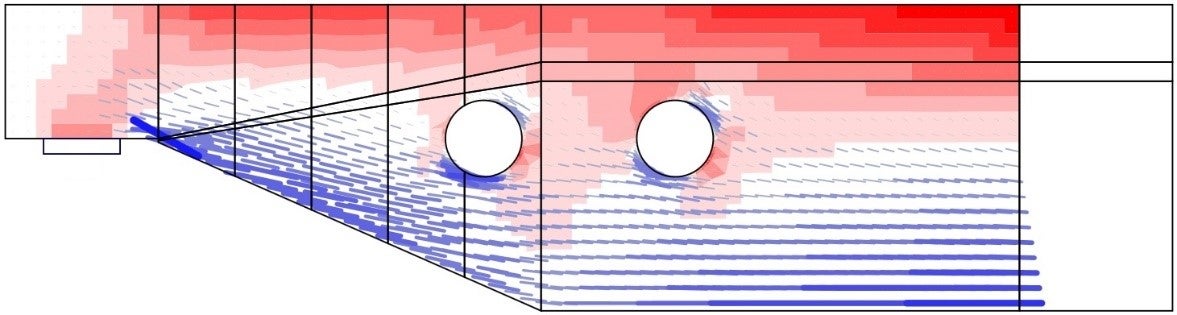
\[ \textsf{\textit{\footnotesize{Fig. 4\qquad Results from the linear analysis tool for defining reinforcement layout}}}\]
\[ \textsf{\textit{\footnotesize{(red: areas in compression, blue: areas in tension).}}}\]
Optimizare topologică
Optimizarea topologică este o metodă care urmărește să găsească distribuția optimă a materialului într-un volum dat pentru o anumită configurație de încărcare. Optimizarea topologică implementată în Idea StatiCa Detail utilizează un model cu elemente finite liniar. Fiecare element finit poate avea o densitate relativă de la 0 la 100%, reprezentând cantitatea relativă de material utilizat. Aceste densități ale elementelor sunt parametrii de optimizare în problema de optimizare. Distribuția rezultată a materialului este considerată optimă pentru setul dat de încărcări dacă minimizează energia totală de deformație a sistemului. Prin definiție, distribuția optimă este, de asemenea, geometria care are cea mai mare rigiditate posibilă pentru încărcările date.
Procesul iterativ de optimizare începe cu o distribuție omogenă a densității. Calculul este efectuat pentru mai multe fracțiuni de volum total (20%, 40%, 60% și 80%), ceea ce permite utilizatorului să selecteze rezultatul cel mai practic. Forma rezultată constă din grinzi cu zăbrele cu biele și tiranți și reprezintă forma optimă pentru cazurile de încărcare date (Fig. 5).
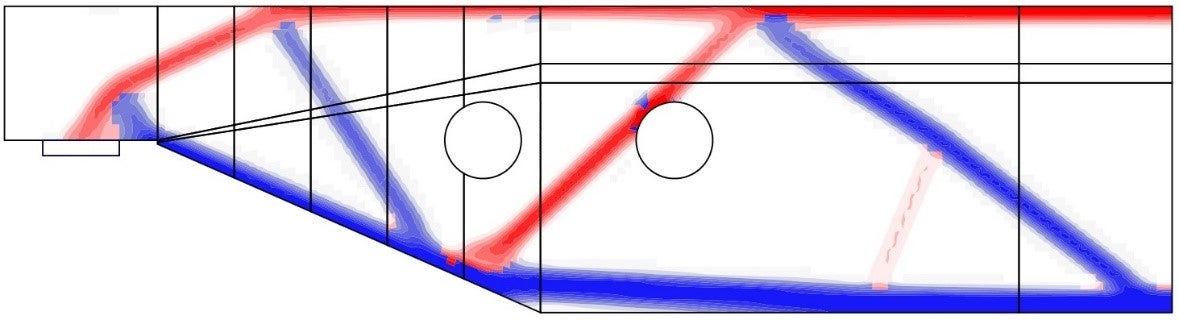
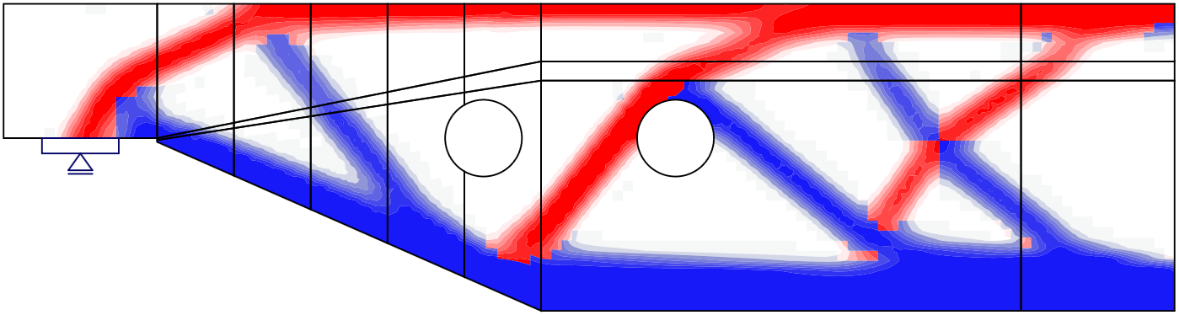
\[ \textsf{\textit{\footnotesize{Fig. 5\qquad Results from the topology optimization design tool with 20\% and 40\% effective volume}}}\]
\[ \textsf{\textit{\footnotesize{(red: areas in compression, blue: areas in tension).}}}\]