The behavior of five reinforced concrete (RC) deep beam specimens was investigated in this chapter. Their strength and deformation capacities were assessed using IDEA StatiCa and compared with design capacities determined through the strut and tie methods (STM) included in ACI 318-05 (2005) and ACI 318-19 (2019) The results were juxtaposed with experimental data.
One of the deep beam test specimens was chosen as a baseline model for further examination through ABAQUS software (2023). This involved the computation and comparison of load- deflection relationship, principal stress distribution, and crack patterns with those observed during experiments (Huizinga, 2007). Additionally, a detailed investigation into the impact of secondary reinforcement on deep beam capacities was undertaken.
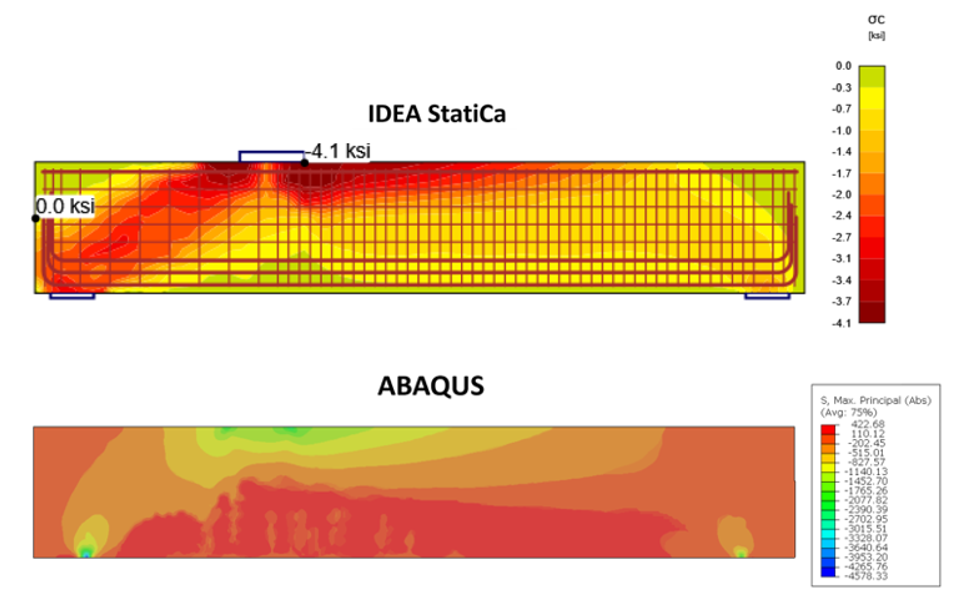
Figure 2.45: Comparison of the calculated principal stresses in concrete between IDEA StatiCa and ABAQUS.
Experimental Study
To assess the structural performance of deep beams, five reinforced concrete (RC) deep beam specimens identified as 1A, 1B, 2A, 3A, and 3B were examined. These specimens were designed by Huizinga (2007) following the strut and tie model (STM) provisions of ACI 318-05 (2005). Fabrication and testing of the specimens were conducted at the Ferguson Structural Engineering Laboratory of the University of Texas at Austin. Consistency in primary reinforcement was maintained across all specimens, while variations were introduced in web reinforcement. The specimens were exclusively designed to withstand vertical loading, with potential horizontal tensile forces disregarded. Test setups were simplified accordingly, focusing solely on vertical loads, with each specimen supported by two bearing plates (Figures 2.7 and 2.8). Among the specimens, 1A was selected as the baseline model and subjected to further analysis using ABAQUS software.
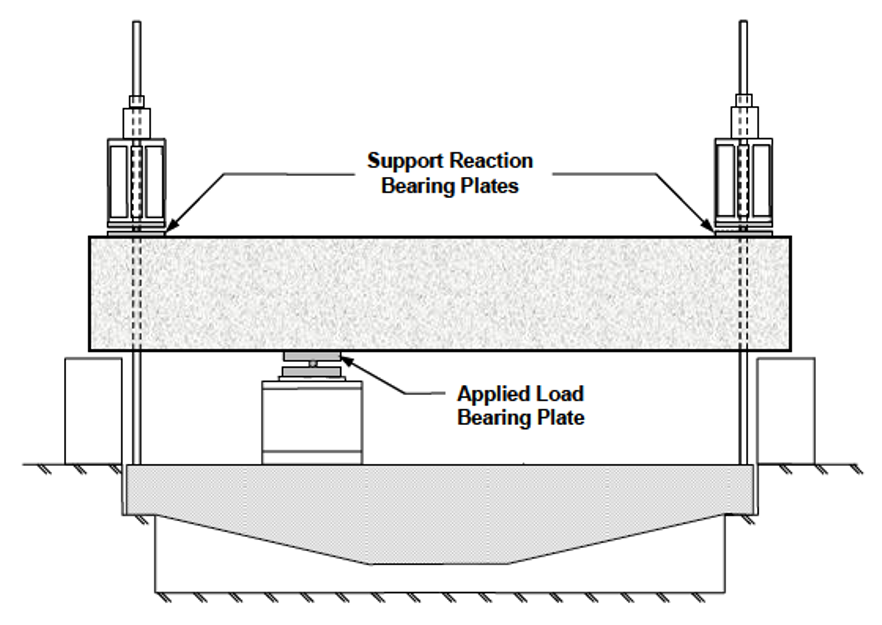
Figure 2.7: Test setup, elevation view for deep beam (Huizinga, 2007).
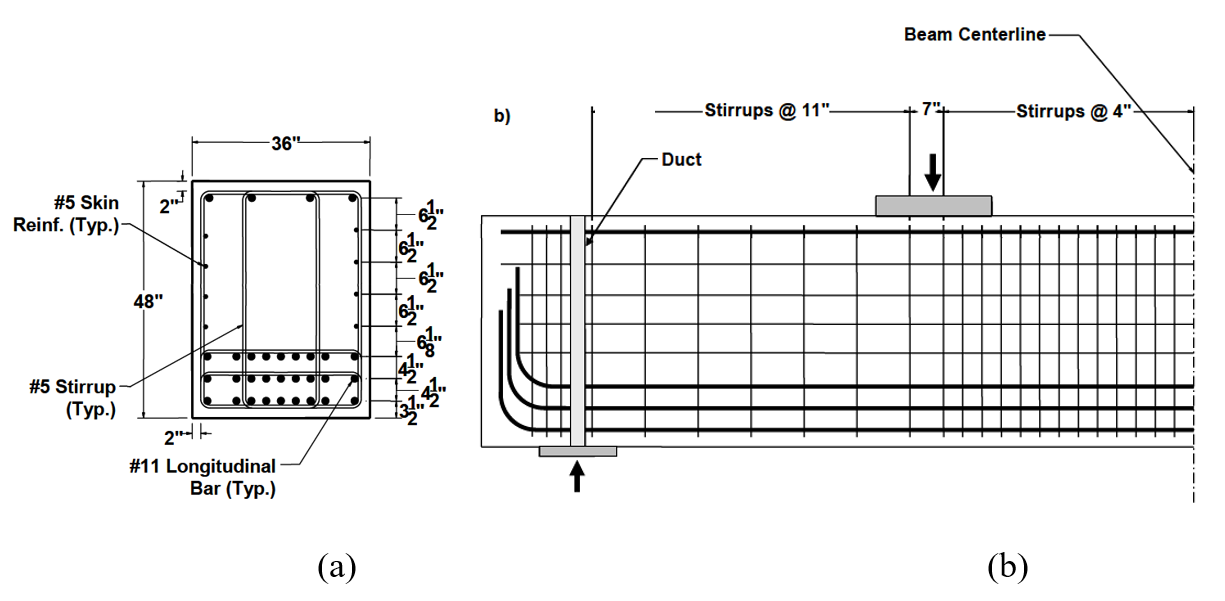
Figure 2.13: Shear span 1A: a) cross-section, and b) elevation (Huizinga, 2007).
IDEA StatiCa Analysis
The CSFM method implemented in IDEA StatiCa Detail was utilized to model and simulate the behavior of the five reinforced concrete deep beams described in Section 2.3.2. The actual or measured compressive strength of concrete, and the yield and ultimate strength of reinforcing steels (as outlined by Huizinga, 2007) were used to model the specimens 1A, 1B, 2A, 3A, and 3B.
Analysis of Baseline Model (Specimen 1A)
Using the measured materials properties presented in Tables 2.4 and 2.5 the IDEA StatiCa model for the baseline specimen was constructed. To validate and improve models and simulations using experimental data, the material factors for concrete (ϕc) and reinforcing steel (ϕs) in IDEA StatiCa were set to 1.0. The self-weight of the deep beam and the applied load were the two types of loads that considered for the analysis in IDEA StatiCa. The maximum applied load was incorporated in the model gradually with 100 increments from zero to maximum value to obtain the load versus deflection relation of the deep beam specimen.
A 4 in. (101.6 mm) thick bearing plate was introduced to the model under the applied load. The dimensions of the bearing plate were used following the value mentioned in Table 2.4 presented by Huizinga (2007). The left support of the deep beam was fixed in horizontal (x) and vertical (z) directions representing a pin support while the right support was fixed in the vertical (z) direction only to act like a roller support. A point bearing plate support was considered for both the end and the dimensions of the plate were consider as 16 in. by 36 in (406.4 mm by 914.4 mm). The thickness of the support bearing plate was considered as 2 in (50.8 mm). The load factors of 1.0 for both load patterns, i.e., self-weight and applied load were used in the IDEA StatiCa analysis focusing on the ultimate limit state (ULS) load combination.
The capacity calculation process for IDEA StatiCa involved incrementally increasing the applied loads until reaching any of the following conditions:
- The concrete reached 100% of its strength capacity under the applied load.
- The reinforcing steel reached 100% of its strength capacity under the applied load.
- The anchorage steel reached 100% of its strength capacity under the applied load.
At the applied load of 1540 kips (6850 kN), the concrete was operating at 99.6% of its capacity, while the reinforcing bars were at 100% of their strength capacity, and the anchoring steel was at 99.9% of its capacity (Figure 2.35). Further increments of the applied load would surpass the capacity of the reinforcement, thus being deemed the maximum load by IDEA StatiCa. Under the load of 1540 kips (6850 kN), deflection of the deep beam specimen under the load was recorded as 0.679 in. (17.25 mm). Figure 2.35 presents the detailed results for deep beam specimen 1A obtained using IDEA StatiCa under the maximum applied load of 1540 kips (6850 kN).
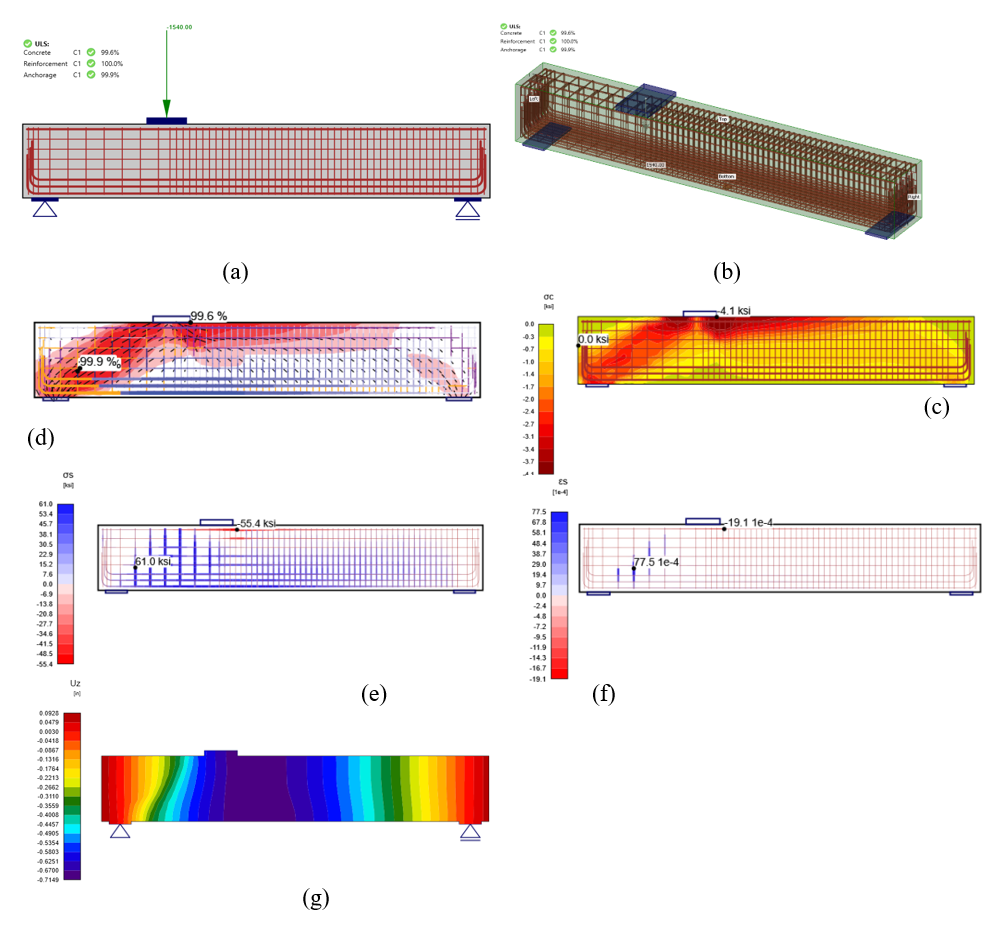
Figure 2.35: Deep beam 1A at 1540 kips (6850 kN) loading: a) IDEA StatiCa results , b) 3D view, c) stress flow, d) concrete principal stress (σc), e) stress in the reinforcement, f) strain in the reinforcement, and g) deflection contour.
ABAQUS Model Development and Analysis
In this section, the baseline model developed in Section 2.4.1 (i.e., Specimen 1A) was reconstructed using ABAQUS software (2023) for finite element (FE) analysis, and the results were compared with those obtained from IDEA StatiCa. In the model, in addition to the self-weight, the vertical load of 1,572.5 kips (6995.3 kN) (in 50 kips increments) was imposed to the top load bearing plate with a thickness of 4 in. (101.6 mm) as illustrated in Figure 2.40. Two boundary conditions similar to the experimental tests and IDEA StatiCa model (i.e., simply supported beam) were applied to Specimen 1A (see Figure 2.40 again). In ABAQUS, the element size was chosen to be 0.5 in. (12.7 mm) after routine mesh sensitivity analysis, resulting in a total of 89,510 elements in the model. The 3D stress, 8-node linear brick reduced integration (i.e., C3D8R) was selected as the element type for the concrete, while the beam element was chosen for the reinforcement bars.
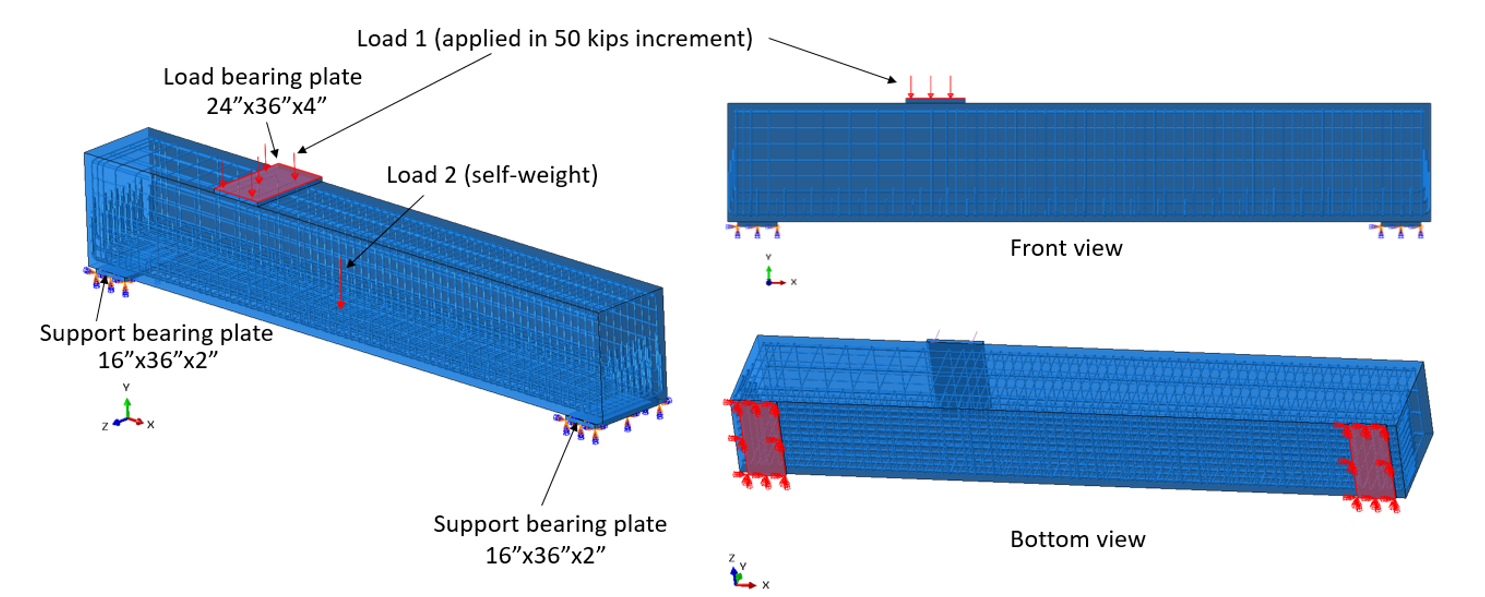
Figure 2.40: Model setup in ABAQUS showing the locations and details of the applied load and boundary conditions.
The embedded region constraint was utilized to incorporate the steel reinforcement within the deep beam A1 (see Figure 2.41). Also, a general surface-to-surface contact was defined between the load and support bearing plates and the concrete specimen. In ABAQUS, the Concrete Damage Plasticity (CDP) constitutive model was used. The required parameters to describe this model were obtained from the experimental data after calibration as they were not explicitly indicated in Ref. (Huizinga, 2007). For the steel bars, the material behavior was modeled using simple bi-linear plasticity. Other parameters, including density, elastic modulus, and Poisson’s ratio were taken exactly from the IDEA StatiCa materials library. The numerical simulation was carried out on a virtual machine with 16 processors (Intel Xenon® Gold Processor 6430 @2.10GHz) and took approximately 51 minutes to finish, while IDEA StatiCa Detail completed the calculation in less than two minutes.
Summary
The behavior of five reinforced concrete (RC) deep beams was investigated utilizing IDEA StatiCa, and their capacities were also determined using the strut-and-tie method (STM) as specified by ACI 318-05. Furthermore, a comparative analysis was conducted between the results obtained from the IDEA StatiCa model for deep beam 1A and those derived from an equivalent ABAQUS model. The specimens were modeled and analyzed using IDEA StatiCa to simulate their experimental behavior accurately. Subsequently, the maximum load-carrying capacity and load versus deflection relationships determined using the IDEA StatiCa were compared with the measured data.
Figure 2.48 compares the loads acquired from experiments, STM, and IDEA StatiCa for deep beam specimens. The IDEA StatiCa results closely match the experimental results, outperforming conventional methods like the STM in offering nearly precise predictions of deep beam performance. Across all specimens (1A, 1B, 2A, 3A, and 3B), IDEA StatiCa consistently exhibits closer alignment with the measured load capacities (Pmax). It should be noted that STM is developed for design purposes and is expected to yield conservative results. On the other hand, IDEA StatiCa is expected to capture the maximum measured response of the deep beams.
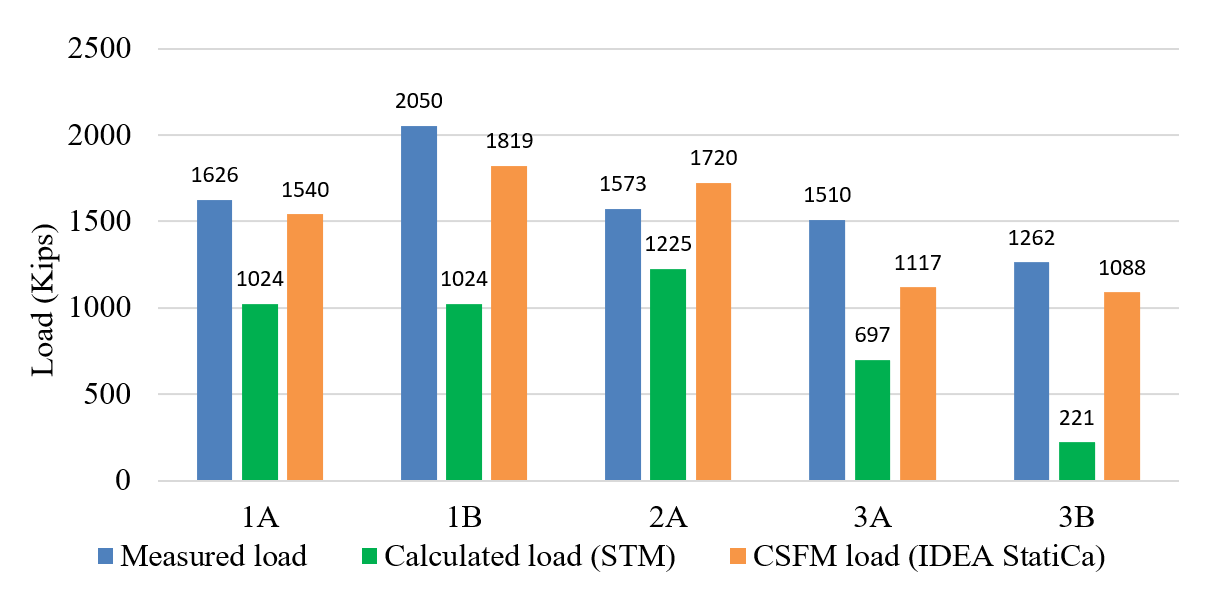
Figure 2.48: Comparison of measured, calculated (STM) and maximum load from IDEA StatiCa for deep beam specimens.
The data presented in Figure 2.48 reveals variations between the measured loads and those calculated using the Compatible Stress Field Method (CSFM) in IDEA StatiCa for the five deep beams. For instance, deep beam 1A exhibits a discrepancy of approximately 5% between the measured load and the CSFM-calculated load. Similarly, deep beam 1B displays a deviation of about 11%. In deep beam 2A, the difference between the measured load and the CSFM-calculated load is approximately 9%. However, the primary objective of the test program was to investigate the shear strength and serviceability behavior of deep beams, with a focus on inducing shear failure in each shear span.
The complete verification study can be downloaded here