Description
This chapter is focused on the verification of component-based finite element method (CBFEM) for the resistance of block shear resistance of bolted connection loaded in shear to the validated research-oriented finite element model (ROFEM) and major analytical models (AM).
Analytical model
There are several analytical models for block shear resistance of bolted connection. The models from codes EN 1993-1-8:2005, EN 1993-1-8:2020, AISC 360-10, and CSA S16-9 are investigated. Furthermore, analytical models by Driver et al. (2005) and Topkaya et al. (2004) are used in comparison.
\[V_{\mathrm{eff,1,Rd}} = \frac{f_\mathrm{u} A_\mathrm{nt}}{\gamma_\mathrm{M2}} + \left(\frac{1}{\sqrt{3}}\right)\frac{f_\mathrm{y} A_\mathrm{nv}}{\gamma_\mathrm{M0}}\]
\[V_{\mathrm{eff,2,Rd}} = 0.5 \cdot \frac{f_\mathrm{u} A_\mathrm{nt}}{\gamma_\mathrm{M2}} + \left(\frac{1}{\sqrt{3}}\right) \frac{f_\mathrm{y} A_\mathrm{nv}}{\gamma_\mathrm{M0}}\]
\[V_{\mathrm{eff,1,Rd}} =\left[A_\mathrm{nt} f_\mathrm{u} + \min \left(\frac{A_\mathrm{gv} \cdot f_\mathrm{y}}{\sqrt{3}} \; ; \;\frac{A_\mathrm{nv} f_\mathrm{u}}{\sqrt{3}}\right)\right] \bigg/ \gamma_\mathrm{M2}\]
\[V_{\mathrm{eff,2,Rd}} =\left[0.5 A_\mathrm{nt} f_\mathrm{u} + \min \left(\frac{A_\mathrm{gv} \cdot f_\mathrm{y}}{\sqrt{3}}\;;\;\frac{A_\mathrm{nv} f_\mathrm{u}}{\sqrt{3}}\right)\right] \bigg/ \gamma_\mathrm{M2}\]
\[\varphi R_\mathrm{n} =\varphi \left(0.6 f_u A_\mathrm{nv} + U_\mathrm{bs} f_\mathrm{u} A_\mathrm{nt}\right)\leq 0.6 f_\mathrm{y} A_\mathrm{gv} + U_\mathrm{bs} f_\mathrm{u} A_\mathrm{nt}\]
\[T_\mathrm{r} =\varphi_\mathrm{u} \left[U_t A_\mathrm{nt} f_\mathrm{u} + 0.6 A_\mathrm{gv} \frac{f_\mathrm{y} + f_\mathrm{u}}{2} \right]\]
where:
\(f_\mathrm{y}\) - yield strength
\(f_\mathrm{u}\) - ultimate strength
\(\gamma_{\mathrm{M2}}\), \(\varphi_\mathrm{u}\), \(\varphi\) - safety factors
For \(A_\mathrm{nt}\), \(A_\mathrm{nv}\), \(A_\mathrm{gv}\) see Fig. 5.6.1.

\[ \textsf{\textit{\footnotesize{Fig. 5.6.1 Failure planes during the block shear failure}}}\]
Validation and verification of resistance
The experiments by Huns et al. (2002) are used for validation of ROFEM created by Sekal (2019) in ANSYS software, see Fig. 5.6.2. True stress-strain material diagram is used. Only the thinnest plate meant to fail are modeled. Bolts are simplified as only bearing displacements on the half-circle of the bolt hole. The displacements in all holes are coupled. The ROFEM model shows very good agreement with the test results.
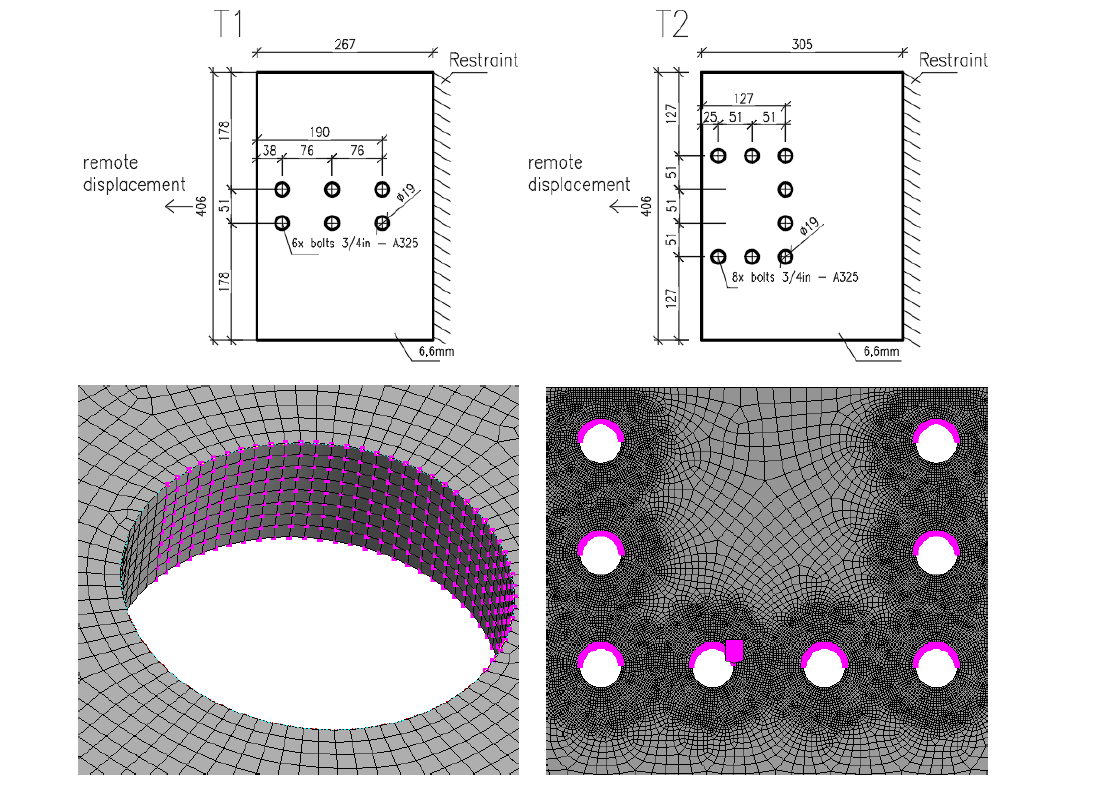
\[ \textsf{\textit{\footnotesize{Fig. 5.6.2 ROFEM with fine mesh of the specimens tested by Huns et al. (Sekal, 2019)}}}\]
Design-oriented CBFEM model uses shell elements with rather coarse mesh. The mesh is predefined near bolt holes. Bolts are modeled as nonlinear springs which are connected to the nodes at the edges of the bolt’s holes by links. The bilinear material diagram with negligible strain-hardening is used for plates. The limit resistance of a group of bolts in bearing is determined when the plastic strain at the plate reaches 5 % (EN 1993-1-5: 2005). The bearing and hole tear-out resistances of each individual bolt are checked by formulas in appropriate code.
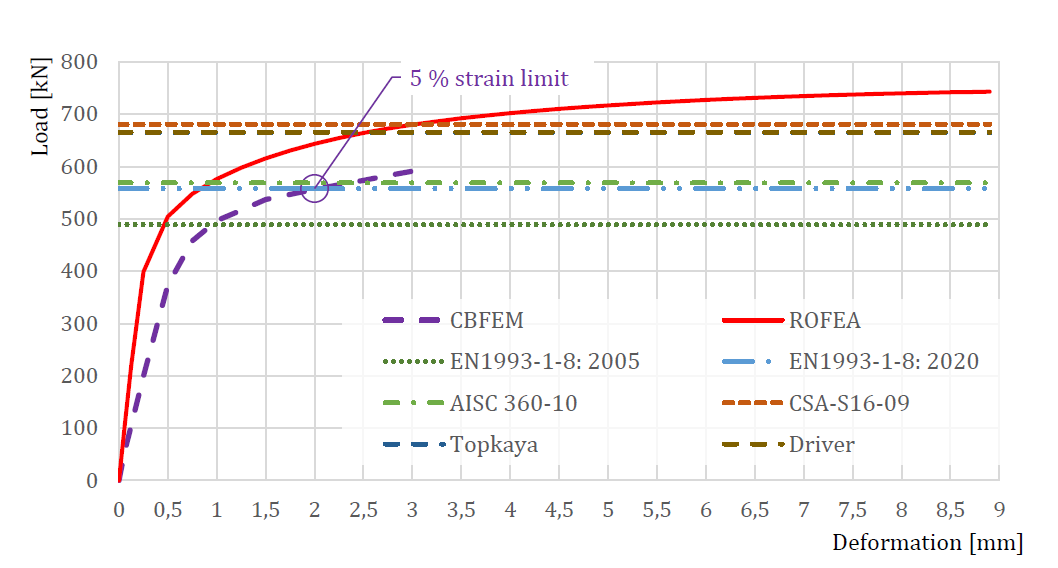
\[ \textsf{\textit{\footnotesize{Fig. 5.6.3 Comparison of specimen T2 tested by Huns et al. (Sekal, 2019)}}}\]
The comparison of ROFEM, CBFEM, and analytical models is shown in Fig. 5.6.3. The most conservative is the model in EN 1993-1-8: 2005 because, unlike other models, it uses the net shear plane in combination with yield strength. Yielding in the gross shear plane is observed in experiments and numerical models. In the next generation of prEN 1993-1-8:2022, the formula for block shear resistance will be changed. The stiffness of CBFEM model is lower compared to ROFEM. In the experiments, the holes were drilled with the same diameter as bolts, so there was no initial slip. The ROFEM model also disregards any slip, but in CBFEM, the shear model of bolts is approximated with the assumption of the regular bolt holes.
Sensitivity study
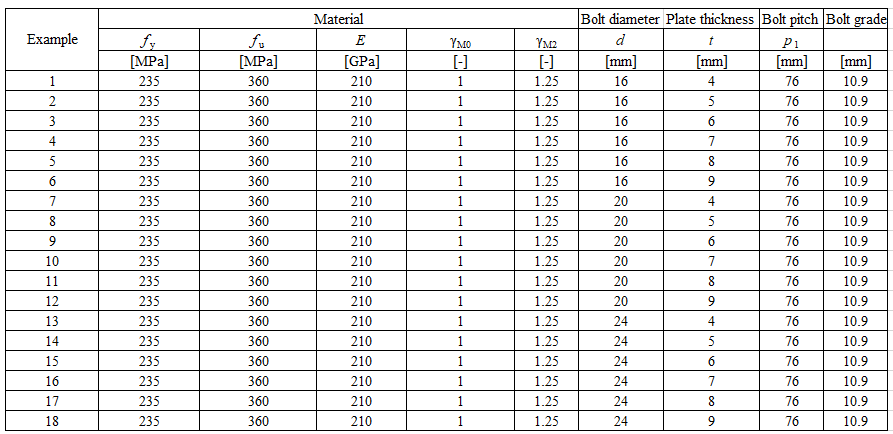
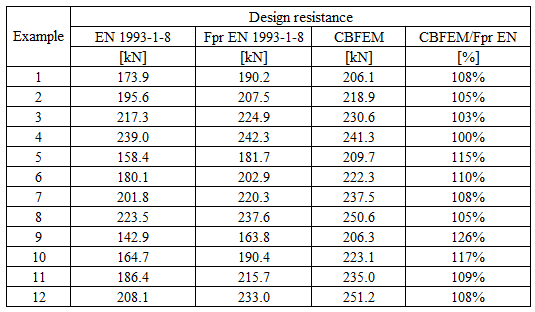
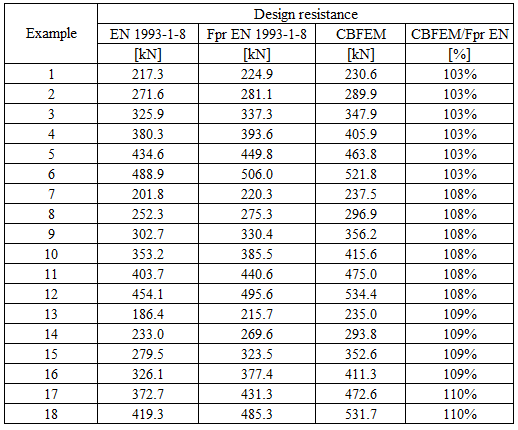
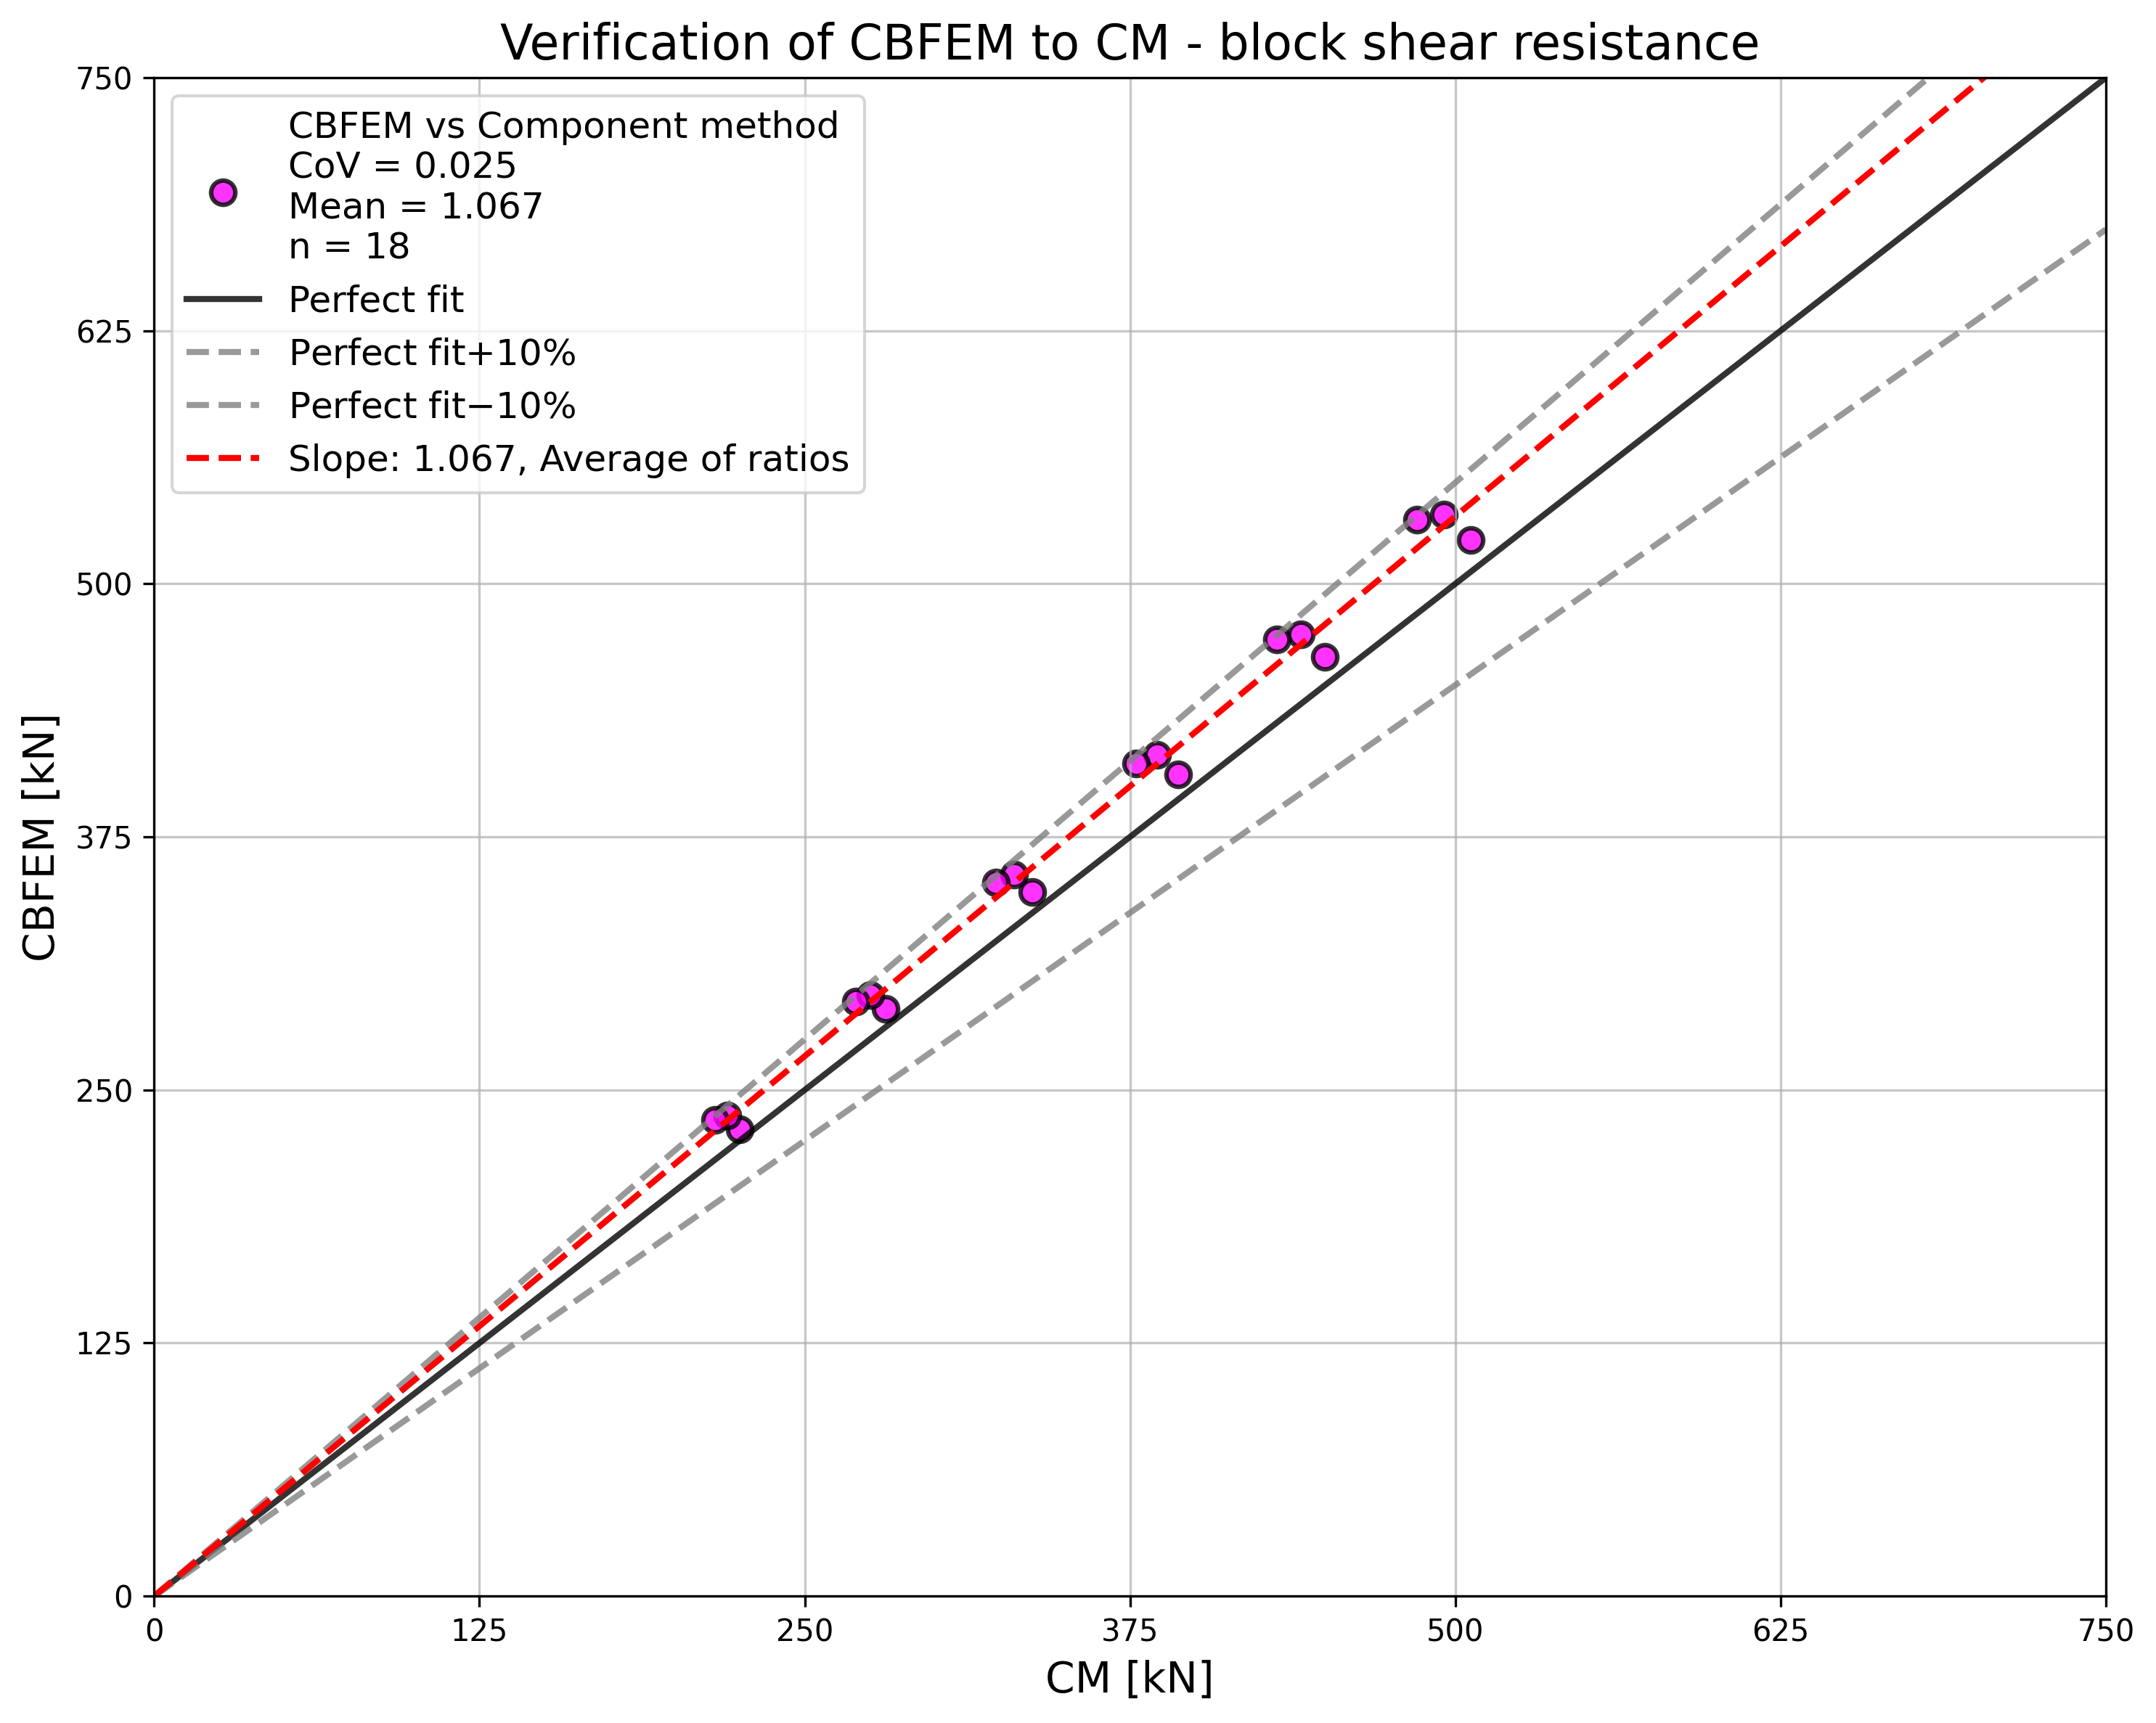
Specimen T1 was used for the study how bolt pitch, Fig. 5.6.4, and plate thickness, Fig. 5.6.6, affects the block shear resistance. The models provide expected results. Tables 5.6.1 and 5.6.2 show examples overview. Drawing 5.6.1 shows joint geometry ang dimensions. Results of verification are shown in Tables 5.6.3 and 5.6.4 and in Fig. 5.6.5. , Fig. 5.6.7.
Table 5.6.1 Examples overview. Effect of bolt pitch
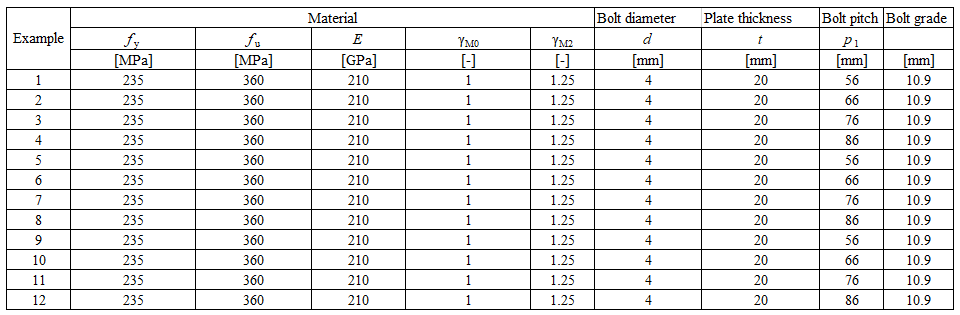
Table 5.6.2 Examples overview. Effect of plate thickness

\[ \textsf{\textit{\footnotesize{Drawing 5.6.1 Joint geometry and dimensions}}}\]
Effect of bolt pitch
Table 5.6.3 Comparison of results of design resistances predicted by CBFEM, EN 1993-1-8 and Fpr EN 1993-1-8. Effect of bolt pitch
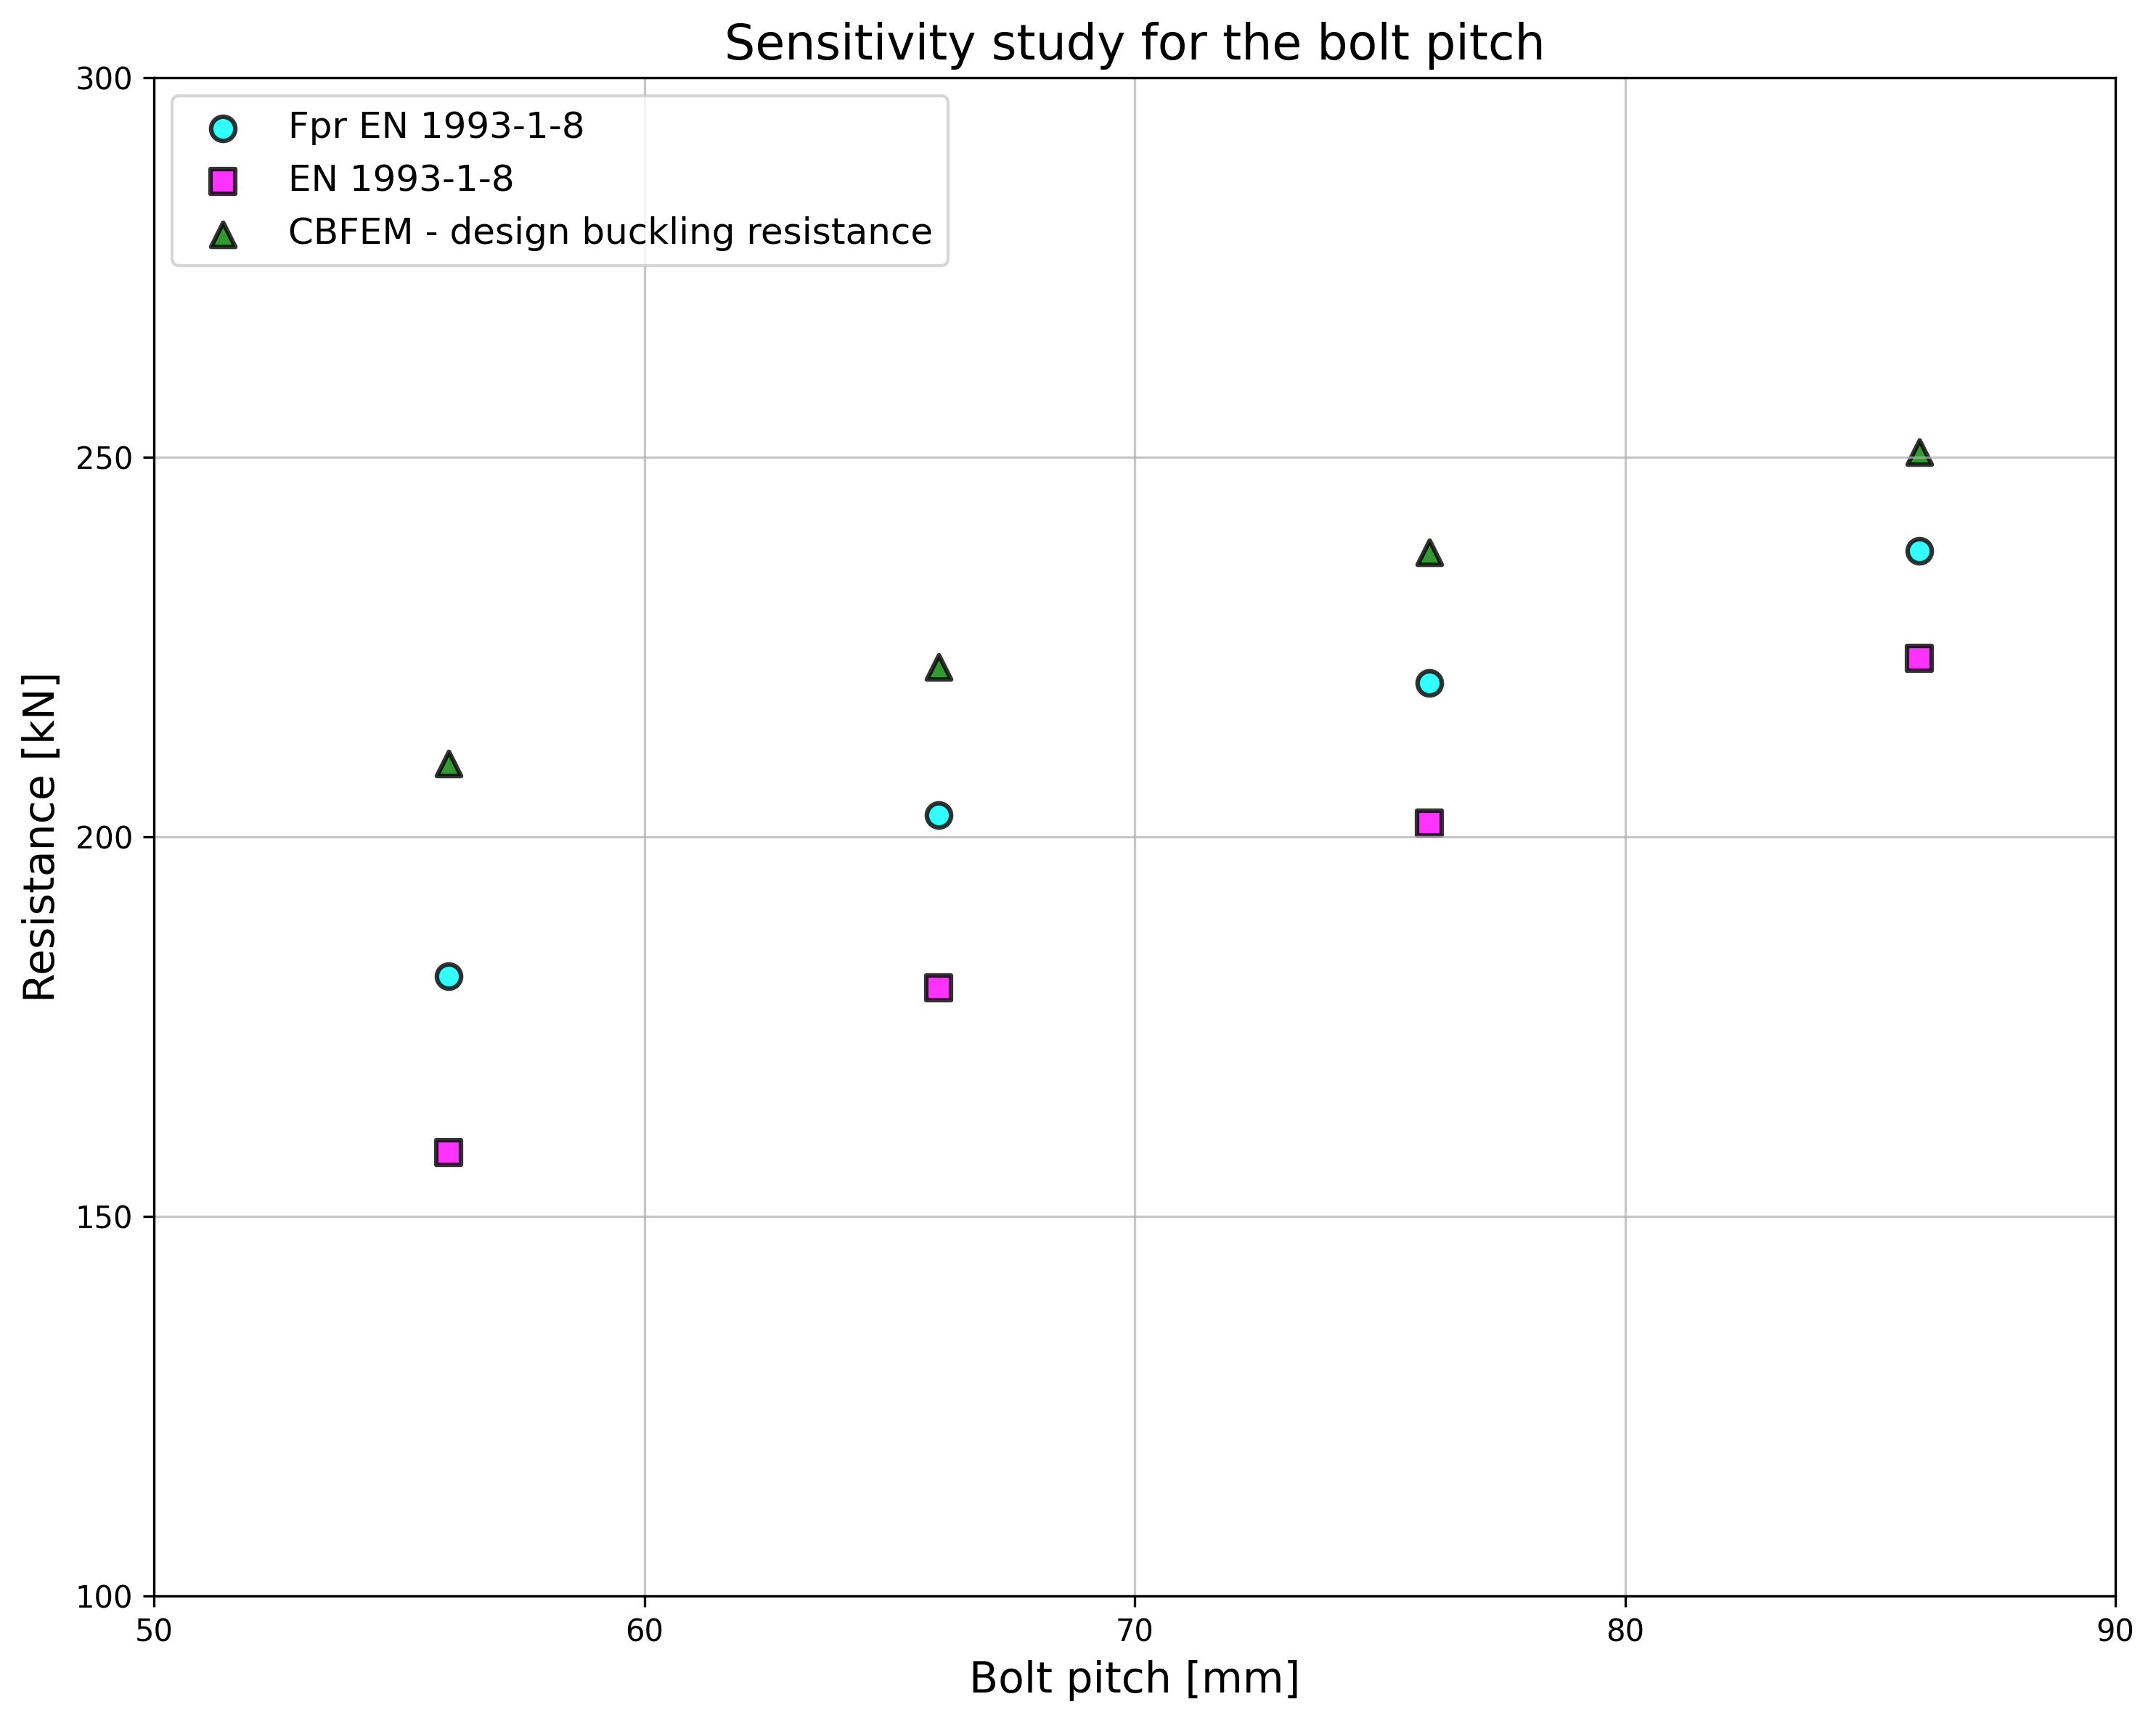
\[ \textsf{\textit{\footnotesize{Fig. 5.6.4 Effect of bolt pitch}}}\]

\[ \textsf{\textit{\footnotesize{Fig. 5.6.5 Verification of resistance determined by CBFEM to Fpr EN 1993-1-8}}}\]
Effect of plate thickness
Table 5.6.4 Comparison of results of design resistances predicted by CBFEM, EN 1993-1-8 and Fpr EN 1993-1-8. Effect of plate thickness
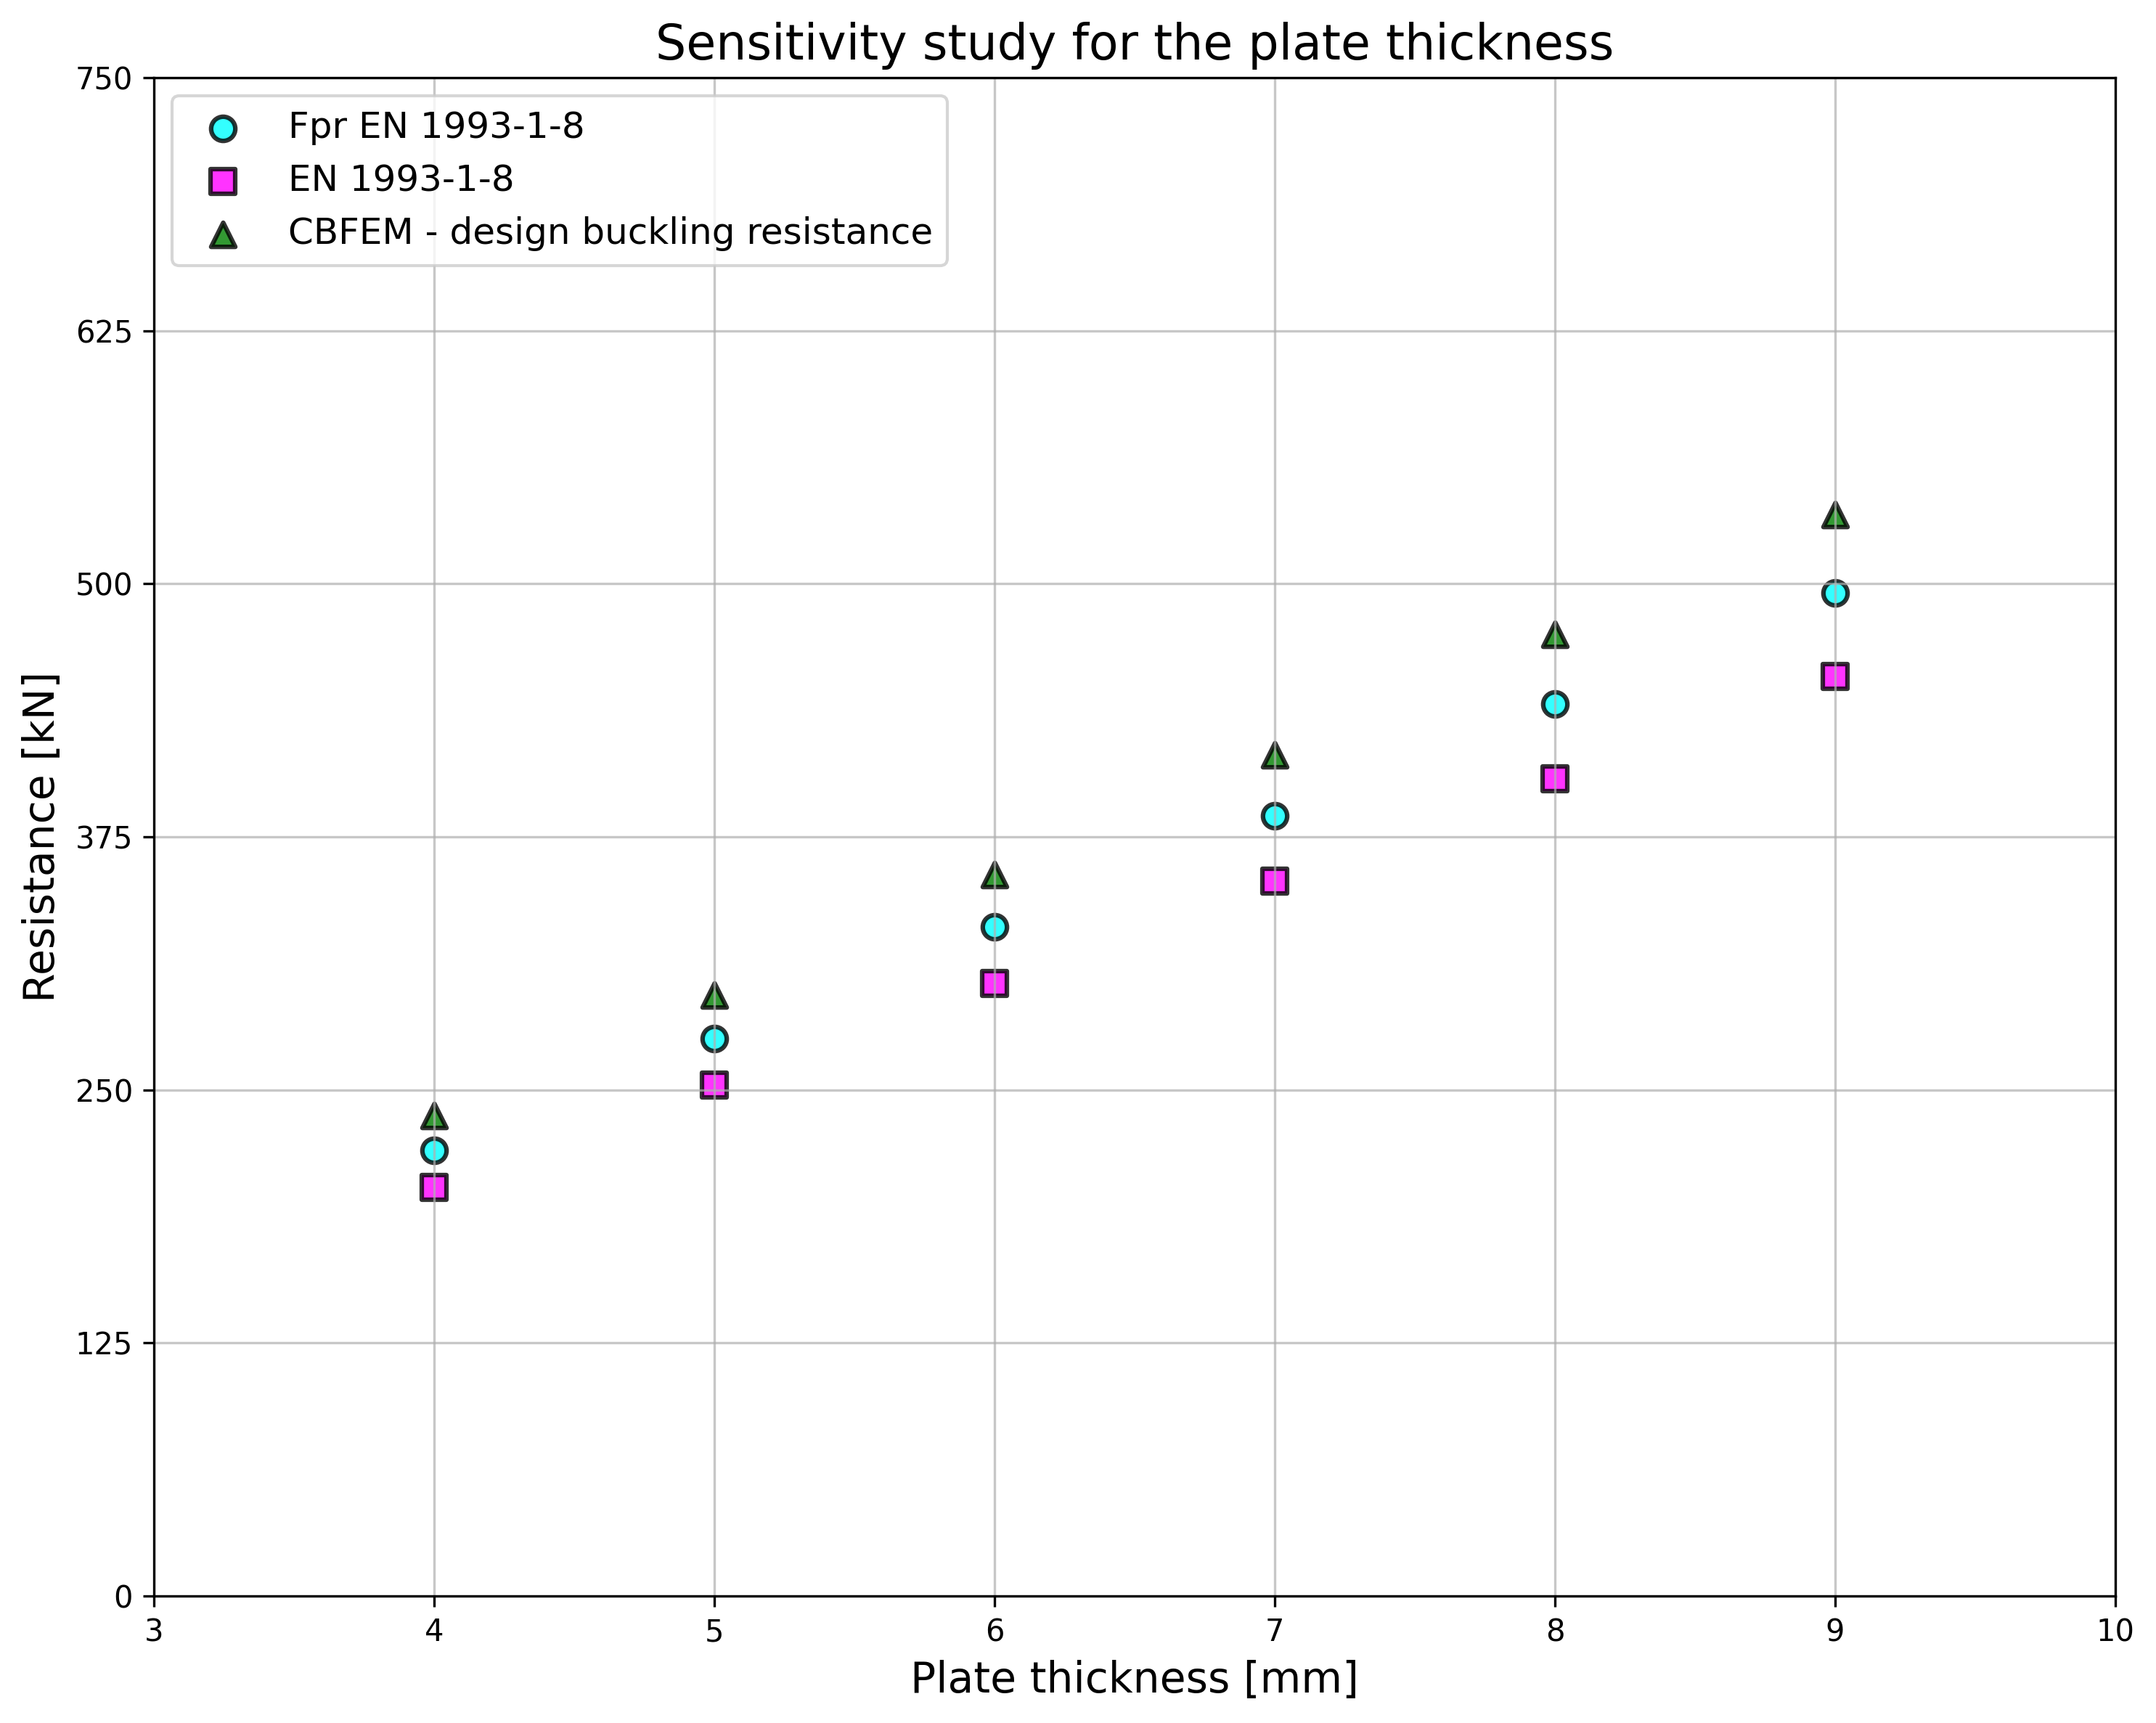
\[ \textsf{\textit{\footnotesize{Fig. 5.6.6 Effect of plate thickness}}}\]
\[ \textsf{\textit{\footnotesize{Fig. 5.6.7 Verification of resistance determined by CBFEM to Fpr EN 1993-1-8}}}\]
Benchmark example
Inputs
Member
- Steel S450
- Rolled I
- b = 300mm
- h = 19mm
- tf = 7mm
- tw = 6.2mm
Plate- bearing member
- Steel S235
- b = 400mm
- t = 4mm
Bolts
- 6 × M16 10.9
- Distances e1 = 38 mm; p1 = 70 mm; p2 = 56 mm
Outputs
- Design resistance NRd = 206.1 kN
- Critical is plastic strain of gusset plate
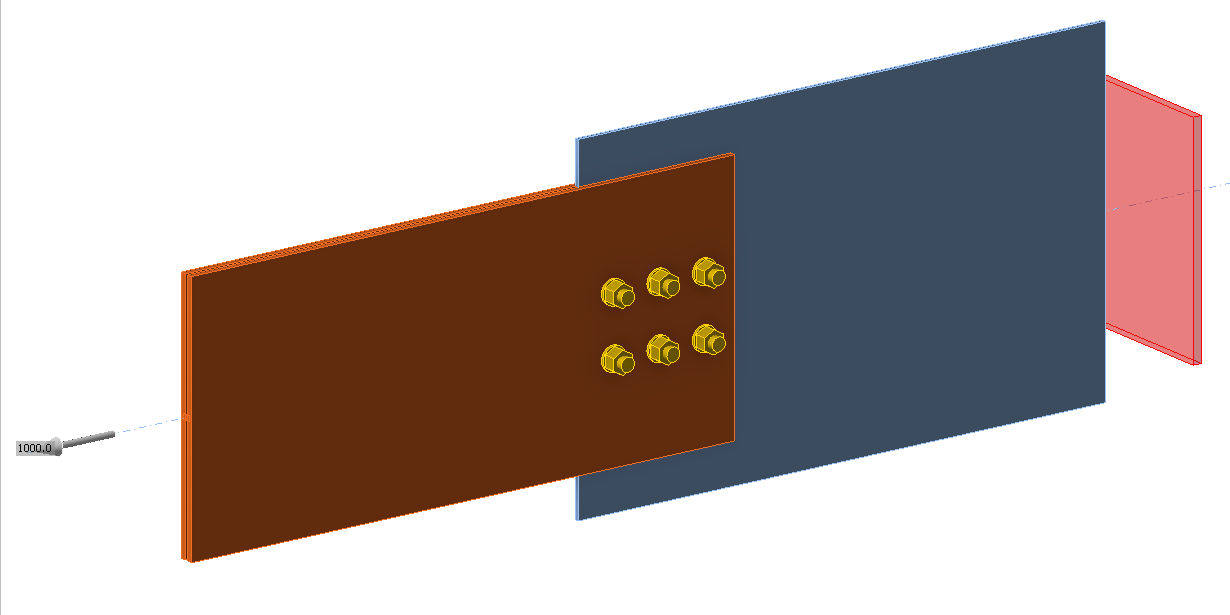
\[ \textsf{\textit{\footnotesize{Fig. 5.6.9 Benchmark example}}}\]